

Justin Sullivan
Thesis
As a top-down investor, I track sector funds for two main purposes: A) as a starting point to identify promising areas to look closer; and B) also as a starting point to benchmark individual stocks’ profitability and valuation.
And now what I see is that the corrections for the semiconductor sector, represented by the iShares Semiconductor ETF (NASDAQ:SOXX), are overblown as you can see from the following chart. The sector has suffered a 40.8% correction this year off its peak. It is the third-largest correction in the exchange-traded fund’s (“ETF”) entire history. The only two other corrections that are larger are the one it suffered during the bursting of the 2002 dot.com bubble (about 65%), and then during the 2008 Great Recession (about 70%). Its current correction this year is almost 2x deeper than the overall market represented by the SPDR S&P 500 ETF Trust (SPY).
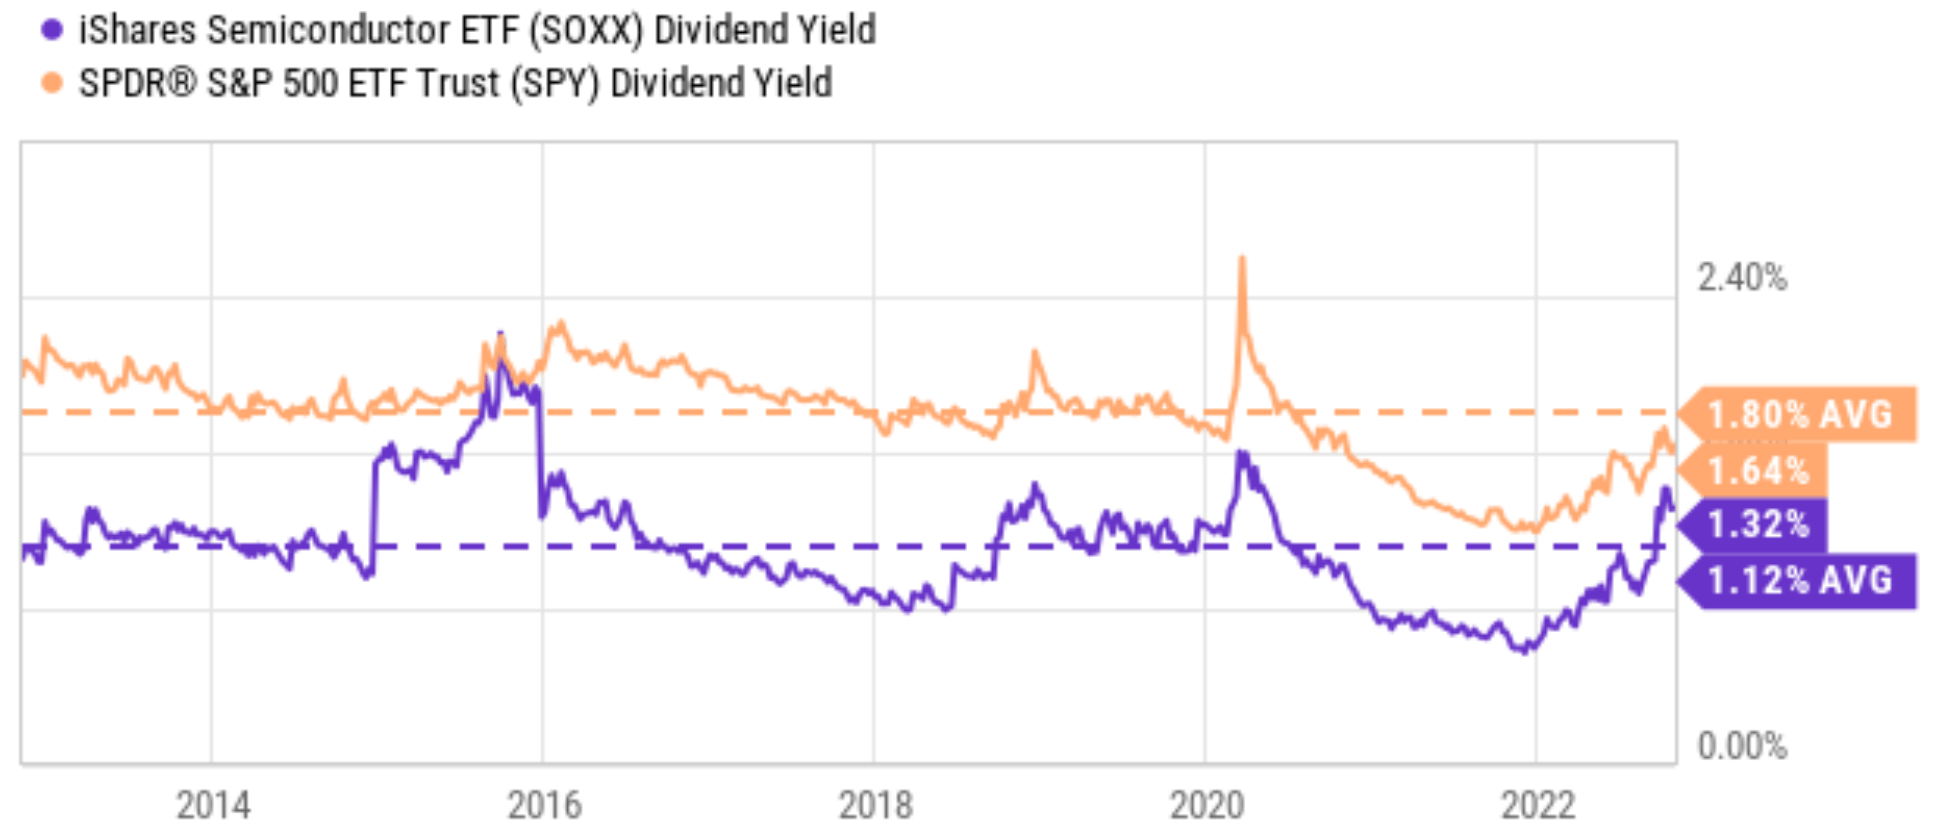
Due to such large corrections, the sector’s valuation is currently severely compressed. The SOXX fund historically trades at a significant premium relative to SPY. Not that long ago (around Mar 2022), SOXX was trading at 31+ P/E, in contrast to SPY’s ~26x. The corrections so far have reversed their valuation relationship. SOXX is currently priced at a P/E of 14.6x, while SPY trades at 19.6x. In terms of dividend yields, the picture is the same, as you can see from the second chart below. SOXX’s dividend yield of 1.32% currently is higher than its historical average of 1.12% by 18%, indicating an 18% discount. While, in contrast, SPY’s dividend yield of 1.64% is still lower than its historical average of 1.80% slightly, still indicating some degree of overvaluation.
After identifying the semiconductor sector as a promising place to dig further, next, you will see why QUALCOMM Incorporated (NASDAQ:QCOM) is an even better idea than the sector itself.
Source: Seeking Alpha data Source: Seeking Alpha data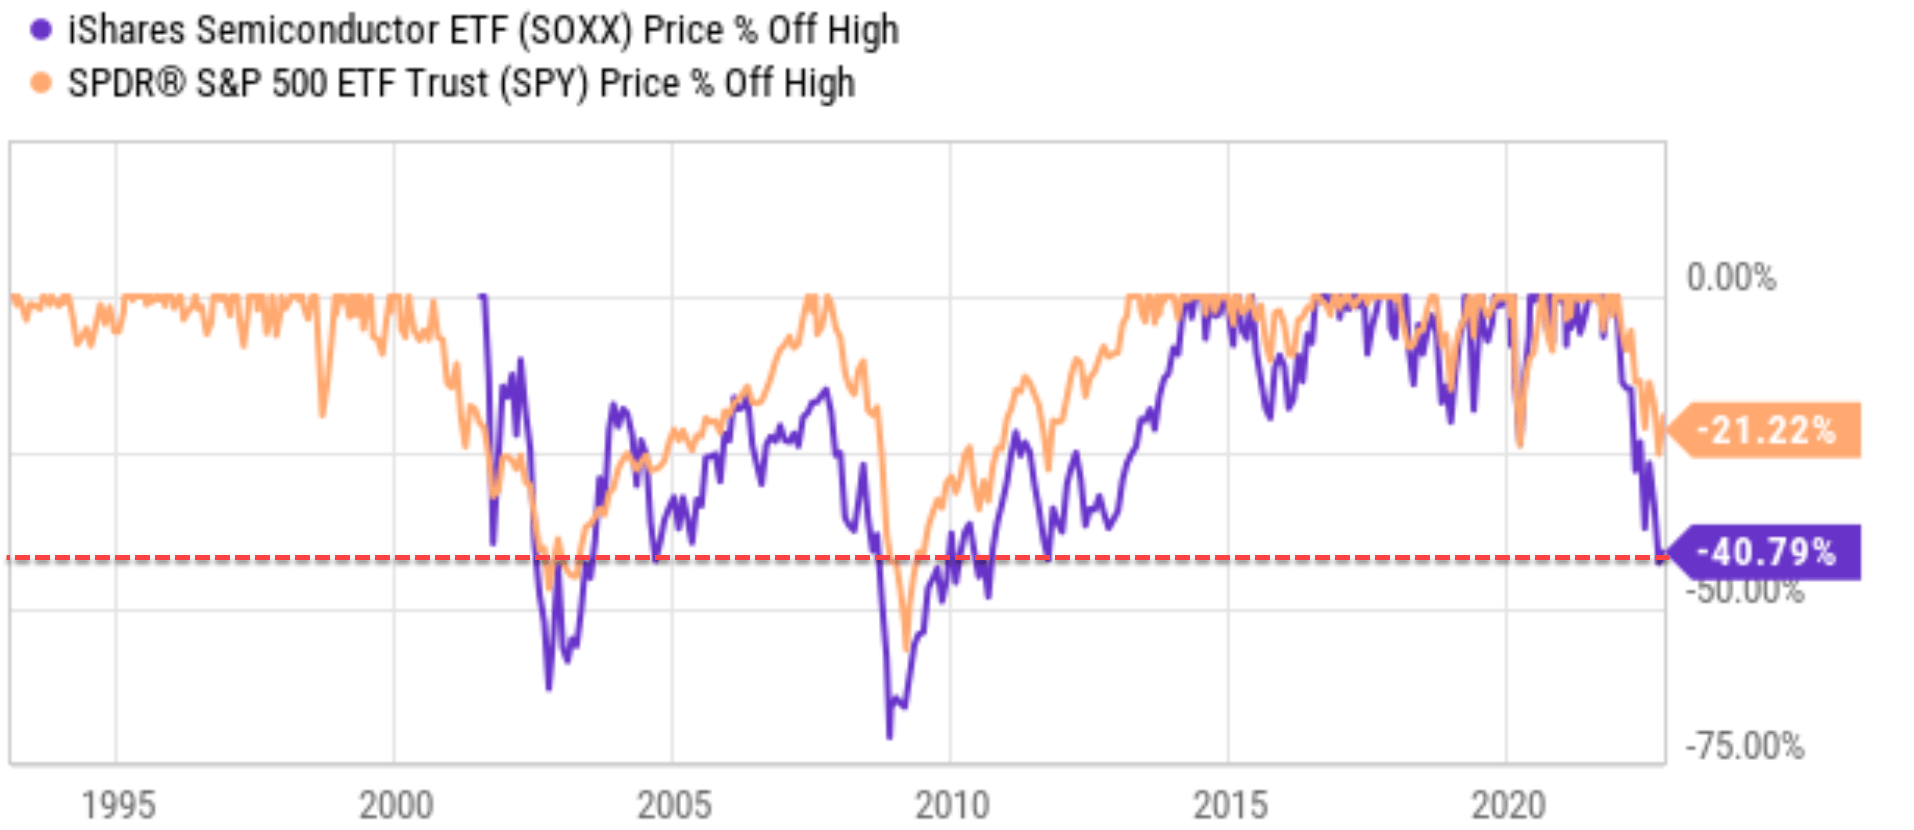
Why QCOM is an even stronger choice than the SOXX?
Sometimes, a sector is made attractive (or unattractive) by a few leading component stocks that have heavy weights in it. It is not the case here with SOXX. We have analyzed several of the leading component stocks in SOXX recently, such as Intel (INTC), Texas Instruments Incorporated (TXN), and Advanced Micro Devices (AMD). They are all strong candidates in my view, with a wide moat and compressed valuations. And in the remainder of this article, I will concentrate on another leading stock in SOXX: QCOM. As seen in the next chart, QCOM is the 4th largest holding in the SOXX fund, representing 6.06% of its total assets.
Source: Seeking Alpha data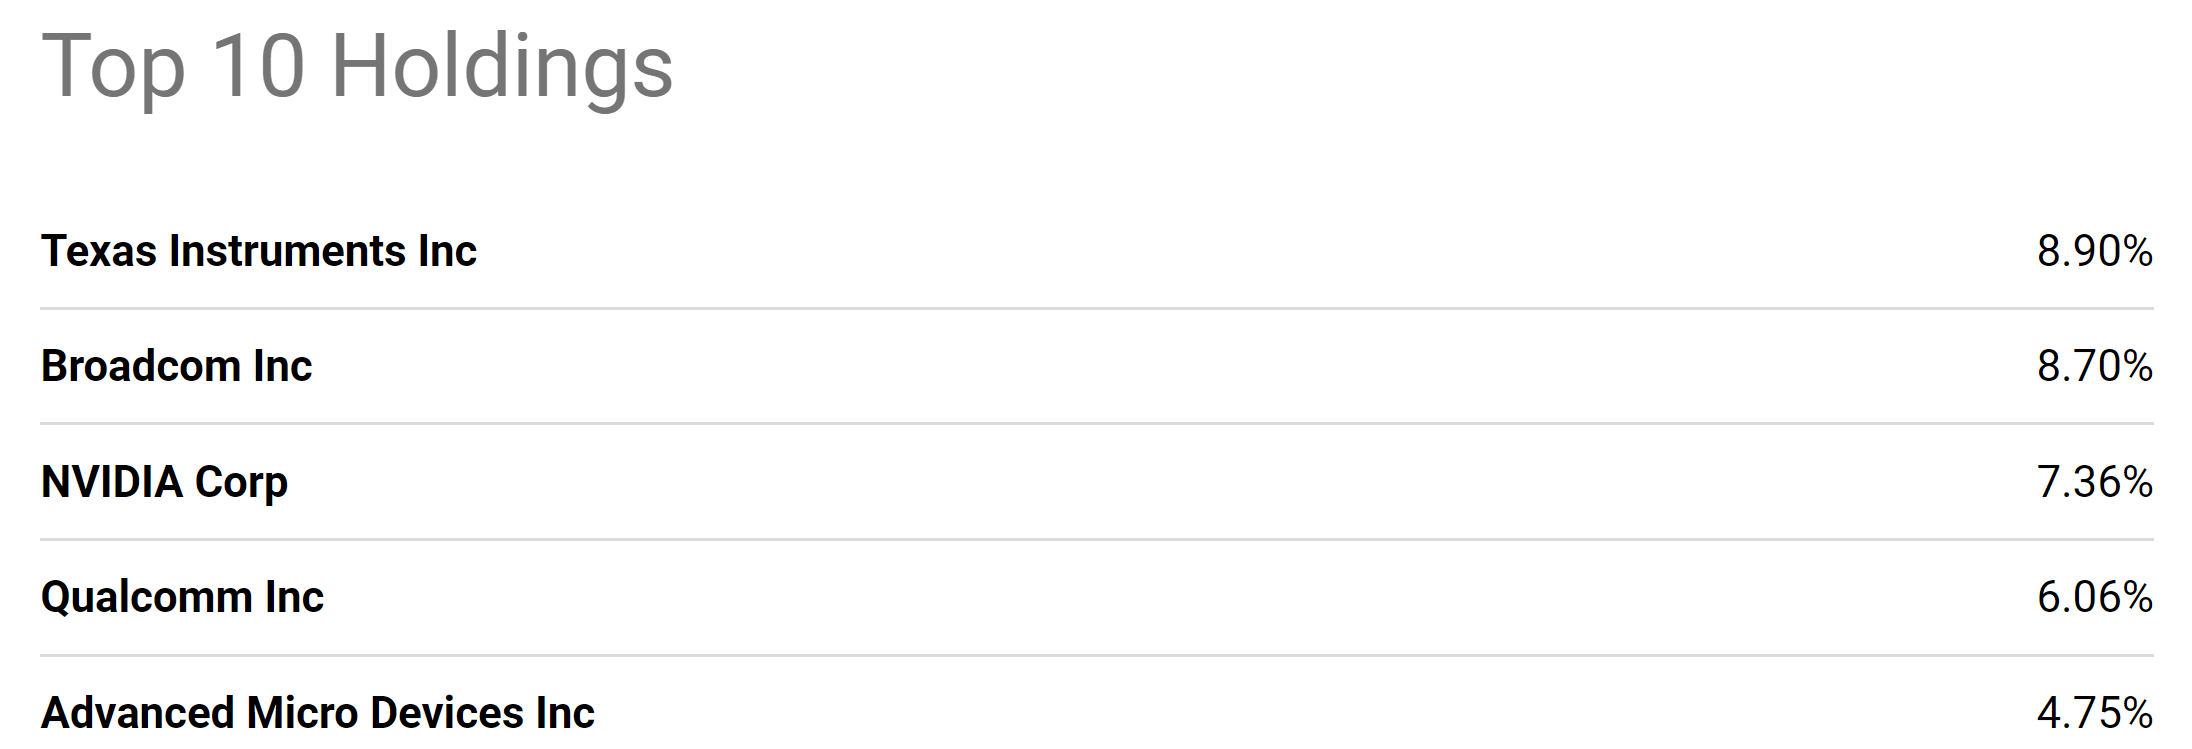
The next two charts compare QCOM and SOXX in terms of their profitability, valuation, and historical performances. The information used in the 1st chart was taken either from Yahoo Finance or from Seeking Alpha before the market’s open on November 7, 2022. Given the market volatility in recent trading days, the exact numbers may be different when you read this article. A few noteworthy observations from this comparison:
- QCOM provides far better profitability than SOXX. QCOM’s operating margin currently hovers around 32.6%, about 21% higher than SOXX. And its ROCE (return on capital employed) is about 44.3%, a whopping 72% above SOXX’s 25.8%.
- But on the other hand, QCOM is priced at a large valuation discount from SOXX. Its price/cash flow multiple is only 8.32x, a 30% discount from SOXX. Its P/E is only 8.51x, an even larger 42% discount from SOXX’s 14.64x. And finally, its P/sales ratio is 2.71x, also at a sizable 16% discount from SOXX (despite the fact that QCOM’s net margin is 45% above SOXX, which makes QCOM’s sales more lucrative).
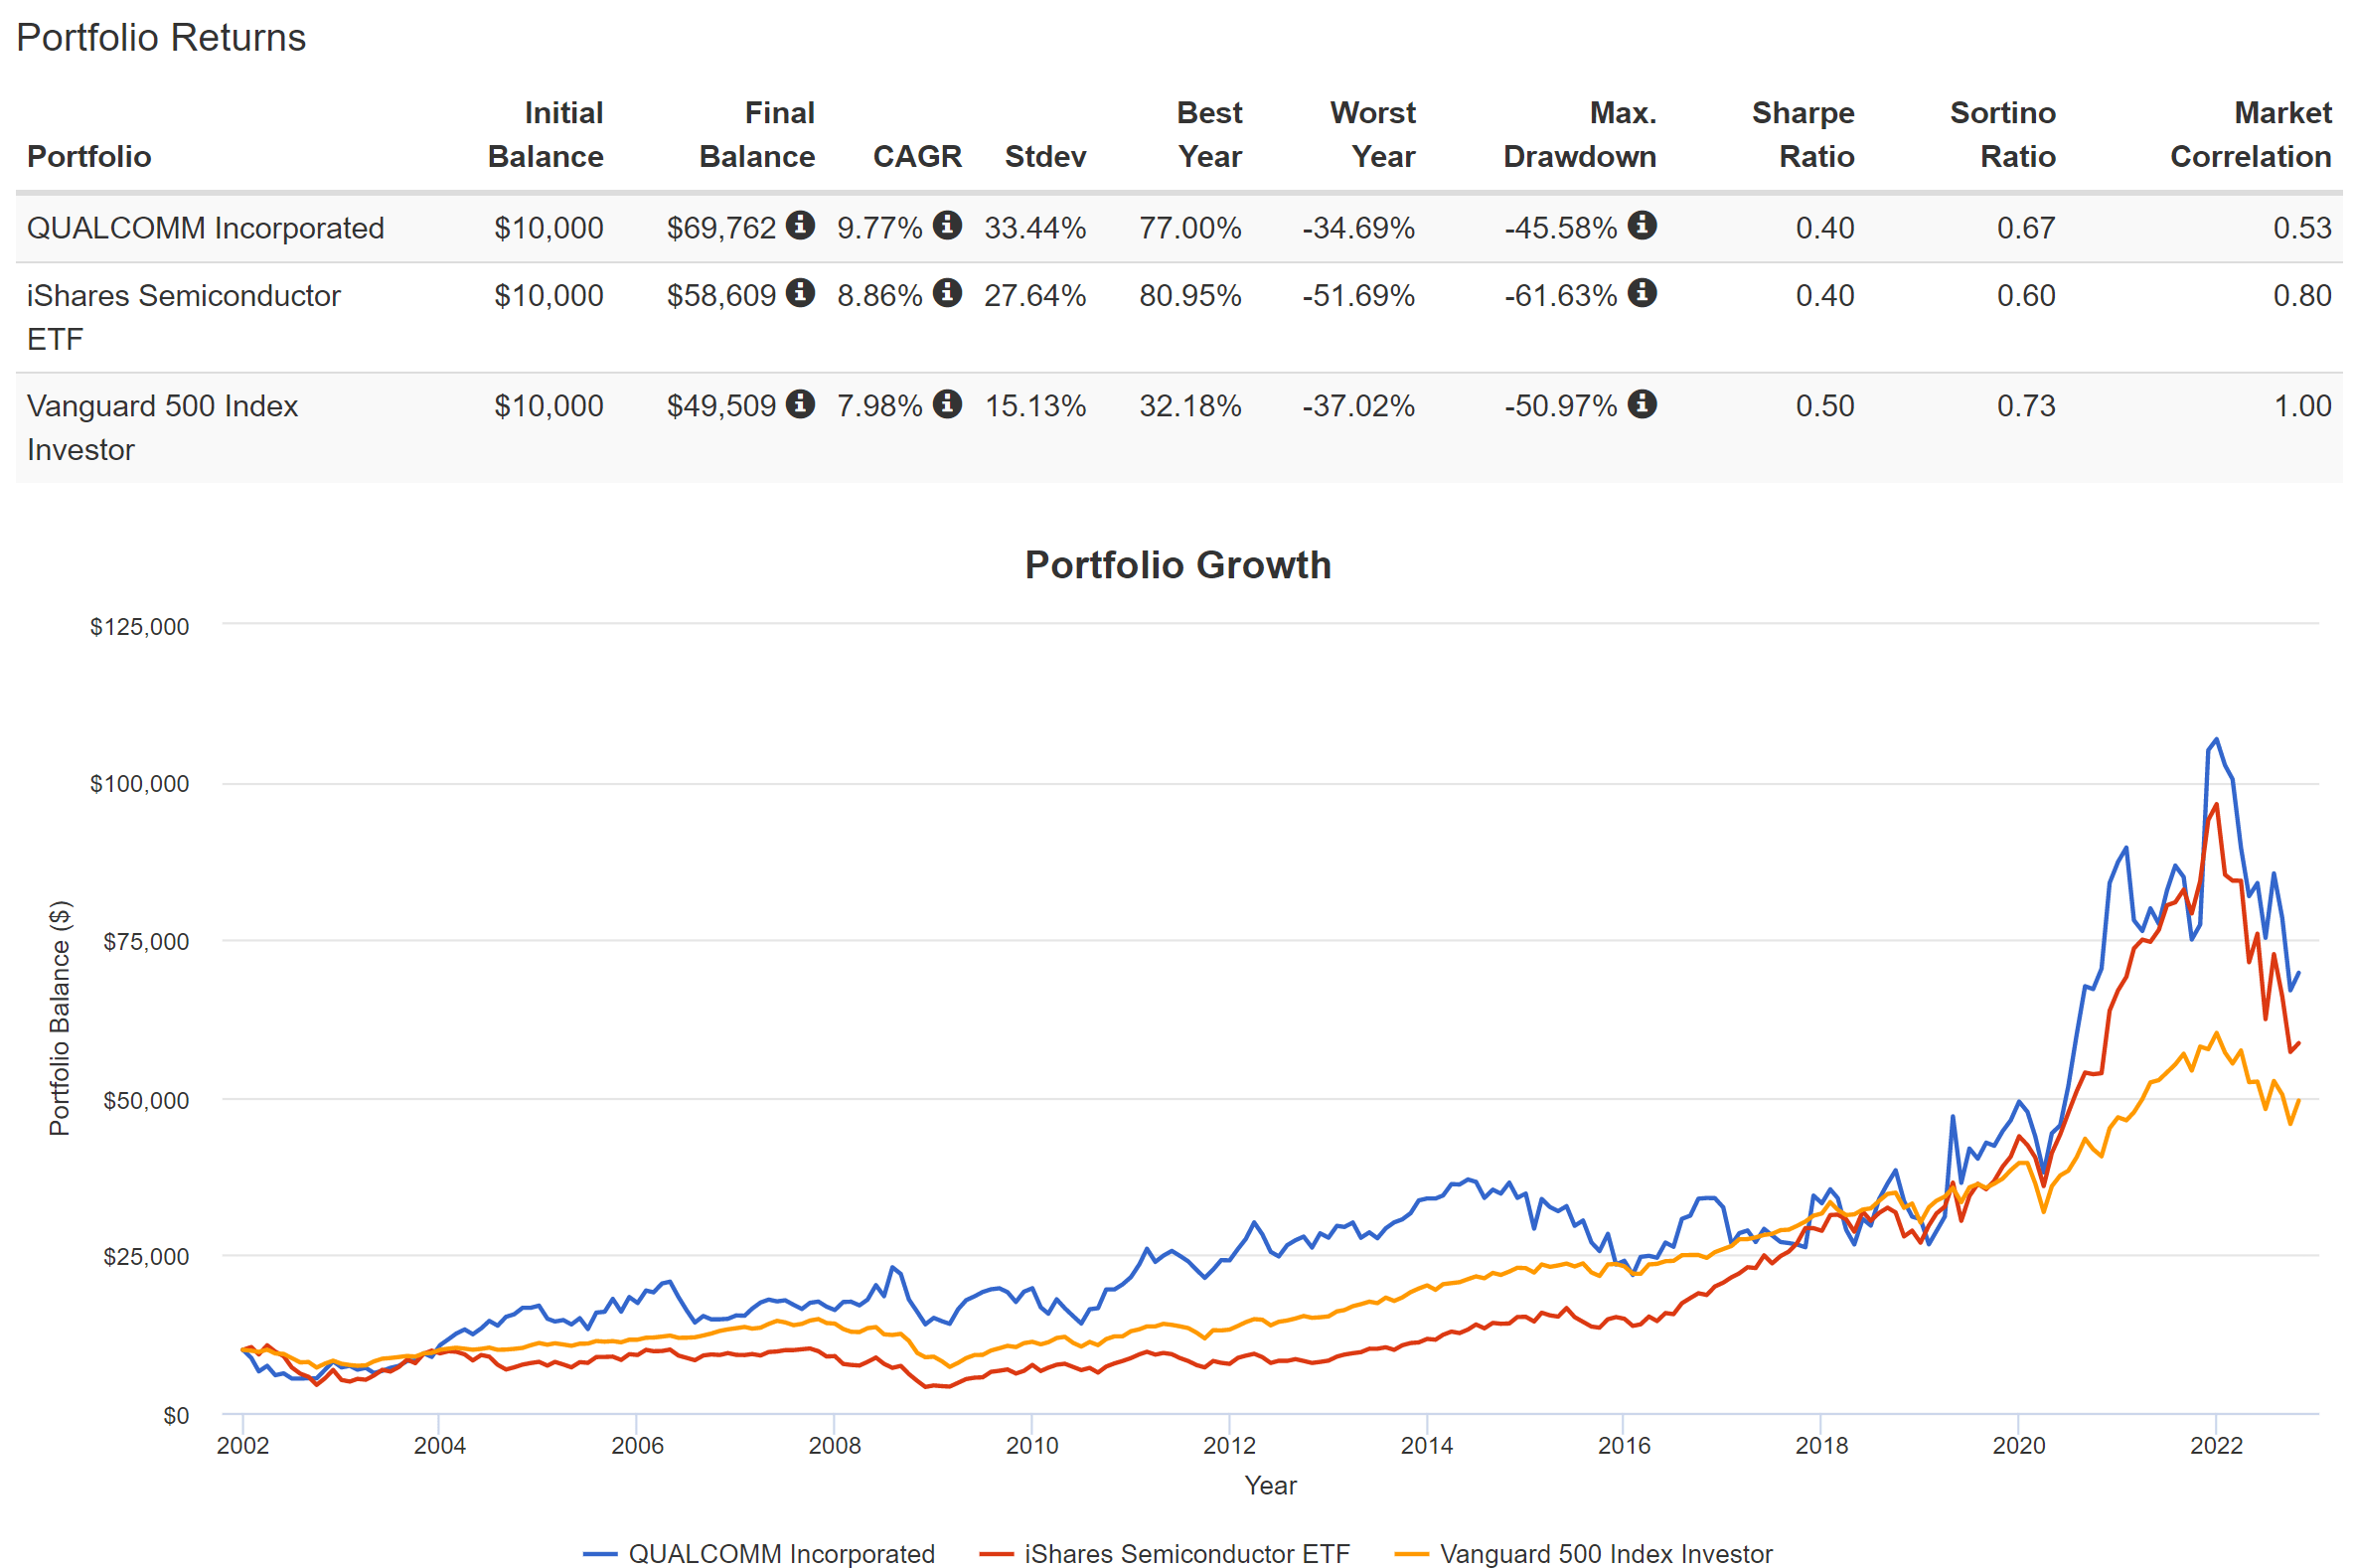
- Historically, QCOM also offered higher total returns with lower price volatility and superior earnings consistency. As you can see from the second chart below, QCOM has returned 9.77% CAGR since 2002, exceeding both SOXX’s 8.86% and SPY’s 7.98% by a good margin. While at the same time, QCOM has suffered substantially lower volatility risks compared to both SOXX and also SPY. To be specific, QCOM’s worst-year performance has been -34.6%, about 3% better compared to SPY’s 37% and more than 17% better than SOXX’s 51%. In terms of worse drawdown, QCOM’s worse drawdown was 45%, again about 5% better than SPY and about 16% better than SOXX’s 61%.
Next, I will dive into some of the specific catalysts that benefit QCOM. Admittedly, some of these catalysts are applicable to the whole SOXX sector, too (and that is why SOXX got my attention in the first place, after all). But considering the scale, profitability, and consistency comparison above, I feel much more strongly about QCOM over SOXX. And, as a result, I foresee QCOM’s outperformance over SOXX in the past to continue into the future as well.
Source: Author based on Yahoo and Seeking Alpha data Source: Portfoliovisualizer.com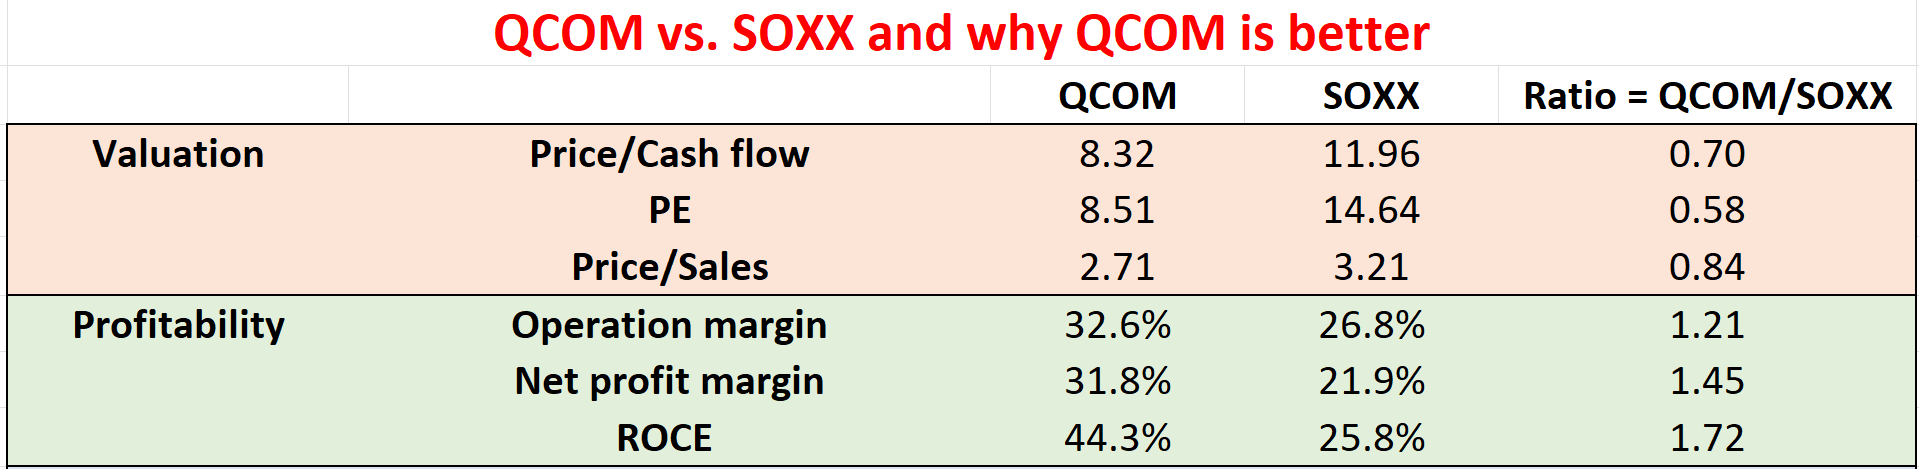
Catalysts and expected returns
QCOM recently reported its 2022 Q3 (or FY Q4) results. The results were admittedly mixed. Its non-GAAP EPS came in at $3.13, in line with consensus estimates. And its revenue came in at $11.4B, representing a 22.1% YOY growth rate, beating consensus estimates by $40M. On the negative side, however, the company lowered its sales growth projections and also EPS guidance due to macroeconomic headwinds and also inventory buildup. Specifically, management commented in its CY 2022 Q3 earnings report that (abridged and emphases added by me):
Given the uncertainty caused by the macroeconomic environment, we are updating our guidance for calendar year 2022 3G/4G/5G handset volumes from a YOY mid-single-digit percentage decline, to a low double-digit percentage decline…. The rapid deterioration in demand and easing of supply constraints across the semiconductor industry have resulted in elevated channel inventory. Due to these elevated levels, our largest customers are now drawing down on their inventory, negatively impacting the mid-point of our EPS guidance for the first quarter of fiscal 2023 by approximately ($0.80).
Source: QCOM 2022 CY Q3 earnings report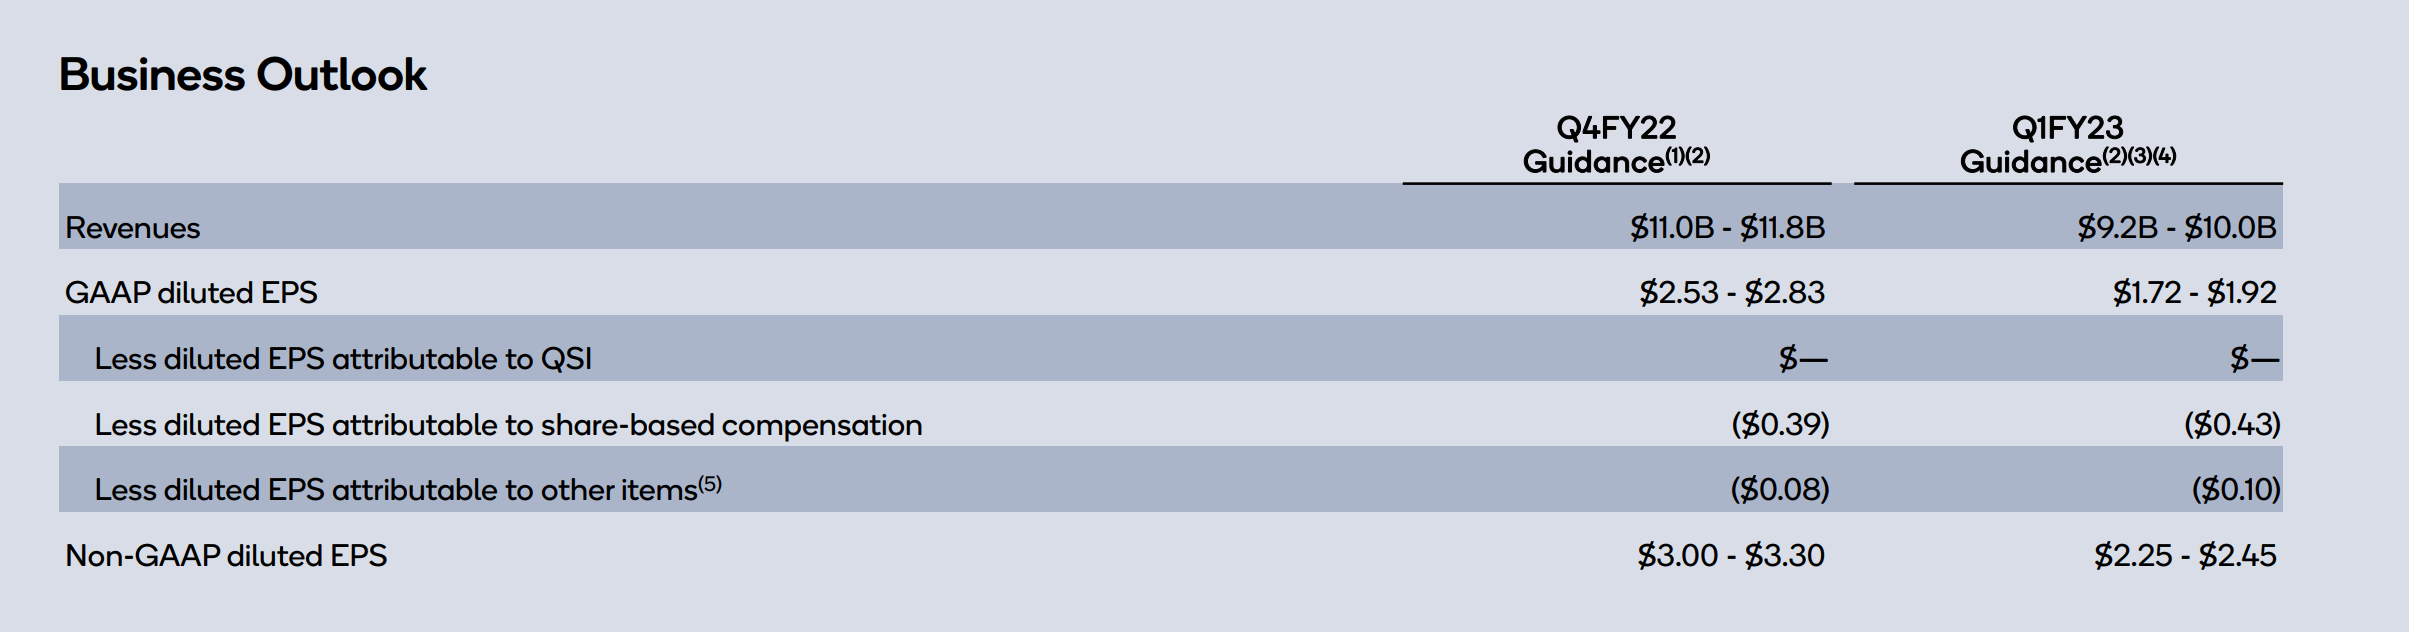
Despite these near-term set headwinds, I see several reasons to be optimistic in the longer term. For example, I expect QCOM’s heavy investment in the automotive space to bear fruits in the next few years. QCOM has recently added $3 billion to the automotive pipeline during the quarter, which brings its total to $19 billion. Besides its heavy investment in auto, it is also well positioned in other high-growth and high-margin areas, including the Internet of Things (“IOT”), 5G to the home, and consumer application devices (tablets, PC, metaverse, wearables, and hearables). These initiatives should not only diversify Qcom’s business away from handsets, but also expand it to potentially explosive addressable markets. As a final catalyst, a new multi-year licensing agreement was inked with Samsung (OTCPK:SSNLF, OTCPK:SSNNF) recently, implying that a greater percentage of chips in Samsung’s next-generation flagship devices will be designed by QCOM.
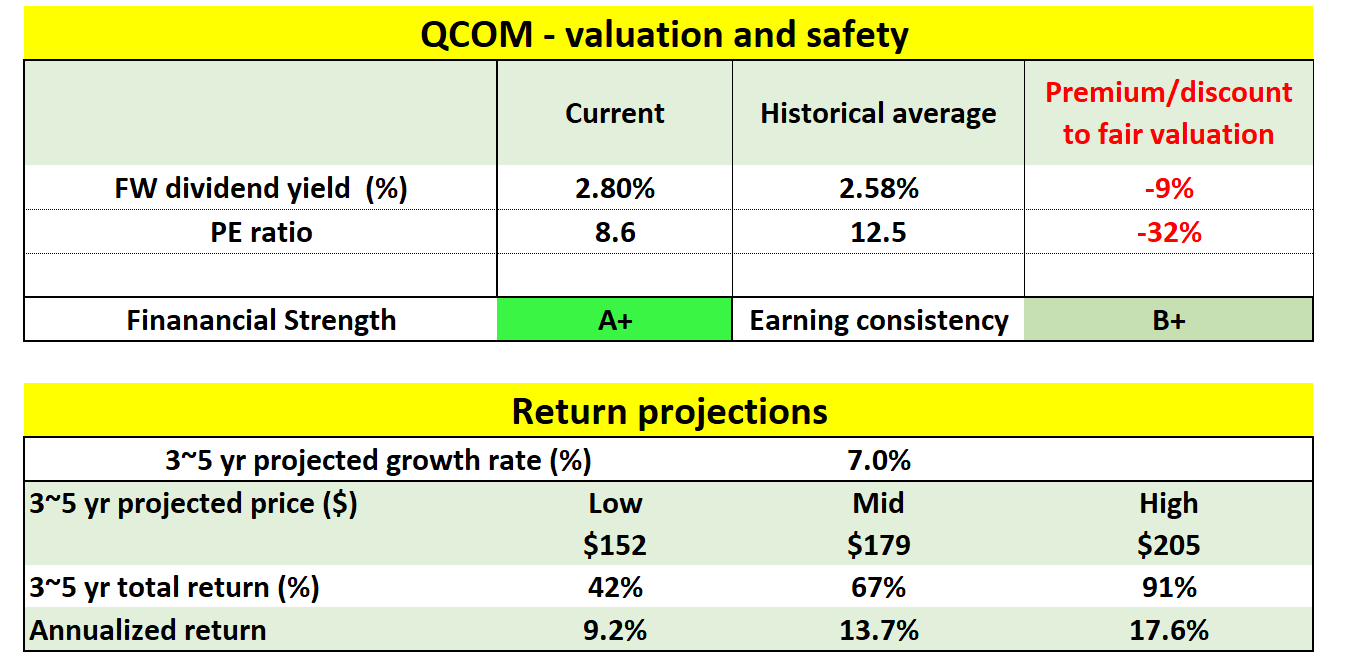
Thanks to these catalysts, combined with the superior profitability and scale as mentioned above, I foresee QCOM’s past outperformance over SOXX to continue into the future as well. And its current valuation compression provides a further margin of safety. My return projections are shown in the two charts below. In the case of SOXX, the upside is substantial (67% total return in the next 3~5 years) and the downside is quite limited (a small total gain of 11%). As seen, the return profile of QCOM is even more skewed. QCOM’s projected return is in the range of 91% in the next 3~5 years to about 42%, translating into an annual return in the range of 9.2% to 17.6%.
Source: Author based on Yahoo and Seeking Alpha data Source: Author based on Yahoo and Seeking Alpha data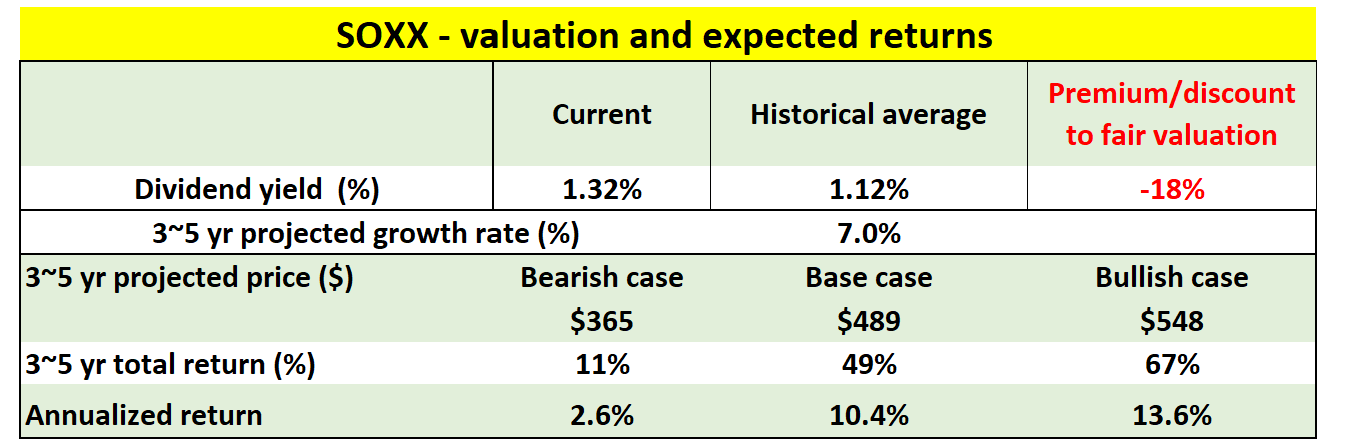
Risks and final thoughts
Both QCOM and SOXX face some risks, both in terms of macroeconomic risks and also specific risks. As aforementioned, the demand deterioration across the semiconductor can impact both QCOM and SOXX negatively. Plus, the elevated channel inventory is also an industry-wide issue.
In general, I expect OEMs in the broader sector to be more cautious in the next few quarters with their purchases, owing largely to uncertain global economic conditions and also their earlier hoarding of chips caused by the global supply chain disruptions. Specific to QCOM, the COVID pandemic pulled forward phone upgrades. And I expect the demand for its mobile chips, especially the premium end such as those used in Samsung’s Galaxy S22 series, to continue renormalizing in the near term.
To conclude, we track sector funds to identify promising sectors to dig further and also to use them as a starting point to benchmark individual stocks’ profitability and valuation. I am seeing the corrections for the semiconductor sector overdone, creating the best entry opportunity in multi-years. SOXX’ valuation has historically been significantly higher than the overall market, but the price corrections this year have reversed the valuation relationship.
Digging deeper, I see QCOM as an even more attractive idea than SOXX. QCOM has outperformed SOXX (and the overall market too) in the past with lower volatility risks. And I foresee Qualcomm’s superior outperformance to continue into the future thanks to the combination of profitability consistency, severely compressed valuation, and a multitude of catalysts in the pipeline.
Be the first to comment