

G0d4ather/iStock Editorial via Getty Images
It has been a tough time for tech in the last few months, thanks to high valuations and rising interest rates.
Ycharts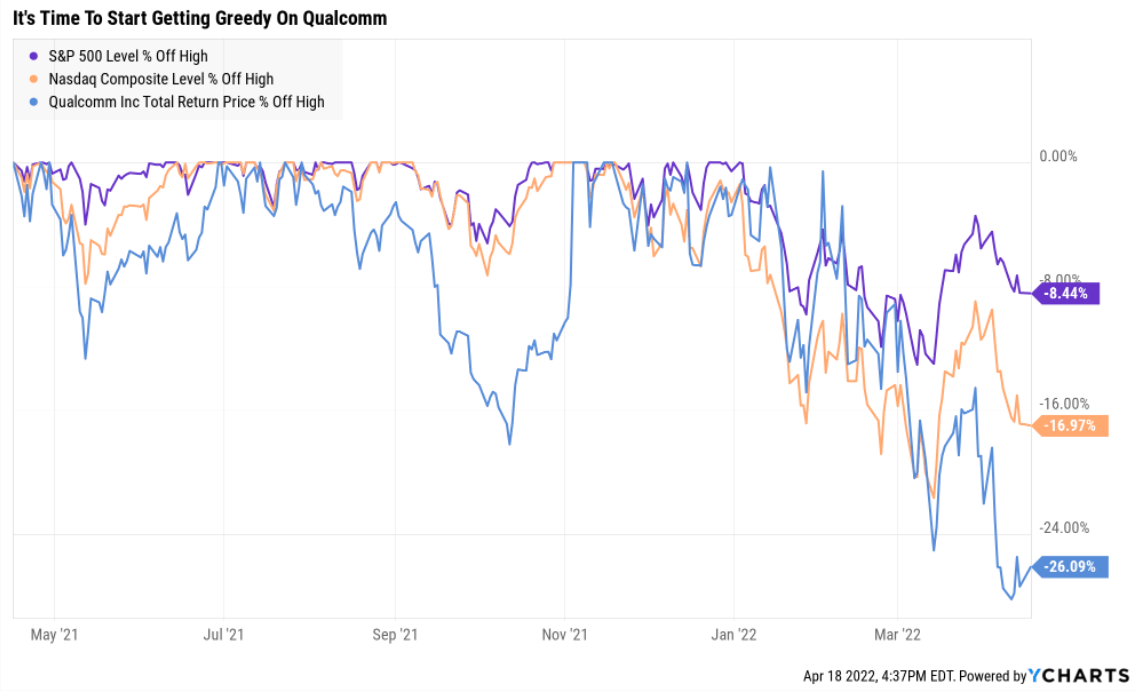
But the same high volatility that causes so many to worry, and world-class blue-chips like Qualcomm (NASDAQ:QCOM) to plunge 30% in a few weeks, is also a potentially wonderful opportunity.
“Be greedy when others are fearful and fearful when others are greedy.” – Warren Buffett
Qualcomm is a recent Dividend Kings’ recommendation that no less than three of our world-class analysts have recommended.
It’s one of my retirement portfolio’s highest priority core grow names, and today I wanted to share with you why.
Not just why Qualcomm is a wonderful company that deserves to be on your watchlist.
Not just a company I’ve personally bought several times in this correction.
But the four reasons why today is a potentially great time to start getting greedy on Qualcomm.
Because this isn’t just a classic-Buffett-style “wonderful company at a fair price”, I believe it to be a wonderful company at a wonderful price.
Reason One: Bottom Line Up Front
Reasons To Potentially Buy Qualcomm
- 93% quality low-risk 13/13 Ultra SWAN chip maker
- very safe 2.2% yield (93% safety score)
- 0.5% average recession dividend cut risk
- 1.4% severe recession dividend cut risk
- 18-year dividend growth streak
- 20% conservatively undervalued (potential strong buy)
- Fair Value: $170.78 (14.0x earnings)
- 11.2X earnings vs 16 to 17.5 historical
- 9.2X cash-adjusted earnings = bargain by private equity standards
- Effective A stable outlook credit rating = 0.66% 30-year bankruptcy risk
- 78th industry percentile risk management consensus = good, bordering on very good
- 11% to 21% CAGR margin-of-error growth consensus range
- 17.5% CAGR median growth consensus
- 5-year consensus total return potential: 15% to 24% CAGR
- base-case 5-year consensus return potential: 20.2% CAGR (5X market consensus)
- consensus 12-month total return forecast: 65% (17.5 PE, reasonable)
- Fundamentally Justified 12-Month Returns: 27% CAGR
QCOM Rolling Returns Since 1992
(Source: Portfolio Visualizer Premium)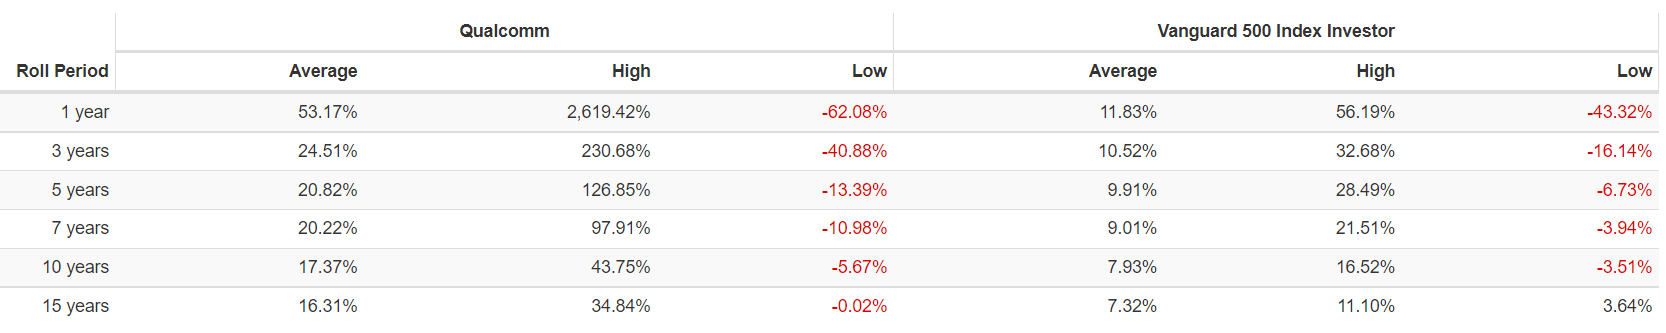
QCOM has historically generated 16 to 17% long-term returns but from bear market lows returns as strong as 35% CAGR for the next 15 years.
- 89X return in 15 years (2002 to 2017)
QCOM 2024 Consensus Total Return Potential
(Source: FAST Graphs, FactSet)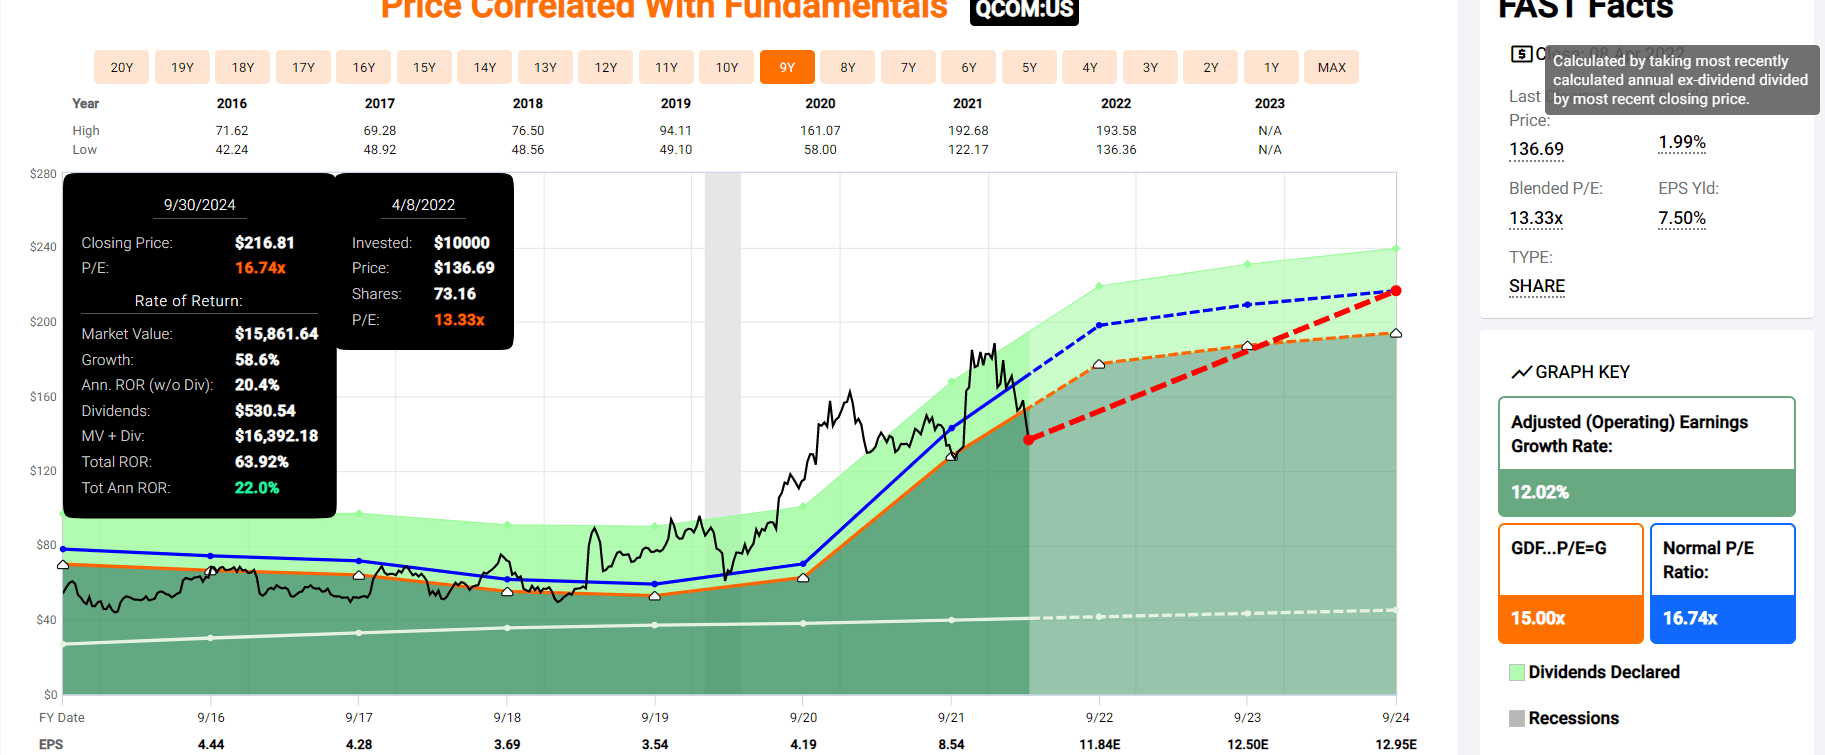
If QCOM grows as analysts expect, by 2024 it could deliver 63% total returns, or 22% annually.
- Buffett-like returns from an anti-bubble blue-chip bargain hiding in plain sight
QCOM 2027 Consensus Total Return Potential
(Source: FAST Graph, FactSet)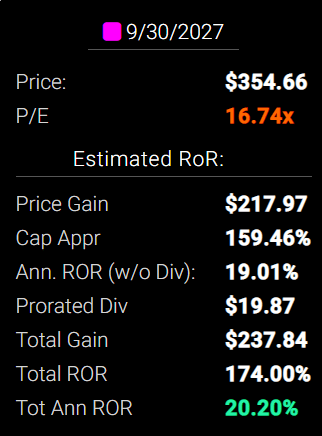
By 2027 if QCOM grows as expected and returns to historical fair value, it could nearly triple and deliver 20% annual total returns.
- also Buffett-like returns
- 5X the S&P 500 consensus
Inflation-Adjusted Consensus Return Potential: $1,000 Initial Investment
| Time Frame (Years) | 7.4% CAGR Inflation-Adjusted S&P Consensus | 8.6% Inflation-Adjusted Aristocrat Consensus | 17.5% CAGR Inflation-Adjusted Low Guidance | Difference Between Inflation Adjusted QCOM And S&P Consensus |
| 5 | $1,429.63 | $1,511.29 | $2,240.65 | $729.36 |
| 10 | $2,043.84 | $2,284.01 | $5,020.51 | $2,736.50 |
| 15 | $2,921.94 | $3,451.81 | $11,249.22 | $7,797.41 |
| 20 | $4,177.29 | $5,216.70 | $25,205.57 | $19,988.87 |
| 25 | $5,971.97 | $7,883.98 | $56,476.87 | $48,592.90 |
| 30 | $8,537.71 | $11,915.01 | $126,544.94 | $114,629.93 |
(Source: DK Research Terminal, FactSet)
If QCOM grows as expected, it could deliver 126X inflation-adjusted returns over the next 30 years, as it has over the last 30 years.
| Time Frame (Years) | Ratio Aristocrats/S&P | Ratio Inflation-Adjusted QCOM And S&P Consensus |
| 5 | 1.06 | 1.57 |
| 10 | 1.12 | 2.46 |
| 15 | 1.18 | 3.85 |
| 20 | 1.25 | 6.03 |
| 25 | 1.32 | 9.46 |
| 30 | 1.40 | 14.82 |
(Source: DK Research Terminal, FactSet)
Over the long-term, QCOM has the potential to deliver 15X the market’s inflation-adjusted returns, turning a small investment today into a medium-sized fortune in the coming decades.
- vs 14X the market’s historical real returns
QCOM Investment Decision Score
DK (Source: DK Automated Investment Decision Tool)
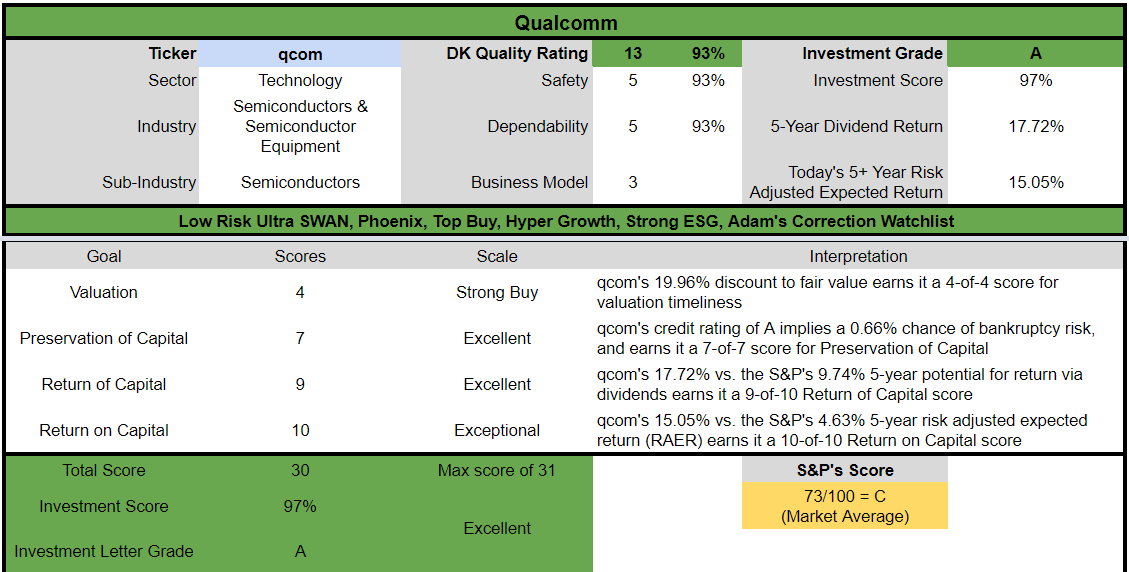
For anyone comfortable with its risk profile, QCOM is one of the most reasonable and prudent hyper-growth Ultra SWANs you can buy today.
- 20% discount vs 15% market premium = 35% better valuation
- far superior fundamental quality and safety
- 100% higher long-term return potential than S&P 500 overtime
- almost 4X the risk-adjusted expected return for the next five years
The biggest potential reason not to buy QCOM right now is the good but not great 2.2% yield.
- QCOM + MMP = 5.5% very safe yield and 16.3% CAGR long-term return potential (K1-tax form)
- QCOM + BTI = 4.8% very safe yield and 17.5% CAGR long-term return potential (no K1-tax form)
Reason Two: Why Qualcomm is A Wonderful Company You Want To Own
The Dividend King’s overall quality scores are based on a 248 point model that includes:
-
dividend safety
-
balance sheet strength
-
credit ratings
-
credit default swap medium-term bankruptcy risk data
-
short and long-term bankruptcy risk
-
accounting and corporate fraud risk
-
profitability and business model
- GF Scores
- growth consensus estimates
-
management growth guidance
-
historical earnings growth rates
-
historical cash flow growth rates
-
historical dividend growth rates
-
historical sales growth rates
-
cost of capital
-
long-term risk-management scores from MSCI, Morningstar, FactSet, S&P, Reuters’/Refinitiv, and Just Capital
-
management quality
-
dividend friendly corporate culture/income dependability
-
long-term total returns (a Ben Graham sign of quality)
-
analyst consensus long-term return potential
In fact, it includes over 1,000 fundamental metrics including the 12 rating agencies we use to assess fundamental risk.
- credit and risk management ratings make up 41% of the DK safety and quality model
- dividend/balance sheet/risk ratings make up 82% of the DK safety and quality model
How do we know that our safety and quality model works well?
During the two worst recessions in 75 years, our safety model 87% of blue-chip dividend cuts, the ultimate baptism by fire for any dividend safety model.
And then there’s the confirmation that our quality ratings are very accurate.
DK Zen Phoenix: Superior Fundamentals Lead To Superior Long-Term Results
| Metric | US Stocks | 189 Real Money DK Phoenix Recs |
| Great Recession Dividend Growth | -25% | 0% |
| Pandemic Dividend Growth | -1% | 6% |
| Positive Total Returns Over The Last 10 Years | 42% | 99.5% (Greatest Investors In History 60% to 80% Over Time) |
| Lost Money/Went Bankrupt Over The Last 10 Years | 47% | 0.5% |
| Outperformed Market Over The Last Decade (290%) | 36% | 46% |
| Bankruptcies Over The Last 10 Years | 11% | 0% |
| Permanent 70+% Catastrophic Decline Since 1980 | 44% | 0.5% |
| 100+% Total Return Over The Past 10 Years | NA | 87% |
| 200+% Total Return Over The Past 10 Years | NA | 66% |
| 300+% Total Return Over The Past 10 Years | NA | 44% |
| 400+% Total Return Over The Past 10 Years | NA | 35% |
| 500+% Total Return Over The Past 10 Years | NA | 27% |
| 600+% Total Return Over The Past 10 Years | NA | 23% |
| 700+% Total Return Over The Past 10 Years | NA | 20% |
| 800+% Total Return Over The Past 10 Years | NA | 18% |
| 900+% Total Return Over The Past 10 Years | NA | 18% |
| 1000+% Total Return Over The Past 10 Years | NA | 16% |
| Sources: Morningstar, JPMorgan, Seeking Alpha |
Basically, historical market data confirms that the DK safety and quality model is one of the most comprehensive and accurate in the world.
This is why I entrust 100% of my life savings to this model and the DK Phoenix blue-chip strategy.
How does QCOM score on one of the world’s best safety and quality models?
QCOM Dividend Safety
| Rating | Dividend Kings Safety Score (161 Point Safety Model) | Approximate Dividend Cut Risk (Average Recession) |
Approximate Dividend Cut Risk In Pandemic Level Recession |
| 1 – unsafe | 0% to 20% | over 4% | 16+% |
| 2- below average | 21% to 40% | over 2% | 8% to 16% |
| 3 – average | 41% to 60% | 2% | 4% to 8% |
| 4 – safe | 61% to 80% | 1% | 2% to 4% |
| 5- very safe | 81% to 100% | 0.5% | 1% to 2% |
| QCOM | 93% | 0.5% | 1.40% |
| Risk Rating | Low-Risk (78th industry percentile risk-management consensus) – speculative | A Stable outlook credit rating 0.66% 30-year bankruptcy risk | 20% OR LESS Max Risk Cap Recommendation |
Long-Term Dependability
| Company | DK Long-Term Dependability Score | Interpretation | Points |
| Non-Dependable Companies | 21% or below | Poor Dependability | 1 |
| Low Dependability Companies | 22% to 60% | Below-Average Dependability | 2 |
| S&P 500/Industry Average | 61% (61% to 70% range) | Average Dependability | 3 |
| Above-Average | 71% to 80% | Very Dependable | 4 |
| Very Good | 81% or higher | Exceptional Dependability | 5 |
| QCOM | 93% | Exceptional Dependability | 5 |
Overall Quality
| QCOM | Final Score | Rating |
| Safety | 93% | 5/5 very safe |
| Business Model | 90% | 3/3 wide moat |
| Dependability | 93% | 5/5 exceptional |
| Total | 93% | 13/13 Ultra SWAN |
| Risk Rating | 3/3 Low Risk | |
| 20% OR LESS Max Risk Cap Rec |
5% Margin of Safety For A Potentially Good Buy |
QCOM: 32nd Highest Quality Master List Company (Out of 506) = 94th Percentile
The DK 500 Master List includes the world’s highest quality companies including:
-
All dividend champions
-
All dividend aristocrats
-
All dividend kings
-
All global aristocrats (such as BTI, ENB, and NVS)
-
All 13/13 Ultra Swans (as close to perfect quality as exists on Wall Street)
- 49 of the world’s best growth stocks
QCOM’s 93% quality score means it’s similar in quality to such blue-chips as
- Amazon (AMZN)
- Alphabet (GOOG) (GOOGL)
- V.F. Corp. (VFC) – dividend king
- W. W. Grainger (GWW) – dividend king
- S&P Global (SPGI) – dividend aristocrat
- Novartis (NVS) – global aristocrat
- Applied Materials (AMAT)
- PepsiCo (PEP) – dividend king
- Nike (NKE)
Even among the world’s highest quality companies, QCOM is higher quality than 94% of them.
Reason Three: Incredible Growth Potential For Decades To Come
QCOM’s legacy IP licensing business is the cash cow but it’s working to diversify its risk profile into new growth areas.
Mobile chip leader Qualcomm just announced that it completed the acquisition of Arriver, the autonomous vehicle software segment of Veoneer.
This acquisition is a big deal for Qualcomm, which is best known for its smartphone chips. The addition of the Arriver business segment will deepen Qualcomm’s relationships with automakers, and the company now has a $13 billion automotive design-win pipeline.” – Motley Fool (emphasis added)
This was a $4.6 billion deal for QCOM, which management and analysts think will make it an industry leader in corrected cars.
In automotive, Qualcomm is becoming the technology partner of choice for the industry, and we’re enabling the transition of the automobile to a digital cloud-connected platform…
We’re well positioned to address up to $30 of 5G RF content per vehicle…
Automotive revenues of $256 million grew 21% year-over-year on the strength of our design wins across our Snapdragon digital chassis.
In IoT (internet of things), we continue to see strong momentum, with revenue growth of 41% year-over-year in the first quarter across consumer, edge networking and industrial…
Additionally, as the Metaverse opportunity materializes, we continue to build on our industry leadership position in VR and AR devices with key ecosystem players, including Meta and Microsoft…
In robotics, specifically, we expect total fiscal ’22 product launches using our platforms to increase by over 50% year-over-year, spanning applications from warehouse automation to public safety, delivery services and in-home assistance. ” – CEO/CFO, Q1 conference call
QCOM is rapidly becoming the industry leader for the most cutting edge chips for everything from automotive, to the metaverse, to robotics to cloud computing
- 70% of 2024 cars are expected to have advanced QCOM chips in them
- QCOM’s cloud computing chip business is growing at 35% CAGR
And QCOM is also a leader in 5G chips for phones, which are expected to see global shipments double to over 1.1 billion by 2024, representing 85% of all global smartphone sales.
QCOM believes that cars in the future will use 10X as many chips as they did in the past.
Today’s cars are rolling supercomputers with an average of 1,400 chips per car, and for EVs it’s over 2,000.
QCOM estimates its automotive segment can grow at 36% annually through 2026, and achieve $8 billion in revenue by 2031.
QCOM is already the preferred partner of over 25 global automakers, ranging from Chevy to Rolls-Royce, BMW, and Tesla.
The $4.6 billion Arriver deal is meant to bolster QCOM’s already strong industry position in chips that improve safety and eventually will allow for driverless cars.
QCOM expects IOT to grow at 17% through 2024 and achieve $9 billion in revenue that year.
Management believes that its legacy businesses, combined with Metaverse, IOT, and connected cars, could increase its total addressable market or TAM, by 7X in the next decade.
Today QCOM has a 35% market share in a rapidly growing $100 billion market.
Within a decade management plans to be targeting a $700 billion annual market.
- QCOM’s growth runway spans decades
QCOM has a good track record of integrating both large and small M&A deals, such as the recent Arriver $4.6 billion deal.
- combined with its strong organic R&D ($6 billion in 2021) this allows QCOM to remain an industry leader in future tech
Management has returned 90% of free cash flow over the last two years or $12 billion, to shareholders via dividends and buybacks.
- $47 billion in capital return in the last five years
The company’s capital return policy is reasonable and prudent.
- The top priority is a steadily growing dividend (10% increase for 2022 recently announced)
- anti-dilution buybacks (to offset stock-based compensation)
- opportunistic buybacks
- maintaining its A-rated balance sheet
Quantitative Analysis: The Math Backing Up The Investment Thesis
QCOM Credit Ratings
| Rating Agency | Credit Rating | 30-Year Default/Bankruptcy Risk | Chance of Losing 100% Of Your Investment 1 In |
| S&P | A stable | 0.66% | 151.5 |
| Moody’s | A2 (A equivalent) Stable | 0.66% | 151.5 |
| Consensus | A stable | 0.66% | 151.5 |
(Source: S&P, Moody’s)
Qualcomm Inc. Upgraded To ‘A’ On Strong Growth Trajectory And Broadening Revenue Streams; Outlook Stable
U.S.-based Qualcomm Inc. will continue to benefit from the 4G to 5G transition over the next few years, supported by strong handset revenue growth and further diversification into adjacent areas such as radio frequency front-end (RFFE), auto, and internet-of-things (IOT) by leveraging its core baseband technology leadership.” – S&P
S&P upgraded QCOM to A stable in December of 2021.
S&P and Moody’s agree that the fundamental risk of buying QCOM today is approximately 0.66%.
- 1 in 152 chance of losing all your money
QCOM Leverage Consensus Forecast
| Year | Debt/EBITDA | Net Debt/EBITDA (1.5 Or Less Safe According To Credit Rating Agencies) |
Interest Coverage (8+ Safe) |
| 2020 | 2.15 | 0.62 | 10.28 |
| 2021 | 1.18 | 0.25 | 22.29 |
| 2022 | 0.91 | 0.03 | 31.13 |
| 2023 | 0.88 | -0.40 | 36.19 |
| 2024 | 0.84 | -0.73 | 45.21 |
| Annualized Change | -20.91% | NA | 44.81% |
(Source: FactSet Research Terminal)
Analysts expect QCOM’s balance sheet to keep getting steadily stronger over time, with more cash than debt by 2023.
QCOM Balance Sheet Consensus Forecast
| Year | Total Debt (Millions) | Cash | Net Debt (Millions) | Interest Cost (Millions) | EBITDA (Millions) | Operating Income (Millions) | Average Interest Rate |
| 2020 | $15,726 | $6,707 | $4,512 | $577 | $7,325 | $5,932 | 3.67% |
| 2021 | $15,745 | $7,116 | $3,331 | $528 | $13,352 | $11,770 | 3.35% |
| 2022 | $15,750 | $12,322 | $446 | $517 | $17,283 | $16,094 | 3.28% |
| 2023 | $15,750 | $19,656 | -$7,234 | $478 | $17,974 | $17,297 | 3.03% |
| 2024 | $15,750 | $22,876 | -$13,617 | $393 | $18,747 | $17,768 | 2.50% |
| Annualized Growth | 0.04% | 35.90% | NA | -9.15% | 26.48% | 31.56% | -9.19% |
(Source: FactSet Research Terminal)
QCOM’s debt is expected to remain stable at just under $16 billion while its cash flow grows at incredible rates of nearly 30% annually and its cash position grows at 36% annually.
Bond Profile
- $19.8 billion in liquidity
- 100% unsecured bonds (maximum financial flexibility)
- well-staggered bond maturities, no trouble refinancing maturing debt
- 3.53% average borrowing cost vs bond market’s 2.5% long-term inflation forecast
- QCOM’s effective real interest rate is 1% vs 26% cash return on invested capital
- returns on investment are 26X its real borrowing cost
- in the coming years, analysts expect borrowing costs to fall to 2.5% (0% inflation-adjusted) due to QCOM’s stronger balance sheet and potential credit rating upgrades
Profitability: Wall Street’s Favorite Quality Proxy
(Source: Gurufocus Premium)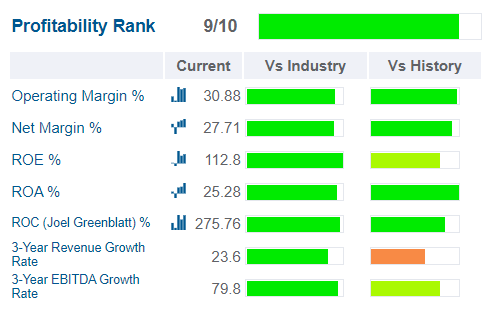
QCOM’s profitability is historically within the top 10% of chipmakers.
QCOM Trailing 12-Month Profitability Vs Peers
| Metric | Industry Percentile | Major Chip Makers More Profitable Than QCOM (Out Of 887) |
| Operating Margin | 91.52 | 75 |
| Net Margin | 90.72 | 82 |
| Return On Equity | 99.77 | 2 |
| Return On Assets | 93.57 | 57 |
| Return On Capital | 96.61 | 30 |
| Average | 94.44 | 49 |
(Source: Gurufocus Premium)
In the last year, QCOM’s average profitability was in the top 6% of peers, with just 49 major chip makers on earth more profitable than QCOM.
Over the last 30 years, QCOM’s industry-leading profitability has been stable or improving, confirming a wide and stable moat.
QCOM Margin Consensus Forecast
| Year | FCF Margin | EBITDA Margin | EBIT (Operating) Margin | Net Margin | Return On Capital Expansion |
Return On Capital Forecast |
| 2020 | 20.4% | 33.8% | 27.4% | 22.2% | 1.06 | |
| 2021 | 25.9% | 39.9% | 35.2% | 29.3% | TTM ROC | 275.76% |
| 2022 | 26.2% | 40.9% | 38.1% | 31.7% | Latest ROC | 345.10% |
| 2023 | 32.0% | 39.5% | 38.0% | 31.2% | 2024 ROC | 291.49% |
| 2024 | 30.2% | 39.2% | 37.2% | 30.6% | 2024 ROC | 364.79% |
| 2025 | NA | NA | NA | NA | Average | 328.14% |
| 2026 | NA | NA | NA | NA | Industry Median | 19.77% |
| 2027 | NA | NA | NA | NA | QCOM/Industry Median | 16.60 |
| Annualized Growth | 10.34% | 3.77% | 7.93% | 8.29% | Vs S&P | 22.48 |
| Annualized Growth (Ignoring Pandemic) | 7.21% | -0.56% | 1.87% | 1.43% |
(Source: FactSet Research Terminal)
QCOM’s profitability is expected to improve by an astounding amount, with free cash flow margins rising to 30% by 2024.
Return on capital is pre-tax profit/operating capital (the money it takes to run the business).
- Joel Greenblatt’s gold standard proxy for quality and moatiness
Analysts are expecting a 328% ROC in 2024.
- the average investment pays for itself in 3.7 months vs 7 years for the S&P 500
- over 16X the industry’s ROC
- over 22X the S&P 500’s ROC
QCOM’s ROC Has Been Growing At 10.4% CAGR Since 1993
QCOM’s ROC has been doubling every seven years for 29 years.
QCOM’s ability to sustain industry-leading profitability over the decades despite all its challenges and risks confirms a wide and stable moat.
QCOM Growth Spending Consensus Forecast
| Year | SG&A (Selling, General, Administrative) | R&D | Capex | Total Growth Spending | Sales | Growth Spending/Sales |
| 2020 | $1,720 | $5,097 | $1,407 | $8,224 | $21,654 | 37.98% |
| 2021 | $1,844 | $5,870 | $1,888 | $9,602 | $33,467 | 28.69% |
| 2022 | $2,124 | $6,874 | $2,051 | $11,049 | $42,241 | 26.16% |
| 2023 | $2,334 | $7,528 | $2,072 | $11,934 | $45,520 | 26.22% |
| 2024 | $2,621 | $8,528 | $2,226 | $13,375 | $47,795 | 27.98% |
| Annualized Growth | 11.11% | 13.73% | 12.15% | 12.93% | 21.89% | -7.35% |
| Total Spending 2020 to 2024 | $8,022 | $25,369 | $9,644 | $40,809 |
(Source: FactSet Research Terminal)
QCOM’s growth spending is expected to nearly double between 2020 and 2024, and the company’s total growth spending from 2020 through 2024 is an estimated $41 billion.
QCOM Medium-Term Growth Consensus Forecast
| Year | Sales | Free Cash Flow | EBITDA | EBIT (Operating Income) | Net Income |
| 2020 | $21,654 | $4,407 | $7,325 | $5,932 | $4,816 |
| 2021 | $33,467 | $8,662 | $13,352 | $11,770 | $9,811 |
| 2022 | $42,241 | $11,085 | $17,283 | $16,094 | $13,382 |
| 2023 | $45,520 | $14,558 | $17,974 | $17,297 | $14,208 |
| 2024 | $47,795 | $14,417 | $18,747 | $17,768 | $14,619 |
| Annualized Growth | 21.89% | 34.49% | 26.48% | 31.56% | 32.00% |
| Annualized Growth (Ignoring Pandemic) | 12.61% | 18.51% | 11.98% | 14.72% | 14.22% |
(Source: FactSet Research Terminal)
Even ignoring the pandemic chip boom, QCOM is expected to grow revenues at 13% and its bottom line between 12% and 19% annually through 2024.
| Metric | 2020 Growth | 2021 Growth Consensus | 2022 Growth Consensus | 2023 Growth Consensus |
2024 Growth Consensus |
| Sales | 3% | 43% | 27% | 8% | 5% |
| Dividend | 5% | 5% | 10% (official) | 3% | 7% (20-year growth streak) |
| EPS | 18% | 104% | 39% | 6% | 4% |
| Operating Cash Flow | -15% | 81% | 25% | 29% | 1% |
| Free Cash Flow | -27% | 97% | 27% | 29% | -3% |
| EBITDA | -15% | 49% | 54% | 5% | 4% |
| EBIT (operating income) | -18% | 57% | 67% | 6% | 3% |
(Source: FAST Graphs, FactSet Research)
Analysts expect QCOM to achieve a 20-year dividend growth streak in 2024, though dividends are expected to grow at a modest rate.
QCOM Dividend Growth Consensus Forecast
| Year | Dividend Consensus | FCF/Share Consensus | FCF Payout Ratio | Retained (Post-Dividend) Free Cash Flow | Buyback Potential | Debt Repayment Potential |
| 2021 | $2.66 | $7.53 | 35.3% | $5,479 | 3.56% | 34.8% |
| 2022 | $2.76 | $8.98 | 30.7% | $6,998 | 4.54% | 44.4% |
| 2023 | $2.85 | $12.15 | 23.5% | $10,463 | 6.79% | 66.4% |
| 2024 | $3.05 | $12.26 | 24.9% | $10,361 | 6.73% | 65.8% |
| Total 2021 Through 2024 | $11.32 | $40.92 | 27.7% | $27,821.25 (2022 -2024) | 18.06% | 176.70% |
| Annualized Rate | 4.67% | 17.64% | -11.03% | 23.66% | 23.66% | 23.65% |
(Source: FactSet Research Terminal)
50% is the safety payout ratio for chipmakers, and QCOM’s is expected to fall to less than half that by 2023.
Its $28 billion in retained free cash flow is expected to be enough to repay almost 2X over or buy back 18% of shares at current valuations.
QCOM Buyback Consensus Forecast
| Year | Consensus Buybacks ($ Millions) | % Of Shares (At Current Valuations) | Market Cap |
| 2022 | $3,978.0 | 2.6% | $154,049 |
| 2023 | $4,109.0 | 2.7% | $154,049 |
| 2024 | $4,667.0 | 3.0% | $154,049 |
| Total 2022-2024 | $12,754.00 | 8.3% | $154,049 |
| Annualized Rate | 2.85% | Average Annual Buybacks | $4,251.33 |
(Source: FactSet Research Terminal)
Analysts expect an average of $4.25 billion in buybacks over the next three years or just under 3% of shares at current valuations.
QCOM’s historical buyback rate is 5.1% CAGR though about half of its buybacks came in 2018 alone.
| Time Frame (Years) | Net Buyback Rate | Shares Remaining | Net Shares Repurchased | Each Share You Own Is Worth X Times More (Not Including Future Growth And Dividends) |
| 5 | 2.9% | 86.54% | 13.46% | 1.16 |
| 10 | 2.9% | 74.89% | 25.11% | 1.34 |
| 15 | 2.9% | 64.81% | 35.19% | 1.54 |
| 20 | 2.9% | 56.09% | 43.91% | 1.78 |
| 25 | 2.9% | 48.54% | 51.46% | 2.06 |
| 30 | 2.9% | 42.00% | 58.00% | 2.38 |
(Source: DK Research Terminal, FactSet)
If QCOM buys back stock at 2.85%, as analysts expect, then over 30 years that could be a 58% reduction in share count.
- boosting EPS, FCF, and dividends per share by 138%
- not counting QCOM’s impressive future growth forecasts
QCOM Long-Term Growth Outlook
- 20-year growth rate: 15.13% CAGR
- consensus growth range (5 sources): 14.7% to 17.5 CAGR
- individual analyst growth range: 0% to 23% CAGR
- median growth consensus from all analysts: 17.5% CAGR
How accurate are analysts at forecasting QCOM’s growth over time?
Smoothing for outliers analyst margins of error are 25% to the downside and 15% to the upside.
- 11% to 21% CAGR adjusted growth consensus range
- 70% statistical probability QCOM grows at 11% to 21% over time
Analysts expect QCOM’s growth to be similar to the last 4 years and the last 19 years and its several mega-trend growth catalysts make that a reasonable forecast.
Reason Four: A Wonderful Company At A Wonderful Price
Outside of the tech bubble, and overall bubbles and bear markets, billions of investors have consistently paid 16 to 17.5X earnings for QCOM.
- 91% statistical probability that this range is a good estimate of intrinsic value
| Metric | Historical Fair Value Multiples (9-Years) | 2020 | 2021 | 2022 | 2023 | 2024 |
12-Month Forward Fair Value |
| 18-Year Average Yield | 2.04% | $125.98 | $131.37 | $147.06 | $147.06 | $148.04 | |
| Earnings | 16.74 | $88.55 | $156.69 | $200.55 | $212.26 | $218.62 | |
| Average | $104.00 | $142.92 | $169.69 | $173.74 | $176.54 | $170.78 | |
| Current Price | $136.69 | ||||||
|
Discount To Fair Value |
-31.43% | 4.36% | 19.45% | 21.33% | 22.57% | 19.96% | |
|
Upside To Fair Value (NOT Including Dividends) |
-23.91% | 4.56% | 24.14% | 27.11% | 29.15% | 24.94% (27% including dividend) | |
| 2022 EPS | 2023 EPS | 2022 Weighted EPS | 2023 Weighted EPS | 12-Month Forward EPS | 12-Month Average Fair Value Forward PE |
Current Forward PE |
|
| $11.98 | $12.68 | $8.75 | $3.41 | $12.17 | 14.0 | 11.2 |
I conservatively estimate QCOM’s fair value at 14X earnings, and today it trades at 11.2X.
- 9.2X cash-adjusted PE (EV/EBITDA)
- pre-pandemic private equity deals averaged 12.3
- QCOM is a bargain even by private equity standards
|
Analyst Median 12-Month Price Target |
Morningstar Fair Value Estimate |
| $222.40 (17.5 PE) | $163.00 (13.4 PE) |
|
Discount To Price Target (Not A Fair Value Estimate) |
Discount To Fair Value |
| 38.54% | 16.14% |
|
Upside To Price Target (Not Including Dividend) |
Upside To Fair Value (Not Including Dividend) |
| 62.70% | 19.25% |
|
12-Month Median Total Return Price (Including Dividend) |
Fair Value + 12-Month Dividend |
| $225.40 | $166.00 |
|
Discount To Total Price Target (Not A Fair Value Estimate) |
Discount To Fair Value + 12-Month Dividend |
| 39.36% | 17.66% |
|
Upside To Price Target ( Including Dividend) |
Upside To Fair Value + Dividend |
| 64.90% | 21.44% |
Our fair value estimate is similar to Morningstar’s.
- across 500 companies the average DK fair value estimate is 1.76% lower than Morningstar’s
Analysts expect QCOM to deliver 65% total returns in the next year, which isn’t unreasonable given that it represents the upper end of its historical fair value PE range.
| Rating | Margin Of Safety For Low-Risk 13/13 Ultra SWAN Companies | 2022 Price | 2023 Price |
12-Month Forward Fair Value |
| Potentially Reasonable Buy | 0% | $169.69 | $173.74 | $170.78 |
| Potentially Good Buy | 5% | $161.20 | $165.06 | $162.24 |
| Potentially Strong Buy | 15% | $144.23 | $147.68 | $145.16 |
| Potentially Very Strong Buy | 25% | $120.90 | $130.31 | $128.08 |
| Potentially Ultra-Value Buy | 35% | $110.30 | $112.93 | $111.01 |
| Currently | $136.69 | 19.45% | 21.33% | 19.96% |
| Upside To Fair Value (Not Including Dividends) | 24.14% | 27.11% | 24.94% |
For anyone comfortable with the risk profile QCOM is a potentially strong buy.
Risk Profile: Why Qualcomm Isn’t Right For Everyone
There are no risk-free companies and no company is right for everyone. You have to be comfortable with the fundamental risk profile.
What Could Cause QCOM’s Investment Thesis To Break
- safety falls to 40% or less
- balance sheet collapses (possibly from a large failed acquisition)
- business model completely disrupted (QTL business collapses, highly unlikely, this risk was effectively neutralized by the courts a few years ago)
- growth outlook falls to less than 7.8% for seven years
- QCOM’s role in my portfolio is to deliver long-term 10+% returns with minimal fundamental risk
- like all non-defensive sectors (anything that’s not REITs, utilities, midstream, healthcare, telecom, consumer staples), I target 10+% long-term return potential for all recommendations
How long it takes for a company’s investment thesis to break depends on the quality of the company.
| Quality |
Years For The Thesis To Break Entirely |
| Below-Average | 1 |
| Average | 2 |
| Above-Average | 3 |
| Blue-Chip | 4 |
| SWAN | 5 |
| Super SWAN | 6 |
| Ultra SWAN | 7 |
| 100% Quality Companies (LOW and MA) | 8 |
These are my personal rule of thumb for when to sell a stock if the investment thesis has broken.
QCOM is highly unlikely to suffer such catastrophic declines in fundamentals.
QCOM’s Risk Profile Includes
- industry/economic cyclicality
- industry disruption risk (primarily from Apple and Samsung who are making their own chips)
- Customer concentration risk (Apple and Samsung)
- political/regulatory risk (M&A and antitrust litigation)
- litigation risk (multi-year court battles with Apple, Huawei, and many others)
- M&A execution risk
- talent retention risk
- supply chain disruption risk (causing havoc globally right now)
- currency risk (significant since 95% of sales are international)
How do we quantify, monitor, and track such a complex risk profile? By doing what big institutions do.
Material Financial ESG Risk Analysis: How Large Institutions Measure Total Risk
- 4 Things You Need To Know To Profit From ESG Investing
- What Investors Need To Know About Company Long-Term Risk Management (Video)
Here is a special report that outlines the most important aspects of understanding long-term ESG financial risks for your investments.
- ESG is NOT “political or personal ethics based investing”
- it’s total long-term risk management analysis
ESG is just normal risk by another name.” Simon MacMahon, head of ESG and corporate governance research, Sustainalytics” – Morningstar
ESG factors are taken into consideration, alongside all other credit factors, when we consider they are relevant to and have or may have a material influence on creditworthiness.” – S&P
S&P, Fitch, Moody’s, DBRS (Canadian rating agency), AM Best (insurance rating agency), R&I Credit Rating (Japanese rating agency), and the Japan Credit Rating Agency have been using ESG models in their credit ratings for decades.
- credit and risk management ratings make up 42% of the DK safety and quality model
- dividend/balance sheet/risk ratings make up 82% of the DK safety and quality model
Dividend Aristocrats: 67th Industry Percentile On Risk Management (Above-Average, Medium Risk)
QCOM Long-Term Risk Management Consensus
| Rating Agency | Industry Percentile |
Rating Agency Classification |
| MSCI 37 Metric Model | 89.0% |
A, Above-Average, Positive Trend |
| Morningstar/Sustainalytics 20 Metric Model | 93.4% |
18.1/100 low-Risk |
| Reuters/Refinitiv 500+ Metric Model | 81.0% | Good |
| S&P 1,000+ Metric Model | 57.0% |
Above-Average, Positive Trend |
| Just Capital 19 Metric Model | 87.1% | Excellent |
| FactSet | 50.0% |
Average, Positive Trend |
| Morningstar Global Percentile (All 15,000 Rated Companies) | 75.9% | Good |
| Just Capital Global Percentile (All 954 Rated US Companies) | 93.4% | Excellent |
| Consensus | 78% |
Low-Risk, Good Risk-Management (bordering on very good), Positive Trend, |
(Sources: MSCI, Morningstar, S&P, FactSet, Just Capital)
QCOM’s Long-Term Risk Management Is The 100th Best In The Master List (80th Percentile)
For context here is how QCOM compares to the world’s best companies.
| Classification | Average Consensus LT Risk-Management Industry Percentile |
Risk-Management Rating |
| S&P Global (SPGI) #1 Risk Management In The Master List | 94 | Exceptional |
| Qualcomm | 78 | Good – Bordering On Very Good |
| Strong ESG Stocks | 78 |
Good – Bordering On Very Good |
| Foreign Dividend Stocks | 75 | Good |
| Ultra SWANs | 71 | Good |
| Low Volatility Stocks | 68 | Above-Average |
| Dividend Aristocrats | 67 | Above-Average |
| Dividend Kings | 63 | Above-Average |
| Safe Midstream | 62 | Above-Average |
| Master List average | 62 | Above-Average |
| Hyper-Growth stocks | 61 | Above-Average |
| Monthly Dividend Stocks | 60 | Above-Average |
| Dividend Champions | 57 | Average |
(Source: DK Research Terminal)
QCOM’s risk-management consensus is in the top 20% of the world’s highest quality companies and similar to that of such other companies as
- Canadian Imperial Bank of Commerce (CM)
- Bristol-Myers (BMY)
- Air Products and Chemicals (APD) – dividend aristocrat
- Dover (DOV) – dividend king
- Bank of Montreal (BMO)
- Visa (V)
The bottom line is that all companies have risks, and QCOM is good, bordering on very good at managing theirs.
How We Monitor QCOM’s Risk Profile
- 31 analysts
- 2 rating agencies
- 7 total risk rating agencies
- 38 experts who collectively know this business better than anyone other than management
“When the facts change, I change my mind. What do you do sir?” – John Maynard Keynes
There are no sacred cows at iREIT or Dividend Kings. Wherever the fundamentals lead we always follow. That’s the essence of disciplined financial science, the math behind retiring rich and staying rich in retirement.
Bottom Line: One Of The World’s Best Growth Blue-Chips Is On Sale
I’m not a market timer, I have no crystal ball and my goal isn’t to help you make monster gains in the short-term.
- though QCOM’s fundamentals justify a potential 24% total return within a year
- and analysts expect over 60% gains.
My goal is to teach you to be a better long-term investor and focus on Buffett-style “fat pitches” like Qualcomm in this market correction.
QCOM could potentially triple over the next five years, but those kinds of mouth-watering returns are just the beginning.
According to management, QCOM’s addressable market is set to increase 7X over the next decade alone as it diversifies into chips for every corner of future tech.
That’s a $700 billion annual global sales opportunity and that’s just for the next decade.
Analysts believe QCOM could deliver Buffett-like returns, not just in the next year, or five years, but potentially for many years or decades to come.
While its 2.2% yield might not be impressive today (it’s almost 3X that of the Nasdaq and it’s growing much faster), QCOM has proven itself a stellar dividend grower over nearly two decades.
Add in one of the world’s best management teams, a fortress balance sheet, and exceptional long-term risk-management and you have a potent combination that’s hard to beat.
Oh and did I mention that all this can be yours for the low low price of just 11X forward earnings!
QCOM isn’t just a Buffett-style “wonderful company at a fair price”, it’s one of the world’s best companies at a wonderful price.
In fact, by even private equity standards QCOM today is a bargain, and potentially just what your diversified and prudently risk-managed portfolio is looking for to help you retire rich, and stay rich in retirement.
Be the first to comment