

Sundry Photography/iStock Editorial via Getty Images
Price Action Thesis
We present a detailed price action analysis as a follow-up to our last article on Qualcomm (NASDAQ:QCOM) stock, as there have been significant developments in its price action over the past month.
QCOM has fallen about 12% from our previous article (at writing) and is testing its near-term support, as we posited. However, given its December double top bull trap, we accord a greater significance to it. Furthermore, QCOM has remained in a decisive bearish bias.
Notably, the market rejected its buying momentum at its near-term resistance, creating a bull trap at the end of May. As a result, the market forced a rapid liquidation over the first three weeks of June, re-testing its near-term support.
Our reverse cash flow model suggests that Qualcomm stock could underperform at the current levels, given the bull trap in late May. Notably, we believe that the market has been asking for higher free cash flow (FCF) yields to compensate for potential underperformance moving forward.
As a result, we believe we cannot rule out the potential for a steeper decline to force a re-test of its intermediate support.
Accordingly, we reiterate our Hold rating and urge long-term investors to be patient given its increasing bearish bias and potential underperformance.
Forcing QCOM’s Near-Term Support Re-test
QCOM price chart (weekly) (TradingView)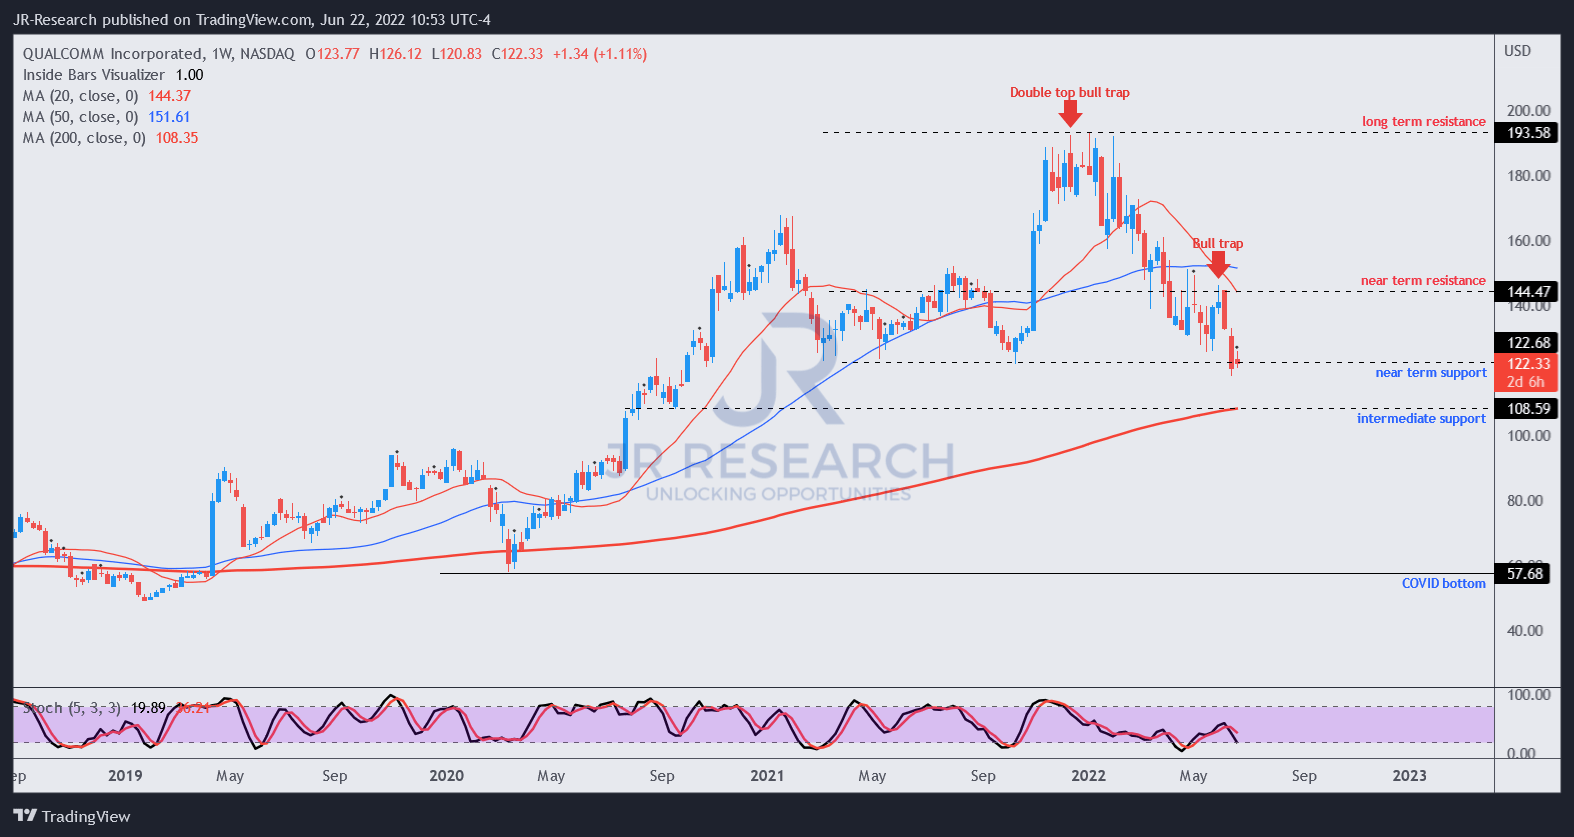
Investors are reminded again of the potency of double top bull traps, as they are early warning signs of a potentially significant reversal in bullish momentum.
Notably, QCOM stock formed another noteworthy bull trap at the end of May, bringing our near-term resistance ($145) lower than previously postulated. The market then sent QCOM stock into rapid liquidation over the first three weeks of June to re-test its near-term support ($122).
Notably, its near-term support has held firmly since May 2021. However, investors should note that the flow has reversed. QCOM stock was in positive flow (decisive bullish momentum) during its previous two re-tests in May and October 2021. However, the current re-test follows its negative flow (decisive bearish momentum) since April 2022. Coupled with the precedence of the double top and its recent May bull trap, we believe its near-term support is at significant risk.
Therefore, we postulate that a short-term rally could ensue to draw in dip buyers before forcing another rapid liquidation toward its intermediate resistance ($108). Consequently, we urge investors to exercise caution at the current levels.
The Market Is Pricing For Significant Underperformance
We highlighted in our previous article that management needs to update (read upgrade) its long-term guidance. However, that’s exactly what it failed to do in the recent June conferences it participated in when given the opportunity. CFO Akash Palkhiwala articulated (edited):
Fundamentally, not much has changed versus the goals we laid out at Investor Day. We’re certainly happy that we’ve grown faster on the handset side than we had forecasted. (Bank of America 2022 Global Technology Conference)
Qualcomm revenue change % consensus estimates (S&P Cap IQ)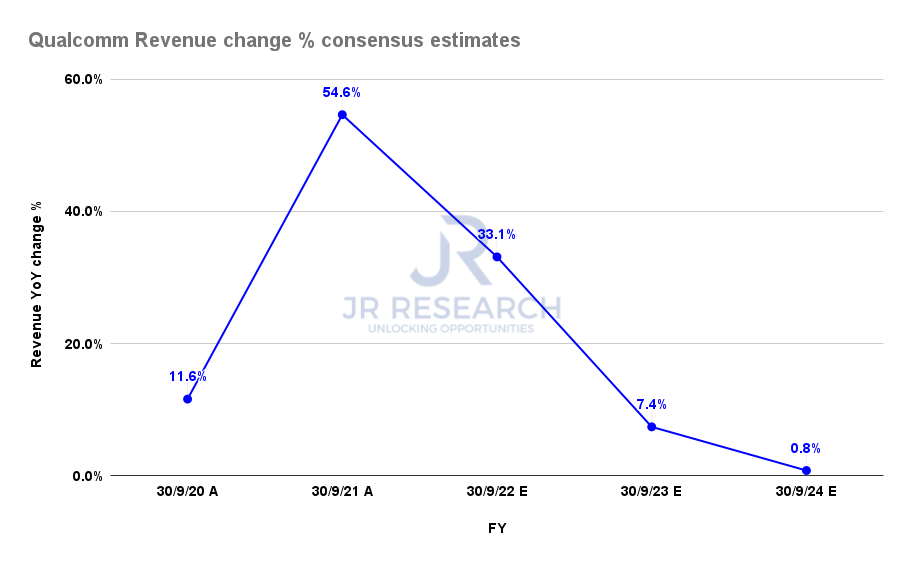
Management could have calmed the market’s nerves by upgrading its long-term model. Therefore, we believe the market remains unconvinced with Qualcomm’s forward revenue growth, as the consensus estimates (The street is generally bullish) modeled a significant moderation in topline growth through FY24.
| Stock | QCOM |
| Current market cap | $136.24B |
| Hurdle rate (CAGR) | 16% |
| Projection through | CQ2’26 |
| Required FCF yield in CQ2’26 | 6.05% |
| Assumed TTM FCF margin in CQ2’26 | 28% |
| Implied TTM revenue by CQ2’26 | $53.3B |
QCOM stock reverse cash flow valuation model A. Data source: S&P Cap IQ, author
By modeling QCOM’s valuation through a reverse cash flow model, we can visualize why the market expects the company to underperform through CQ2’26 significantly.
We used a hurdle rate of 16%, equivalent to QCOM’s 5Y CAGR. We also used the 5Y mean of its FCF yield. Assuming a blended TTM FCF margin of 28%, we require Qualcomm to post a TTM revenue of $53.3B by CQ2’26.
However, the consensus estimates suggest that Qualcomm could deliver revenue of $48.2B in FY24 (CQ3’24), up 0.8% YoY. As a result, we think Qualcomm is unlikely to meet our revenue target at its current cadence.
Therefore, we think it could partially explain why the market set up a double top bull trap at the 6% FCF yield mark in January. It also followed up with another bull trap at the 9% FCF yield level at the end of May. We believe the market insists on higher FCF yields because it seems convinced that QCOM stock could underperform significantly moving ahead.
| Stock | QCOM |
| Assumed entry level | $108 |
| Hurdle rate (CAGR) | 4.5% |
| Projection through | CQ2’26 |
| Required FCF yield in CQ2’26 | 9.75% |
| Assumed TTM FCF margin in CQ2’26 | 28% |
| Implied TTM revenue by CQ2’26 | $50.23B |
QCOM reverse cash flow valuation model B. Data source: S&P Cap IQ, author
Using its intermediate support level of $108 as our assumed entry price, we believe that the market expects QCOM to significantly underperform with an implied hurdle rate of 4.5%. Our assumption is based on the market’s rejection of its buying momentum at a 9% yield. We then used an average of its current yield of 10.5% to derive our required FCF yield of 9.75%.
Therefore, we believe the market will unlikely be ready to re-rate its stock unless management releases significantly upgraded guidance soon.
Is QCOM Stock A Buy, Sell, Or Hold?
We reiterate our Hold rating in QCOM stock. We note that it’s re-testing its near-term support. Therefore, we posit that a short-term rally could occur before fizzling out.
Consequently, we expect a re-test of its intermediate support level moving forward.
Our valuation analysis indicates that the market has de-rated QCOM stock. We believe the market expects it to significantly underperform, requiring markedly higher FCF yields to hold the stock, corroborated by the bull traps observed.
Be the first to comment