

olm26250/iStock via Getty Images
This ETF article series aims at evaluating products regarding the relative past performance of their strategies and quality metrics of their current portfolios. As holdings and weights change over time, I post updated reviews when necessary.
QUAL strategy and portfolio
The iShares MSCI USA Quality Factor ETF (BATS:QUAL) was launched on 7/16/2013 to track the MSCI USA Quality Index. It changed strategies on 9/1/2015 to track the MSCI USA Sector Neutral Quality Index, which weights stocks in the MSCI USA Index using a quality score based on three fundamental factors: return on equity (higher is better), earnings variability (lower is better) and leverage (lower is better). Then stock weights are normalized so that the weights of GICS sectors in the Underlying Index are the same as in the parent index (MSCI USA Index).
The top 10 companies by weight, listed below, represent 34.7% of asset value. None of them weighs more than 5%, so the risk related to individual stocks is limited. In the next table, the two share series of Alphabet Inc (GOOGL, GOOG), accounted as different holdings in the original list, have been grouped in a single line.
|
Ticker |
Name |
Weight (%) |
EPS growth %TTM |
P/E TTM |
P/E fwd |
Yield% |
|
Alphabet Inc |
4.69 |
91.20 |
25.25 |
24.18 |
0 |
|
|
Johnson & Johnson |
4.46 |
41.72 |
22.64 |
16.74 |
2.40 |
|
|
Apple Inc |
3.84 |
62.83 |
29.01 |
28.39 |
0.50 |
|
|
Nike Inc |
3.67 |
78.82 |
35.29 |
35.87 |
0.91 |
|
|
Meta Platforms Inc |
3.26 |
36.57 |
16.08 |
17.98 |
0 |
|
|
Costco Wholesale Corp |
3.15 |
26.84 |
44.81 |
42.58 |
0.57 |
|
|
Microsoft Corp |
3.09 |
39.98 |
32.31 |
32.43 |
0.82 |
|
|
NVIDIA Corporation |
3.04 |
122.95 |
72.03 |
48.78 |
0.06 |
|
|
Eli Lilly and Co |
2.86 |
-9.78 |
47.16 |
33.38 |
1.36 |
|
|
Mastercard Inc |
2.65 |
37.46 |
39.84 |
33.69 |
0.56 |
QUAL is invested almost exclusively in U.S. companies (99.6%) and mostly in large caps (79%).
The sector composition of QUAL is very close to the S&P500 (SPY), as a consequence of the underlying index rules. Technology is a bit heavier than in the benchmark (29.5% vs. 28.1%).
QUAL sectors (Chart: author with Fidelity data)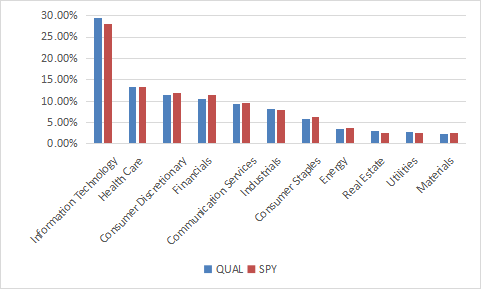
QUAL price/earnings and price/sales ratios are also very close to SPY. It is moderately more expensive regarding price/book and price/cash flow (table below).
|
QUAL |
SPY |
|
|
P/E TTM |
21.42 |
21.28 |
|
Price/Book |
5.96 |
4.08 |
|
Price/Sales |
2.91 |
2.85 |
|
Price/Cash Flow |
18.26 |
16.53 |
Data: Fidelity
Performance
Since inception in July 2013, QUAL and SPY have very similar return and risk metrics. The difference in annualized return is only 17 bps.
|
Total Return |
Annual Return |
Drawdown |
Sharpe ratio |
Volatility |
|
|
QUAL |
210.38% |
13.94% |
-34.06% |
0.94 |
13.99% |
|
SPY |
215.02% |
14.13% |
-33.72% |
0.96 |
13.82% |
|
SPHQ |
211.80% |
14.00% |
-31.60% |
1.02 |
12.92% |
The Invesco S&P 500 Quality ETF (SPHQ), a competitor in quality-oriented equity funds, also has a similar return, but it looks a bit better regarding risk metrics (maximum drawdown and volatility, measured as standard deviation of monthly returns).
The next chart plots the equity value of $100 invested in QUAL and SPY since QUAL inception. Beyond numbers, it shows almost identical behaviors.
QUAL vs SPY (Chart: author)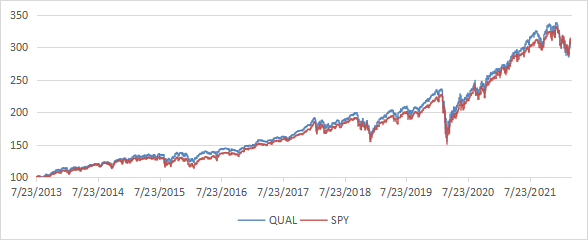
Scanning QUAL with quality metrics
QUAL holds 124 stocks, of which only 2 are risky regarding my metrics. In my ETF reviews, risky stocks are companies with at least 2 red flags among: bad Piotroski score, negative ROA, unsustainable payout ratio, bad or dubious Altman Z-score, excluding financials and real estate where these metrics are less relevant. Here, risky stocks weigh about 3% of asset value, which is a very good point.
According to my calculation of the weighted quality metrics reported in the next table, QUAL is significantly superior to the benchmark in Altman-score and return on assets. ROA is especially good. Piotroski F-scores are similar.
|
Altman Z-score |
Piotroski F-score |
ROA% TTM |
|
|
QUAL |
7.07 |
6.4 |
16.35 |
|
SPY |
3.56 |
6.5 |
7.88 |
Takeaway
QUAL is a quality-oriented ETF invested in large and mid-size US companies. It follows a quantitative strategy based on three factors: ROE, earnings stability and leverage. Its sector composition and its valuation are close to the S&P 500. An evaluation based on comprehensive metrics confirms QUAL has a high-quality portfolio. It is much better than the benchmark regarding Altman Z-score and return on assets. Its exposure to risky stocks is only 3% of asset value. QUAL is a good product for investors seeking passive exposure to high quality equities. It may also be used as a component of a tactical allocation strategy rotating in various investing styles (for example, value, growth, quality, momentum). It has not outperformed the benchmark since inception, but this 9-year period doesn’t include a full market cycle. Quality style is likely to outperform in a bear market. Its close competitor SPHQ is slightly better regarding risk metrics. QUAL has a 3-star rating at Morningstar on a maximum of 5. For transparency, I have a passive allocation in ETFs (QUAL is not a part of it) and a quality-oriented active portfolio of 14 stocks (“Stability” model).
Be the first to comment