

bopav
At this point, it is not as easy to defend value stocks as it was earlier this year when the central concern had been when the Fed would finally abandon its accommodative monetary policy.
The value cohort (defined broadly) has had a strong run since the beginning of the year, something that might be indicative of a peak approaching, as signs of abating inflation (again?) are fostering the tech comeback with a vengeance. But what if richly priced names will continue sliding next year? For this reason, investors have their rationale to search for simple equity portfolios with modest valuations and solid quality.
In many cases, this means just narrowing sector exposure by removing the overinflated tech; in theory, this is a simple trick to increase a portfolio’s earnings yield while, perhaps, reducing its growth characteristics somewhat, but in many cases without compromising on quality.
So what if the tech industry is removed completely from, for example, the Invesco QQQ ETF (QQQ)? An experiment worth conducting.
This is what exactly the First Trust NASDAQ-100 Ex-Technology Sector Index Fund (NASDAQ:QQXT) does. Did it succeed in this effort? Is it worth investing in the ETF at this juncture? Let us discuss this.
What QQXT managed to do: a slightly cheaper portfolio and marginally weaker growth but the quality is on par
QQXT tracks the equally-weighted Nasdaq-100 Ex-Tech Sector Index, which is essentially identical to the Nasdaq-100, only with constituents from the Technology industry (defined according to the Industry Classification Benchmark) removed.
An (almost) tech-less QQXT should be valued better than QQQ as most tech names sport premium multiples (solid margins, growth premia, or great expectations to blame), an issue amplified by market-cap weighting. And the fact is, it does offer a comparatively better valuation profile.
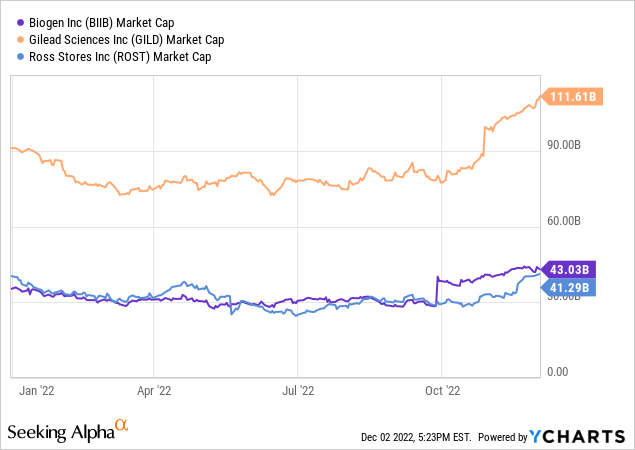
Let us address the size factor first. QQXT’s three key investments are Biogen (BIIB), Gilead Sciences (GILD), and Ross Stores (ROST). Together, they have about 6.3% of the net assets. In the trio, only GILD is a mega-cap.
What is QQQ’s top trio? Apple (AAPL), Microsoft (MSFT), and Amazon.com (AMZN). Their share of the net assets is ~28.7%.
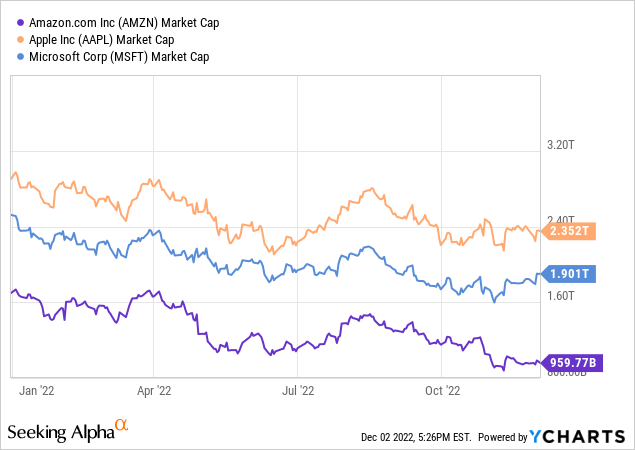
So with the weighted-average market capitalization of the portfolio of 60 holdings at about $89.3 billion vs. QQQ’s over $708 billion, QQXT does have a marginally lower weighted-average EV/Sales of 5.5x vs. QQQ’s about 5.9x, as per my estimates. It is unsurprising that its WA forward revenue growth rate is also lower, around 13.5% vs QQQ’s 14.2%.
Next, as my analysis revealed, the share of stocks with a B- Seeking Alpha Quant Valuation grade or better is 7.1% in QQXT and only 4.9% in QQQ. Those that are comparatively overpriced (D+ and lower) account for almost 80% of QQQ and 78% of QQXT. Not a spectacular difference, yet still indicative of the fact that the latter is priced slightly better.
But did exposure to the quality factor suffer? It did, though only marginally. To corroborate, QQQ has 98.9% of the net assets allocated to stocks with a B- Profitability rating and better, a figure only a bit higher than QQXT’s 95.6%.
Comparing QQXT and IGM: hidden tech exposure comes to light
Is QQXT truly an ex-tech fund? There are nuances.
By ‘hidden exposure,’ I surely do not mean Pinduoduo (PDD), a tech company in the ICB system and a consumer discretionary player according to the Global Industry Classification Standard, which for some reason percolated into QQXT’s equity mix and has a 1.9% weight at the moment, though this is somewhat strange.
What I mean is the fact that 1) the GICS Information Technology companies can still be found, and 2) QQXT’s simple strategy did not hinder ‘expanded tech’ players (e.g., technically consumer discretionary, etc.) to qualify for its portfolio.
To illustrate that, I created the following chart.
Created by the author using data from QQXT, QQQ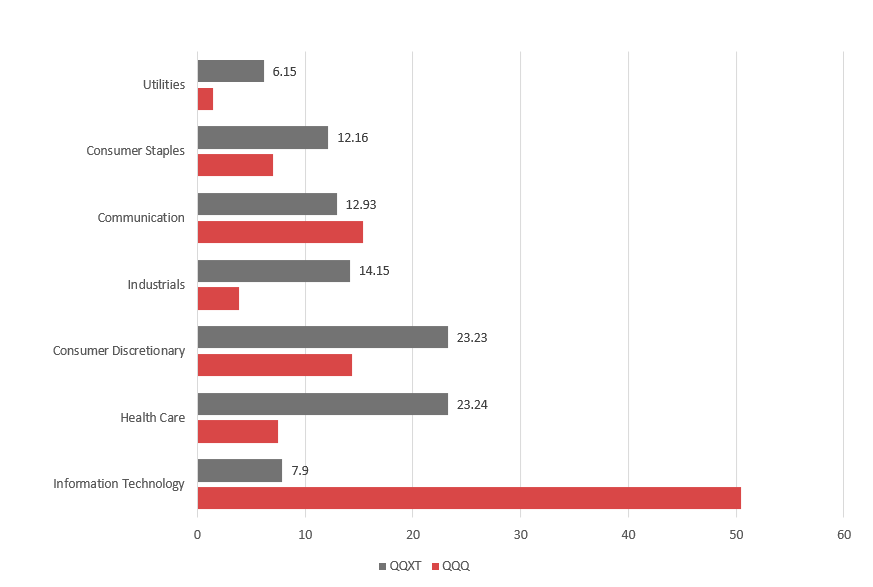
As it can be seen, similarly to QQQ, QQXT has no exposure to financials, real estate, energy, and materials (not to be confused with the ICB basic materials industry). It is meaningfully overweight consumer discretionary and healthcare. And it still has an allocation to IT, about 7.9%.
The list of the GICS IT companies that could be found in its equity basket is presented below.
| Stock | Weight in QQXT |
| Fiserv (FISV) | 1.5% |
| PayPal (PYPL) | 1.3% |
| Cisco (CSCO) | 1.8% |
| Paychex (PAYX) | 1.6% |
| Automatic Data Processing (ADP) | 1.7% |
Now, let us compare portfolios of the iShares Expanded Tech Sector ETF (IGM), the S&P North American Expanded Technology Sector Index-tracking fund I discussed in my January article.
Upon deeper inspection, the overlap between QQXT and IGM is about 15.8%. The following table includes stocks that can be found in both. That is to say, investors who are considering QQXT as a completely ex-tech alternative to QQQ should think twice as inside, there are ingredients they likely do not want.
| Stock | Weight in QQXT |
| Netflix (NFLX) | 1.8% |
| Cisco | 1.8% |
| Automatic Data Processing | 1.7% |
| Electronic Arts (EA) | 1.7% |
| eBay (EBAY) | 1.6% |
| Paychex | 1.6% |
| Activision Blizzard (ATVI) | 1.5% |
| Fiserv | 1.5% |
| PayPal | 1.3% |
| Amazon (AMZN) | 1.2% |
Performance: years of sluggish returns, then phenomenal 2022
What returns QQXT was capable of delivering in the past?
In the 2010s, tech investing was strongly associated with alpha, which is supported by the table below (months and years when it delivered a higher return than the Nasdaq 100 ETF highlighted in green). And the fact that QQXT does have exposure to the IT sector did little to prop up its returns. It was underperforming QQQ consistently (with 2012 and 2013 being an exception).
Created by the author using data from Portfolio Visualizer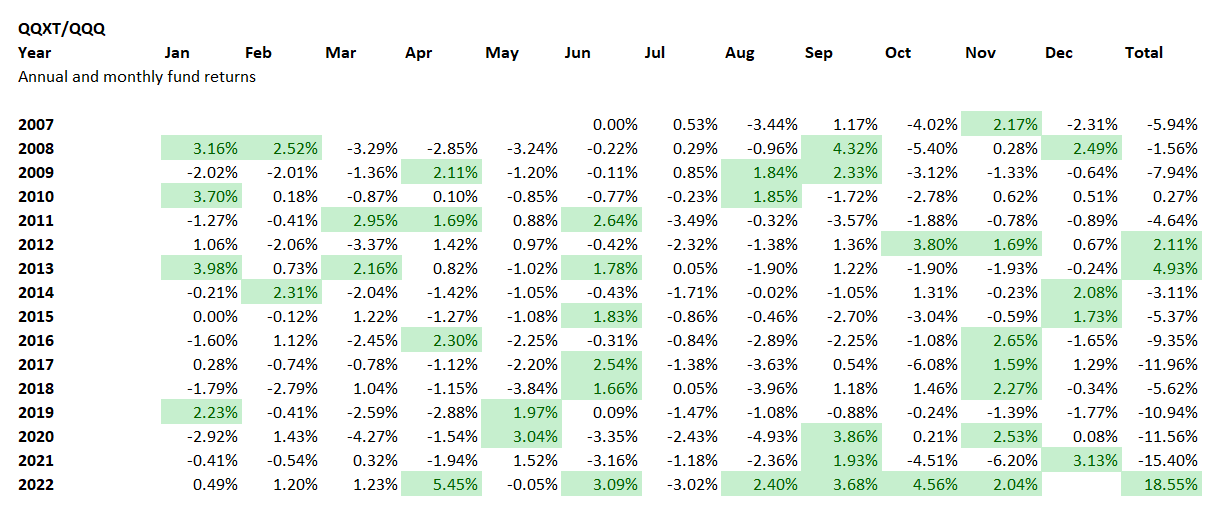
Interestingly, it underperformed QQQ not only during the short-lived coronavirus recession of 2020 when tech names took off bolstered by the pandemic tailwinds but also during the Global Financial Crisis.
However, in 2022, it has outperformed QQQ during six months (including four months in a row, August – November), finishing with a negative return of 7.4% vs. QQQ’s 25.9%.
As a consequence, its compound annual growth rate delivered during the June 2007 – November 2022 period is materially below QQQ’s, yet more than 1% above IVV’s, while the risk-adjusted returns (the Sharpe and Sortino ratios) are also slightly better.
| Portfolio | IVV | QQQ | QQXT |
| Initial Balance | $10,000 | $10,000 | $10,000 |
| Final Balance | $36,270 | $70,581 | $42,141 |
| CAGR | 8.67% | 13.44% | 9.72% |
| Stdev | 16.06% | 18.99% | 17.96% |
| Best Year | 32.30% | 54.68% | 46.74% |
| Worst Year | -37.02% | -41.73% | -43.29% |
| Max. Drawdown | -50.78% | -49.74% | -53.14% |
| Sharpe Ratio | 0.55 | 0.72 | 0.57 |
| Sortino Ratio | 0.8 | 1.11 | 0.86 |
| Market Correlation | 1 | 0.92 | 0.94 |
Conclusion
QQXT is a comparatively better valued, similarly high-quality smart-beta (almost) tech-less alternative to QQQ.
This ETF has an appealing idea at its crux. An ex-tech concentrated bellwether portfolio, with excessive valuation risks associated with tech removed, is a blend that could appeal to a value investor in a higher interest rates era with a recession risk in the mix. Yet the fund is not without downsides.
First, its valuation is better than QQQ’s only marginally, partly at the expense of growth. Second, a QQQ-like no-tech portfolio could be distilled, yet it requires more profound research. As a consequence, the issue with this ETF is that it provides exposure investors probably do not want.
Summing up, I see little reason to invest in it, especially considering the expense ratio of 60 bps and an uncoincidental D+ Expense grade; for a simplistic passive strategy looks a bit too high, at least for my taste.
Be the first to comment