

Massimo Giachetti/iStock Editorial via Getty Images
(This article was co-produced with Hoya Capital Real Estate)
Introduction
Investors looking for growth stocks have put $190b into the premier NASDAQ 100 ETF, the Invesco QQQ ETF (QQQ). The Nasdaq 100 is the 100 largest, most actively traded U.S companies listed on the Nasdaq stock exchange. The index excludes companies from the financial industry. Being that the NASDAQ is home to many of the premier Technology companies, that sector dominates the stocks that comprise the top 100.
While some investors want growth stocks, they might also need income and desire to generate it without having to sell shares to achieve that need. Naturally, fund management firms have tried to meet those dual goals with a pair of covered-call options strategy funds based on these big, growth stocks: the Nuveen Nasdaq 100 Dynamic Overwrite Fund (NASDAQ:QQQX) and the Global X NASDAQ 100 Covered Call ETF (NASDAQ:QYLD).
As expected, as with the case of all covered call funds I am aware of, these funds have, over time, provided lower CAGR than matching funds that don’t write options against their holdings. That’s the trade-off: more income for less return (and hopefully less volatility). Along with analyzing QQQX and QYLD, I relate how both did against QQQ, and the results show a split decision. How much CAGR loss versus yield improvement causes that. CAGR investors would prefer QQQX, higher yield (plus lower volatility) investors would prefer QYLD.
Exploring the Nuveen Nasdaq 100 Dynamic Overwrite Fund
Seeking Alpha describes this CEF as:
Nuveen Nasdaq 100 Dynamic Overwrite Fund is a closed-end fund designed to offer regular distributions through a strategy that seeks attractive total return with less volatility than the Nasdaq 100 Index by investing in an equity portfolio that seeks to substantially replicate the price movements of the Nasdaq 100 Index, as well as selling call options on 35%-75% of the notional value of the Fund’s equity portfolio. QQQX uses the NASDAQ 100 TR USD Index as its benchmark and launched in 2007.
Source: seekingalpha.com QQQX
QQQX has amassed $1.15b in assets and currently yields 7.2%, with the managers charging 90bps in fees; reasonable for an option writing CEF. Unlike many CEFs, QQQX employs no leverage. Currently, QQQX is at a 1.44% premium; whereas for most of the first quarter, it sold for a discount.
Nuveen lists three potential benefits for investors with their CEF:
- Broad market opportunity: Equity portfolio provides the opportunity to participate in Nasdaq 100 Index returns
- Reduced volatility: Sells (“writes”) call options on a portion of the equity portfolio, reducing the Fund’s return volatility and downside risk (but also reducing some of its capital appreciation potential)
- Tax-advantaged distributions: Offers the potential for regular distributions from qualified dividend income, long-term capital gains and return of capital
QQQX Holdings review
nuveen.com QQQX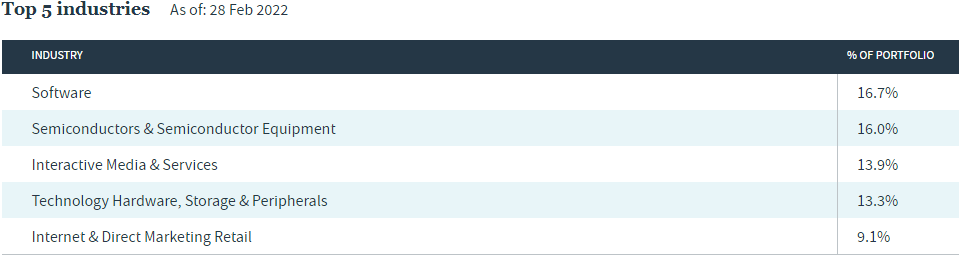
All five are Tech-related industries. This is more clearly seen when viewing all sectors.
seekingalpha.com QQQX nuveen.com QQQX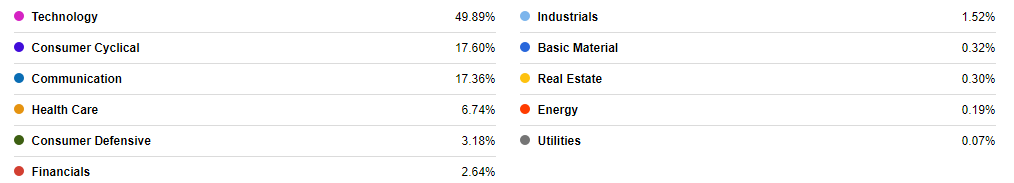
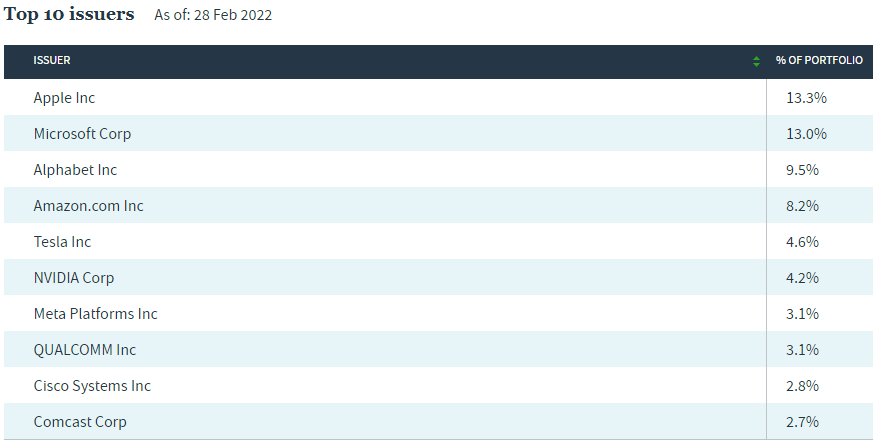
Even for stocks not classified as Technology, every one of the Top 10 have some dependency on technology as part of their business model.
The asset class allocation breakdown was a bit surprising.
| Asset Class | Holdings |
| Common Stocks | 130 |
| Depository Receipts | 3 |
| Exchange-Trade-Funds | 2 |
| REITs | 2 |
| Options on Stocks | 1 |
| Options on Indices | 3 |
| Options on ETFs | 1 |
| Cash | 2 |
With 130 stocks, QQQX invests beyond the NASADAQ 100 Index stocks, as permitted by their Prospectus.
QQQX Option Strategy
When I saw QQQX held 140+ assets, I assume they were writing calls against 40% of their stock holdings. As the above table shows, that is not the case; total options positions is only 5! Nuveen provides these details on the strategy.
nuveen.com QQQX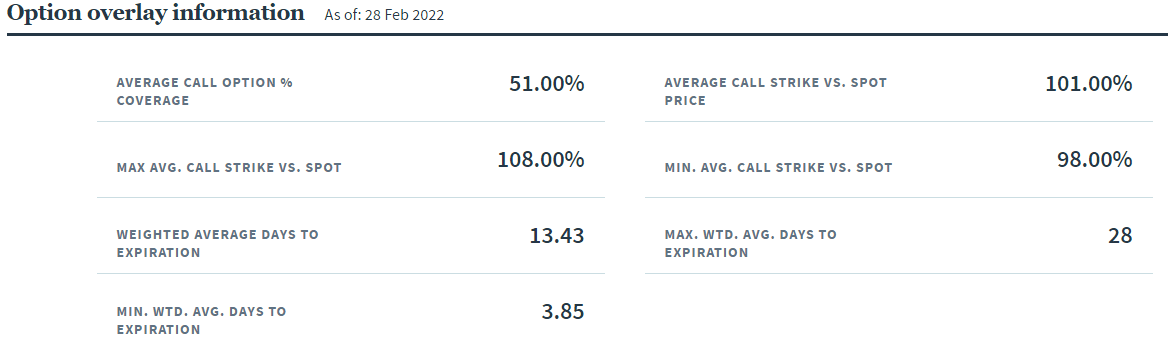
Definitions for each statistic can be read using this link. At the end of February, QQQX was near the target weight of 55% as coverage was 51%. Other guidelines related to their option strategy include:
- A recent change that requires all call options to be covered; eliminating the prior permission to write naked call options.
- The overwrite level will vary, based on market conditions;
- A primary emphasis on writing call options is to reduce downside risk and volatility of the Equity Portfolio. Data says this is not being met;
- A secondary emphasis seeks additional return opportunities by capitalizing on inefficiencies in the options market through a variety of means including the use of call spreads and selling Put options.
What I failed to find is any policy related to time or ITM/OTM targets when writing options. The above data refers to the holdings date, not execution values.
QQQX Distribution Review
seekingalpha.com QQQX DVDs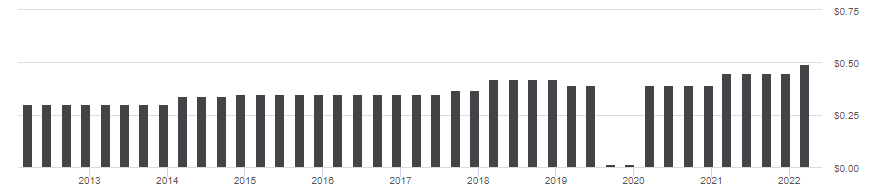
Dividends are paid quarterly, whereas QYLD does it monthly. (Author’s note: QQX site shows the Oct/Dec 2020 payouts were $.39, not the $.01 shown above.)
In theory, premiums should benefit as rates and market volatility climb. If recent option activity reflects their long-term strategy, volatility becomes less important as most indices and ETFs have lower levels than individual stocks. As with many funds that write options, that activity results in most of the payouts being from capital gains or ROC. This can be seen in QQQX’s 19-a statements or in the following data from Fidelity.
Fidelity.com QQQX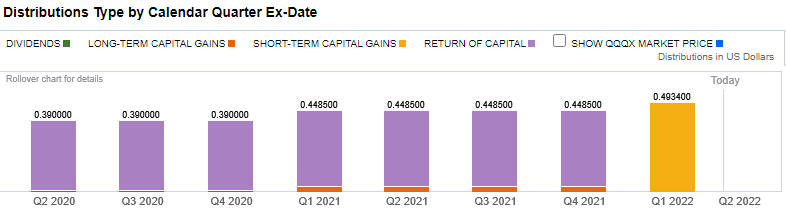
Exploring the Global X NASDAQ 100 Covered Call ETF
Seeking Alpha describes this ETF as:
Global X NASDAQ 100 Covered Call ETF is an exchange traded fund launched and managed by Global X Management Company LLC. The fund invests in public equity markets of global region. The fund invests directly and through derivatives in stocks of companies operating across diversified sectors. It uses derivatives such as options to create its portfolio. It invests in growth and value stocks of large-cap companies. It seeks to track the performance of the CBOE NASDAQ-100 BuyWrite V2 Index. QYLD started in 2013.
Source: seekingalpha.com QYLD
QYLD has $6.8b in assets and a forward yield of 12%. Here the managers charge 60bps in fees. Being an ETF, there is no leverage here either.
Global X lists also three potential benefits for investors with their ETF:
- High Income Potential: QYLD seeks to generate income through covered call writing, which historically produces higher yields in periods of volatility.
- Monthly Distributions: QYLD has made monthly distributions 8 years running.
- Efficient Options Execution: QYLD writes call options on the Nasdaq-100 Index, saving investors the time and potential expense of doing so individually
QYLD Holdings review
seekingalpha.com QYLD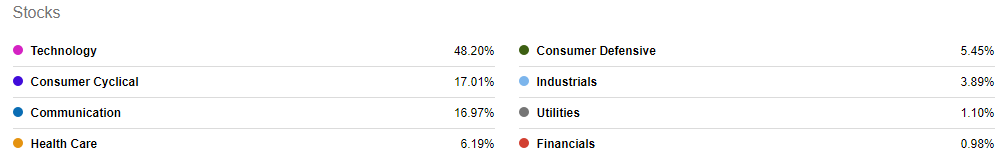
As expected, the Technology dominates QYLD’s sector allocation. Unlike QQQX, with QYLD holding only 104 assets, some being cash and options, they haven’t strayed too far from stocks in the NASDAQ 100 Index.
Top 20 holdings
globalxetfs.com; compiled by Author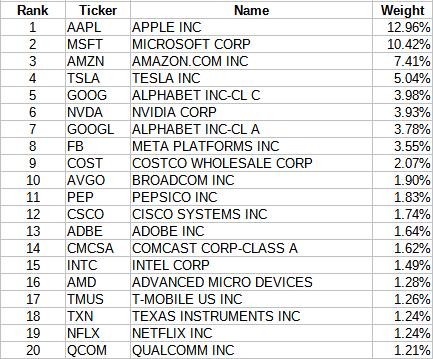
These stocks equal almost 70% of the portfolio. As of today, they are short the NDX Index, with the contract expiring by the time this article publishes. Currently, the contracts are slightly ITM.
QYLD Option Strategy
Since they benchmark against the CBOE NASDAQ-100 BuyWrite V2 Index, using the Index option rules should explain how QYLD executes its option strategy.
The Cboe NASDAQ-100 BuyWrite Index (BXN) is a benchmark index designed to track the performance of a hypothetical buy-write strategy on the NASDAQ-100. The BXN is a passive total return index based on (1) buying a NASDAQ-100 stock index portfolio, and (2) “writing” (or selling) the near-term NASDAQ-100 (NDX) Index “covered” call option, generally on the third Friday of each month. The NDX call written will have about one month remaining to expiration, with an exercise price just above the prevailing index level (i.e., slightly out of the money). The NDX call is held until expiration and cash settled, at which time a new one-month, near-the-money call is written.
Source: cboe.com Index BXN
Global X also states that QYLD sells ATM covered calls on 100% of its assets, meaning all of the upside is forfeited. The April contract expired on the 14th, at which time QYLD will write ones expiring on May 20th. Despite what the above description states, it appears the April strike price (14225) might have been ITM at the time it was written. Assuming little movement from the 4/8/22 close (14327), this is what QYLD is looking at:
Fidelity.com QYLD options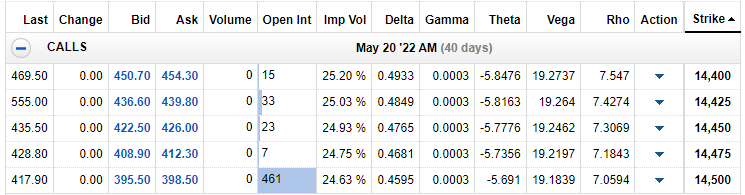
QYLD Distribution review
seekingalpha.com QYLD DVDs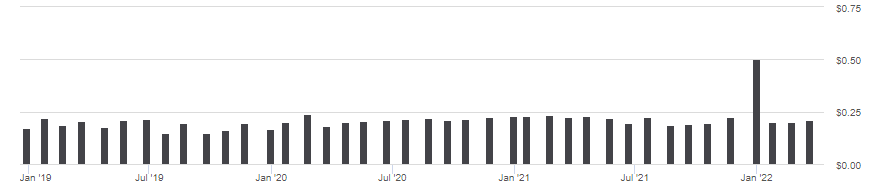
Unlike QQQX, QYLD pays investors monthly, a scheduled some investors prefer. While Fidelity showed the correct payout breakdown for QQQX, it does not for QYLD, which is why checking the 19-a tax statements is important. This is what they say for the 2022 payouts.
QYLD 19-a PDFs, various 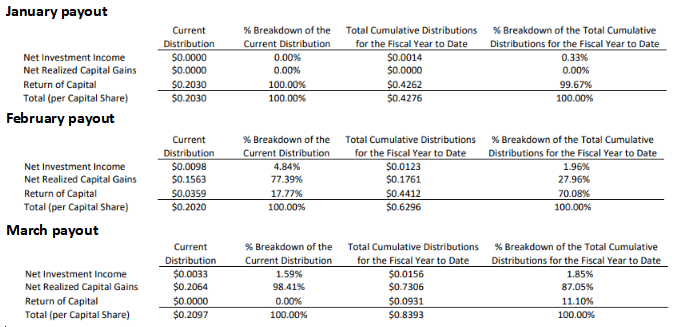
Notice the payout source has varied widely over these three months. The fact they write options on 100% of their portfolio helps explain QYLD’s higher yield and lower StdDev versus both QQQX and QQQ.
Comparing Portfolio Strategy
I will look at this two ways. First by comparing the two covered call funds against each other. Second by comparing them against the pure NASDAQ 100 ETF.
| Feature | QQQX | QYLD |
| Size (AUM) | $1.15b | $6.8b |
| Fees | 90bps | 60bps |
| Option Coverage | 35-75% | 100% |
| Yield | 7.2% | 12% |
| Holdings | 144 | 104 |
PortfolioVisualizer.com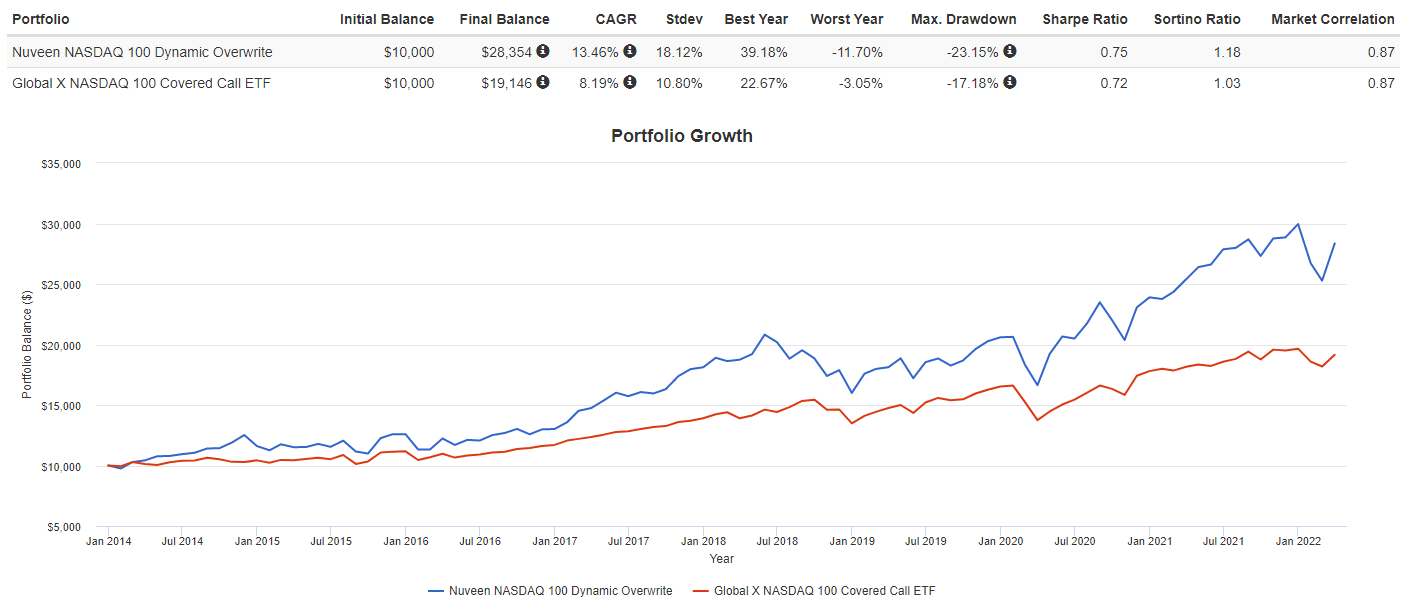
While QQQX, with its more “dynamic option strategy” has provided better returns since 2014, it has come with a higher StdDev and poorer Worst Year and Drawdown results. That said, the Sharpe ratio still slightly favors QQQX: 75 to 72. Since investors might be taking the payouts and not reinvesting as the main reason to own these versus the QQQ ETF would be income, the next chart shows how those investor might have fared.
dividendchannel.com/drip-returns-calculator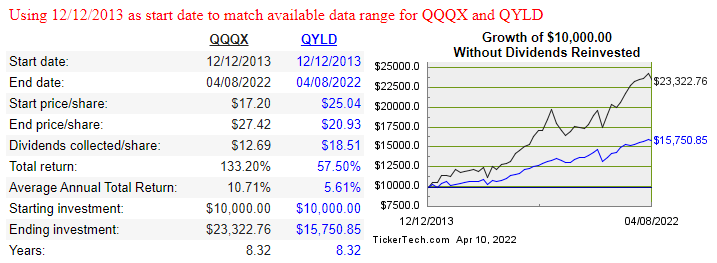
QQQX still did better, but the performance difference is slightly smaller.
When looking to owning an option strategy fund, I think it is important to compare their return and yield against what the basic fund has done, as an investor can always sell shares when they need the income.
PortfolioVisualizer.com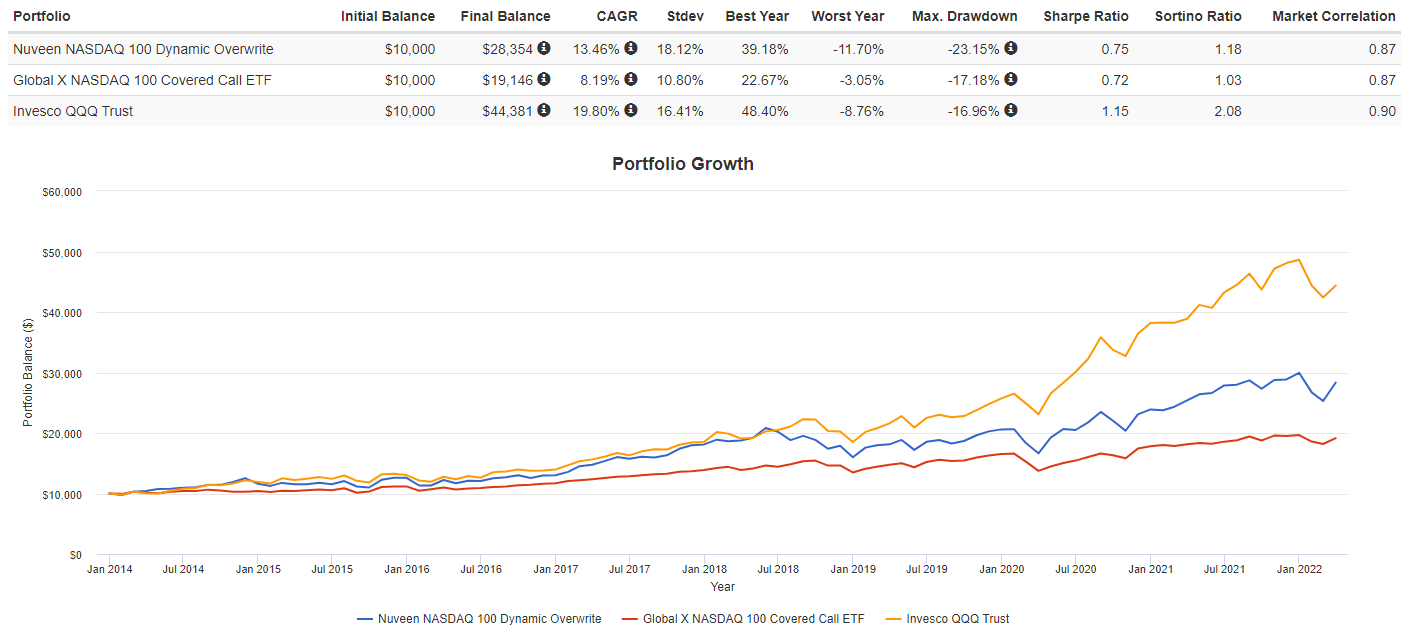
Here we see QQQ started outperforming the covered call funds in early 2019. One might have expected the option writing would have “protected” those funds versus QQQ during the COVID-19 crash, but that was not the case.
PortfolioVisualizer.com; compiled by Author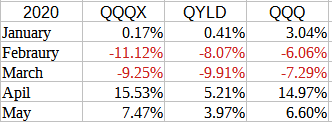
QQQ was the top performer each of the first three months. This also shows QQQX’s strategy works better when the market spikes upward as QYLD trailed badly during the April-May recovery with their 100%-ATM option writing policy.
As expected, both generated much higher income for investors than QQQ did.
PortfolioVisualizer.com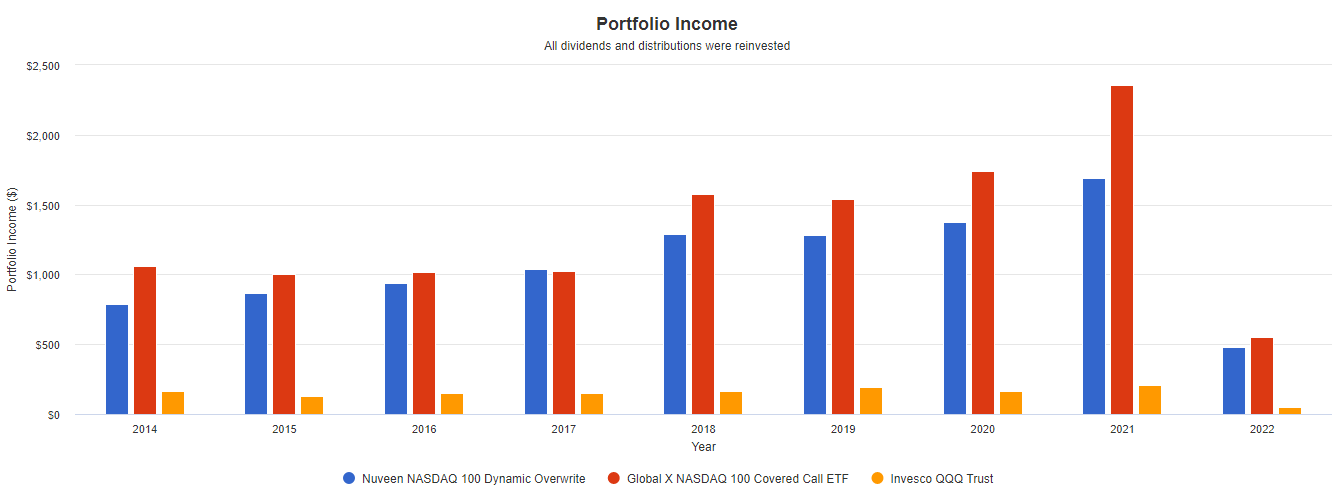
Final Thoughts
So where does this leave investors between the three funds? Here is my take, then each investor has to put this through their investment goals screen:
- QQQX for the best combination of CAGR and yield;
- QYLD for the best combination of lower risk and yield;
- QQQ for return;
Be the first to comment