


pungem/iStock via Getty Images
The economic data of the last couple of trading sessions has confirmed no recession here in the US. Has growth slowed? Sure, but slowing growth is not the same as a recession. Yes, we have had two quarters of negative GDP, but that’s primarily due to the higher prices and the adverse effects on the calculations.
Today’s ISM service data was solid and suggested the US economy is growing at a healthy 2.5% annualized rate. This growth seems very strong, especially given the high prices in the economy and the aggressive tightening of financial conditions.
The strong data is sending yields and the dollar sharply higher. The dollar index is now at its highest point since June 2002, while the 30-yr yield is on the cusp of surpassing its November 2018 and June 2022 highs of around 3.5%. On top of that real rates are also surging, with the 5-yr TIP and 10-yr TIP Rates trading at their cycle highs.
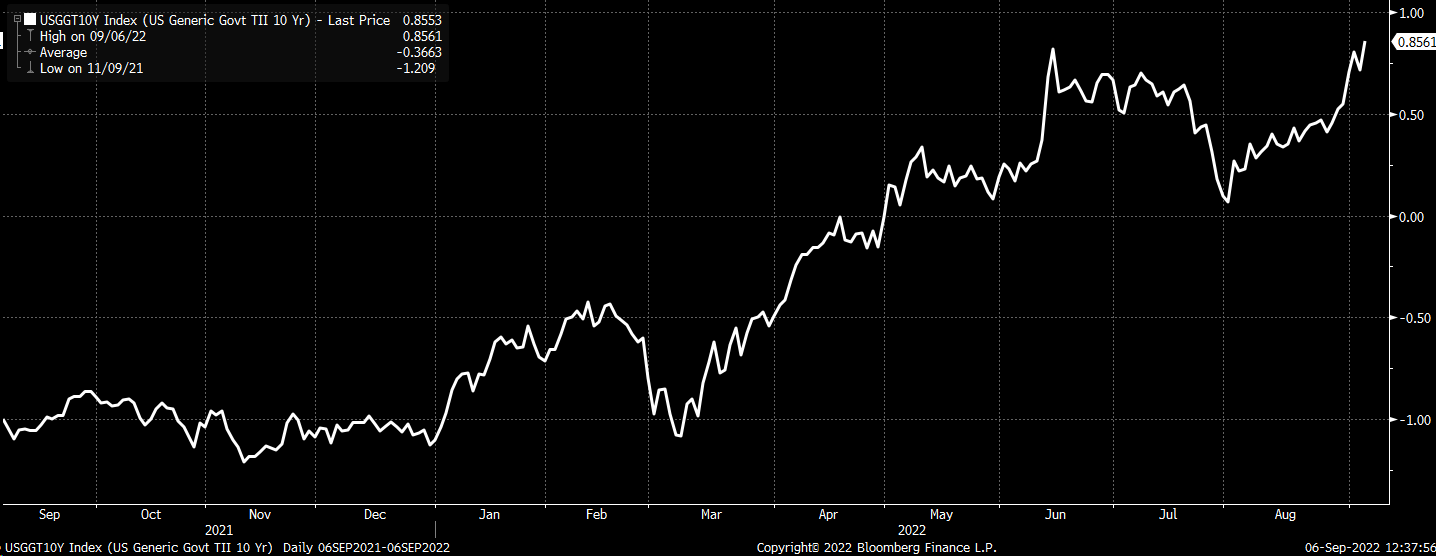
Bloomberg
With the dollar and rates trading at or near cycles, one would expect equities prices, particularly the Nasdaq 100 ETF (NASDAQ:QQQ), to be trading at new cycle lows. After all, that has been the pattern of 2022, as the TIP ETF has continued to pave the way for the Nasdaq 100 for more than five years.

Bloomberg
The QQQ has not revisited its lows of approximately $270 witnessed on June 16, remaining roughly 10% higher, which would suggest that the QQQ is overvalued versus the iShares TIPS BOND ETF (TIP) and could see further losses in the near term. The higher yields rise, the lower the TIP ETF sinks, and the greater the downside risk for the QQQ ETF.
Real Rates vs. Earnings Yield
One way to check against this is to look at the spread between the Nasdaq 100 earnings yield and the current 10-Yr TIP Rate. Currently, that spread is 3.6%, and despite the Nasdaq 100 trading more than 25% off its November 2021 intraday highs, the index is more expensive today versus the 10-yr real yield than at any other point since 2010.
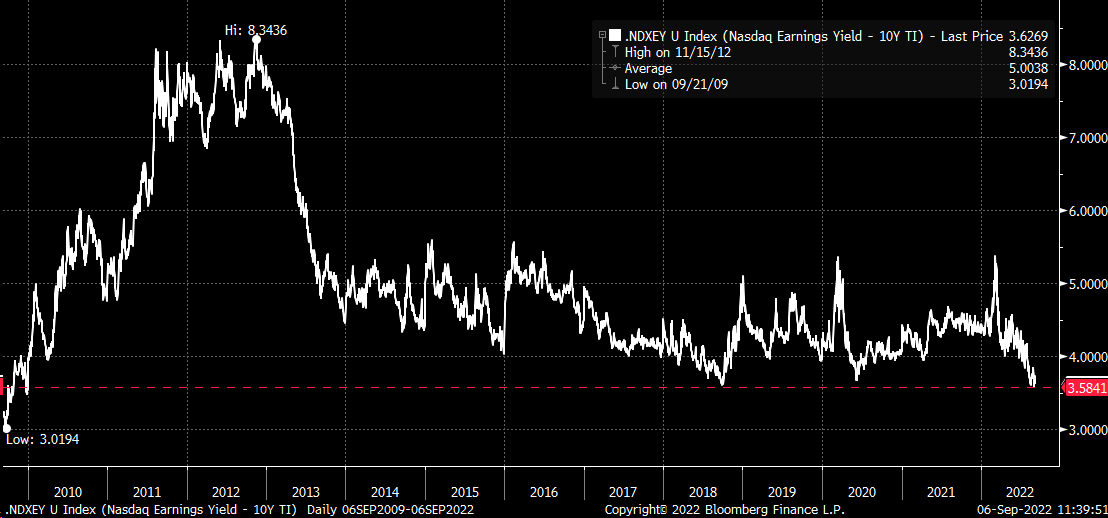
Bloomberg
It’s remarkable because the falling Nasdaq hasn’t kept pace with the rising 10-Yr real yield. If the Nasdaq had been keeping pace, the spread with the 10-yr real rate wouldn’t have sunk so low. This can only suggest two things: 1) real yields are too high, or 2) the Nasdaq has much further to fall. Given the path the Fed is taking, the general trend in rates, and the dollar, it seems hard to argue that TIP rates are too high.
A Return To The Norms
Over the past five years, the average spread between the NASDAQ earnings yield and the 10-yr TIP rate has been around 4.25% and within a one standard deviation range of 3.95% to 4.50%. Assuming the 10-Yr TIP trades sideways for the next couple of weeks and remains at 85 bps, the earnings yield of the Nasdaq 100 would need to rise to 4.80% from its current 4.45% or roughly 35 bps for the spread to return to 3.95%. For the spread to rise back to the average of 4.25%, the earnings yield would need to rise to 5.1%, or by nearly 65 bps.
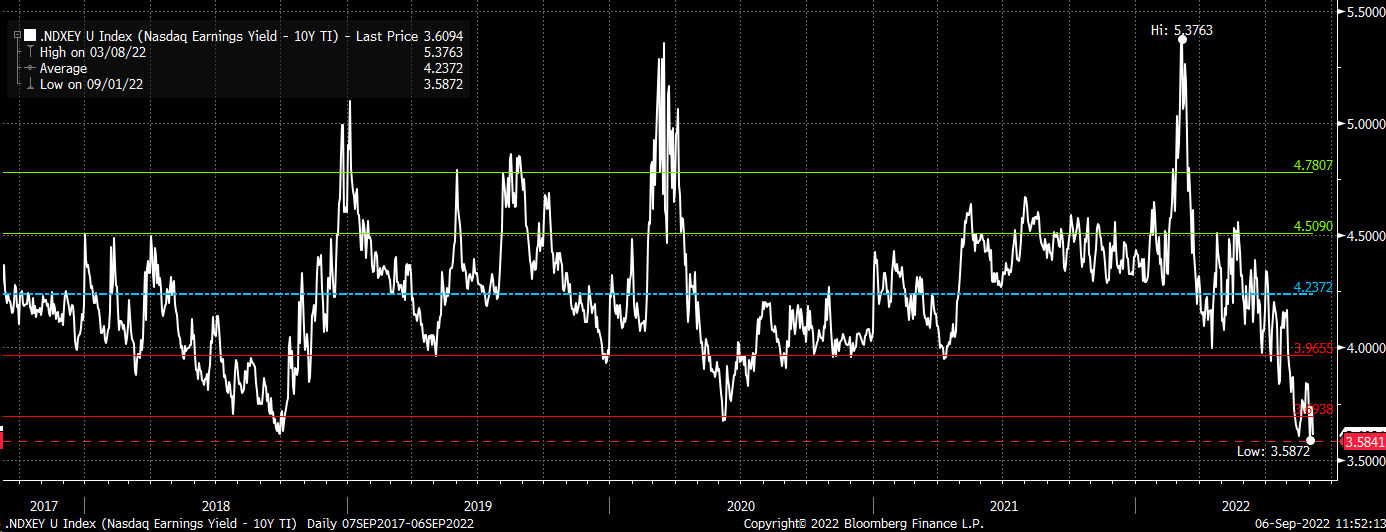
Bloomberg
It doesn’t sound like much, but an earnings yield of 4.80% is equivalent to a PE ratio of 20.8 versus the current PE ratio of 22.5. That would amount to a decline in the Nasdaq of about 7%. Meanwhile, a 5.1% earnings yield on the Nasdaq 100 equals a PE ratio of 19.6 or a decrease of about 13%. This would amount to the QQQ dropping in a range of 7% to 13% or between $255 to $273.
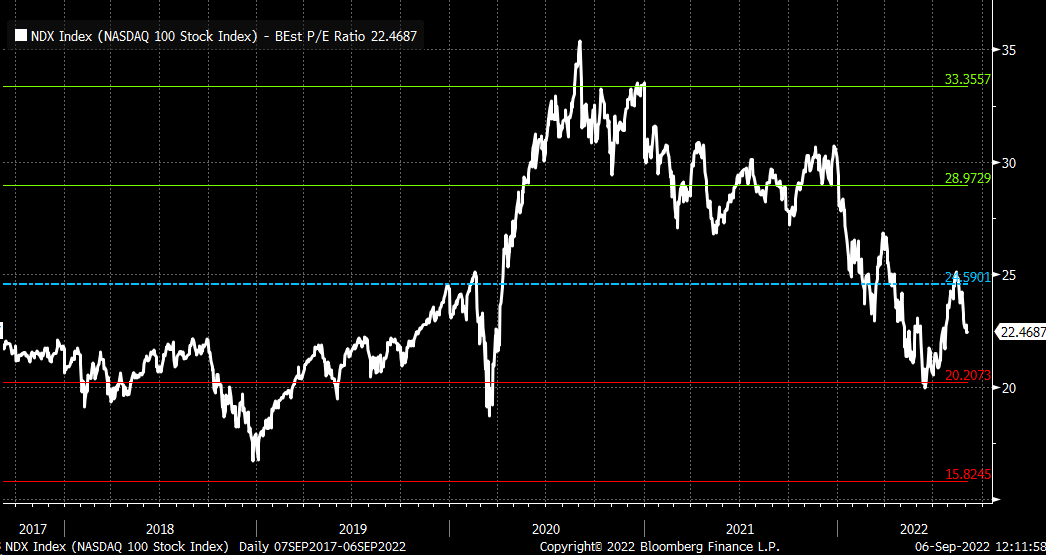
Bloomberg
It would confirm what the TIP ETF is suggesting, that the QQQ ETF should be making lows as the TIP makes new lows. Because at the end of the day, higher rates, a strong dollar, and tighter financial conditions will continue to be bad news for stocks as they have been for all of 2022.
Be the first to comment