

I Like That One/DigitalVision via Getty Images
Summary
Invesco QQQ ETF (NASDAQ:QQQ) tracks the tech heavy NASDAQ 100-Index (NDX), which has been negatively impacted in 2022 by the Fed rate hikes, inflation, strong US dollar and looming recession fears as well as reduced earnings on demand and margin pressure. My bottom-up analysis of the top 80% of the stocks in QQQ suggests further underperformance from still high relative valuations, further earnings downgrades and risk of stock and sector rotation away from tech mega caps.
QQQ, NDX and NASDAQ Performance (Created by author with data from Capital IQ)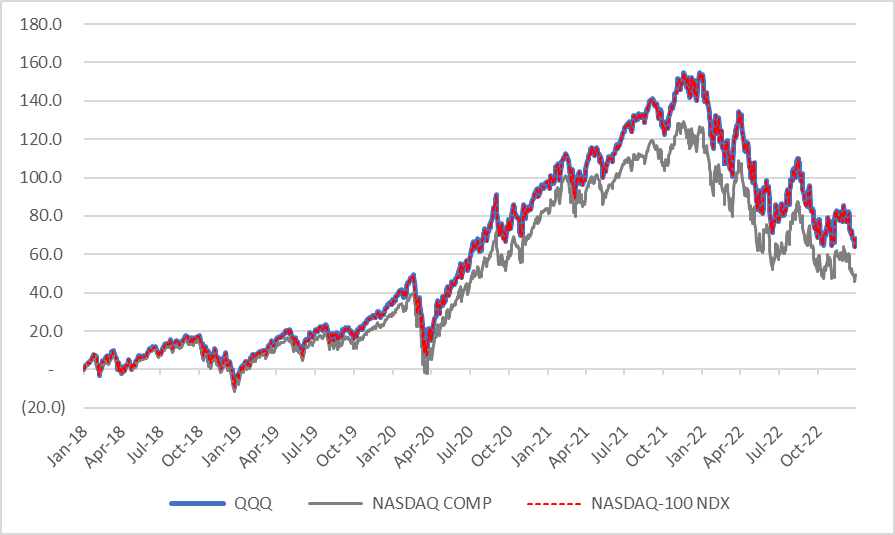
Bottom Up Analysis
At the end of June 2022, I conducted an earnings sensitivity on all the components of the NDX. Using consensus estimates, I attempted to factor in a 2023 soft landing scenario and reduced revenue and margins that drove net income lower. See full report for details. The Nasdaq 100 (NDX) Is Still Overvalued.
In this analysis I am comparing the 2023 consensus estimates reported in June 2022 vs what is currently reported. As can be seen in the table below, there have been some significant downgrades. On 80% of the QQQ component weights, 39 stocks, the market (sell side analyst) reduced net income expectations for 2023 by 12.8%. Heavy weights such as Amazon.com, Inc.(AMZN), Alphabet Inc (GOOG), NVIDIA Corporation (NVDA), and Meta Platforms (META) saw substantially larger downgrades while only three stocks had upgrades.
However, earnings growth in 2023 is still positive at 5.6% for the data set while 75% of the component stocks are forecast to have earnings growth despite recession fears. This may still be optimistic and the key 4Q22 reporting seasons may witness further guidance cuts that rapidly translate into consensus estimates.
Earnings and Valuation Analysis (Created by author with data from Invesco and Capital IQ)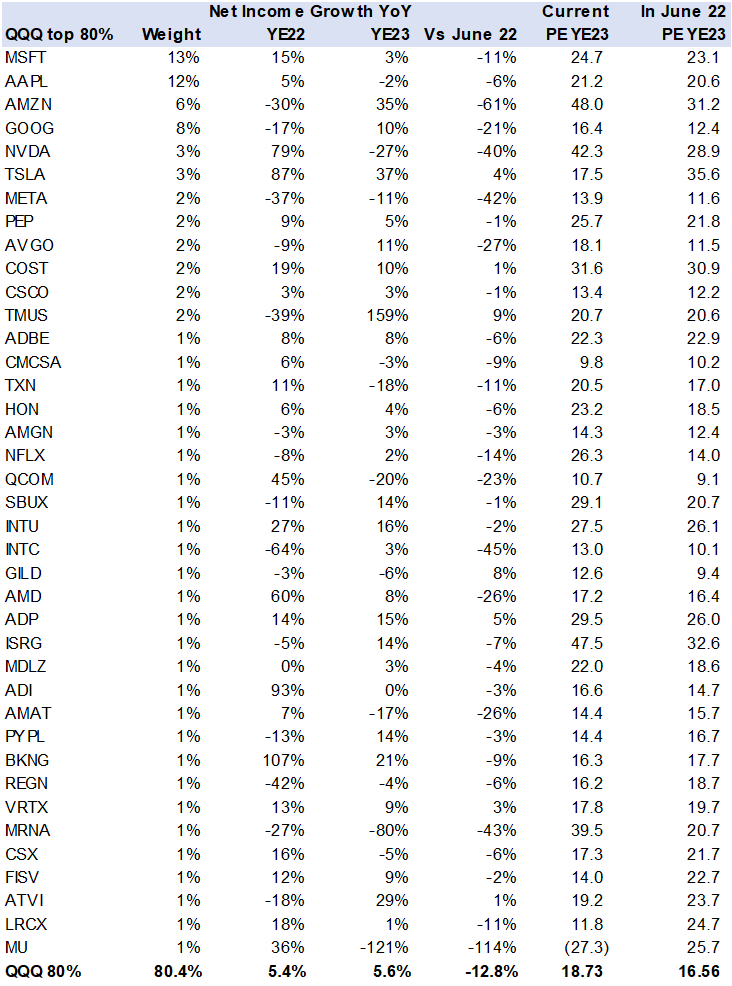
Valuations still high
Since June 2022, the PE valuation rose to 18.7x vs 16.5x on the 2023 estimates for this data set. This may mean that a further downward correction is required to better price in an earnings slowdown and higher rates.
Looking at the NDX forward PE in the last 20yrs we see an average of 22x. However, there is a wide variation from peak 45x to low 13x. A “fair” valuation is driven by a combination of factors with the two most relevant being earnings growth and market risk free rates i.e., Fed Funds/ US Treasury yields.
NDX Fwd PE (x) (Created by author with data from Capital IQ)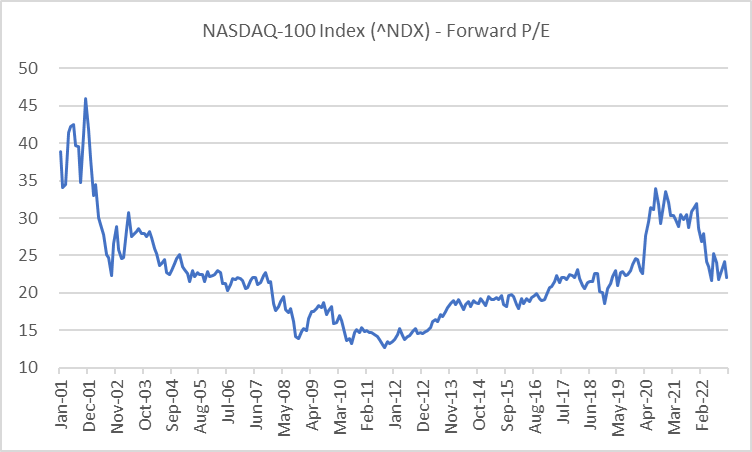
Both valuation drivers have headwinds
Earnings growth may have further downgrade risk especially for the two mega caps Apple Inc (AAPL) and Microsoft Corp (MSFT) that make up 24% of QQQ. While a 5% or 6% risk free rate in the form of shorter-term US Treasuries or even CDs may have a negative impact on capital flows to stocks, especially the more volatile the markets are. One may agree or disagree with allocating to bonds or fixed income, but it can dent flows to stocks which limits price increases. The demand supply equation is a relevant factor for all asset prices.
The risk to QQQ is market stock rotation
If the mega caps are not cheap and are not delivering earnings growth (nor dividend yield) then the market may gradually or abruptly rotate away from them to other stocks or sectors and eventually the weights in QQQ are adjusted away from big tech. This may lead to prolonged underperformance risk.
QQQ is a top 5 ETF
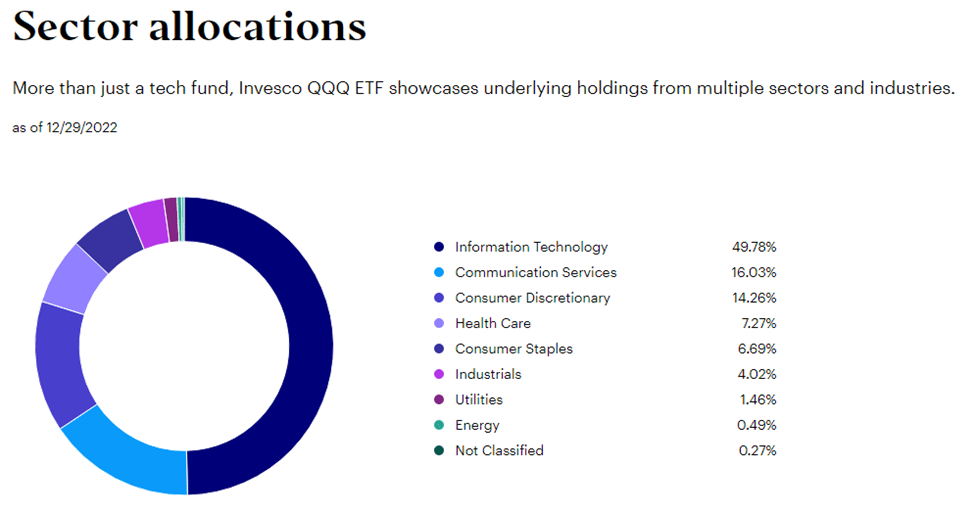
QQQ has US$149bn in assets and managed by Invesco. The fund closely tracks the Nasdaq 100 or NDX, which is heavy with technology stocks (50%) and is also concentrated with the top 15 stocks making up 60% of the ETF.
QQQ Stock Concentration (Created by author with data from Invesco) QQQ Sector Allocation (Image from Invesco)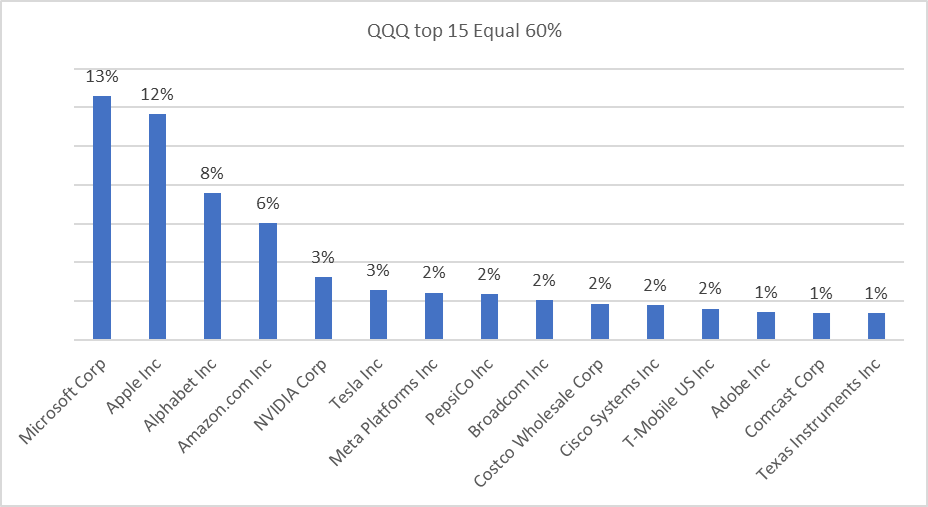
Conclusion
QQQ may have further price correction as its component stocks, influenced by the tech mega caps, face earnings growth and capital inflow headwinds. There is a risk of prolonged underperformance due to broader stock market rotation.
Be the first to comment