


The Consensus View Of Markets Right Now
RomoloTavani
DISCLAIMER: This note is intended for US recipients only and, in particular, is not directed at, nor intended to be relied upon by any UK recipients. Any information or analysis in this note is not an offer to sell or the solicitation of an offer to buy any securities. Nothing in this note is intended to be investment advice and nor should it be relied upon to make investment decisions. Cestrian Capital Research, Inc., its employees, agents or affiliates, including the author of this note, or related persons, may have a position in any stocks, security, or financial instrument referenced in this note. Any opinions, analyses, or probabilities expressed in this note are those of the author as of the note’s date of publication and are subject to change without notice. Companies referenced in this note or their employees or affiliates may be customers of Cestrian Capital Research, Inc. Cestrian Capital Research, Inc. values both its independence and transparency and does not believe that this presents a material potential conflict of interest or impacts the content of its research or publications.
Third Time’s A Charm?
First up, let’s look back at how our house market calls have been thus far.
The good: we called the Covid lows to within three days. Here’s the note in our Growth Investor Pro service from the time.
Market Bottom Call (Seeking Alpha, Cestrian Capital Research)
Also good: we called the 2021 market top to within a few days too. Again, here’s the note from our subscriber service.
Market Top Call (Seeking Alpha, Cestrian Capital Research)
Well done us.
What we have got less right is the reversal points of this market – ie when will it turn back up.
We have been sort-of-right/sort-of-wrong and the reason is that we’ve seen material differences in the support levels established by each of the indices.
Allow us to explain.
Each of the indices have followed our preferred wave/Fibonacci patterns so well since around 2015/16 that we are inclined to stick with those templates going forward too. And if we look at how each index has reacted in 2022-23, the relevant Fib levels have indeed acted as support points.
All three of the indices – the Dow, the Nasdaq and the S&P500 – put in a 78.6% larger-degree corrective move when the Covid crisis hit. A classic Wave 2 in fact.
Our expectation going into 2022 was that markets would correct by dropping maybe 40% of the move up from the Covid crisis lows to the all-time highs. Which is to say we thought the 38.2% Fibonacci retracement level would be respected. Maybe a little above, maybe a little below, but there and thereabouts. On purely technical logic we reasoned that since the Covid crisis drop – the Wave 2 – was so deep at a 78.6% correction of the prior move up, the 2022 drop – the Wave 4 – would likely not be so deep. Usually in this pattern recognition system, if a wave 2 correction is deep, the wave 4 correction is usually shallow, and vice versa.
This turned out to be both correct and incorrect. The Dow and the S&P? We were close enough to claim some glory. Each have flirted with the 0.5 before turning back up. But the Nasdaq? Currently enjoying a third date with the 61.8% retrace. Ouch.
Let’s just look at the history on each index before we turn to our Nasdaq outlook. We use the proxy ETFs for ease.
Here’s the QQQ (NASDAQ:QQQ) (full page version, here).
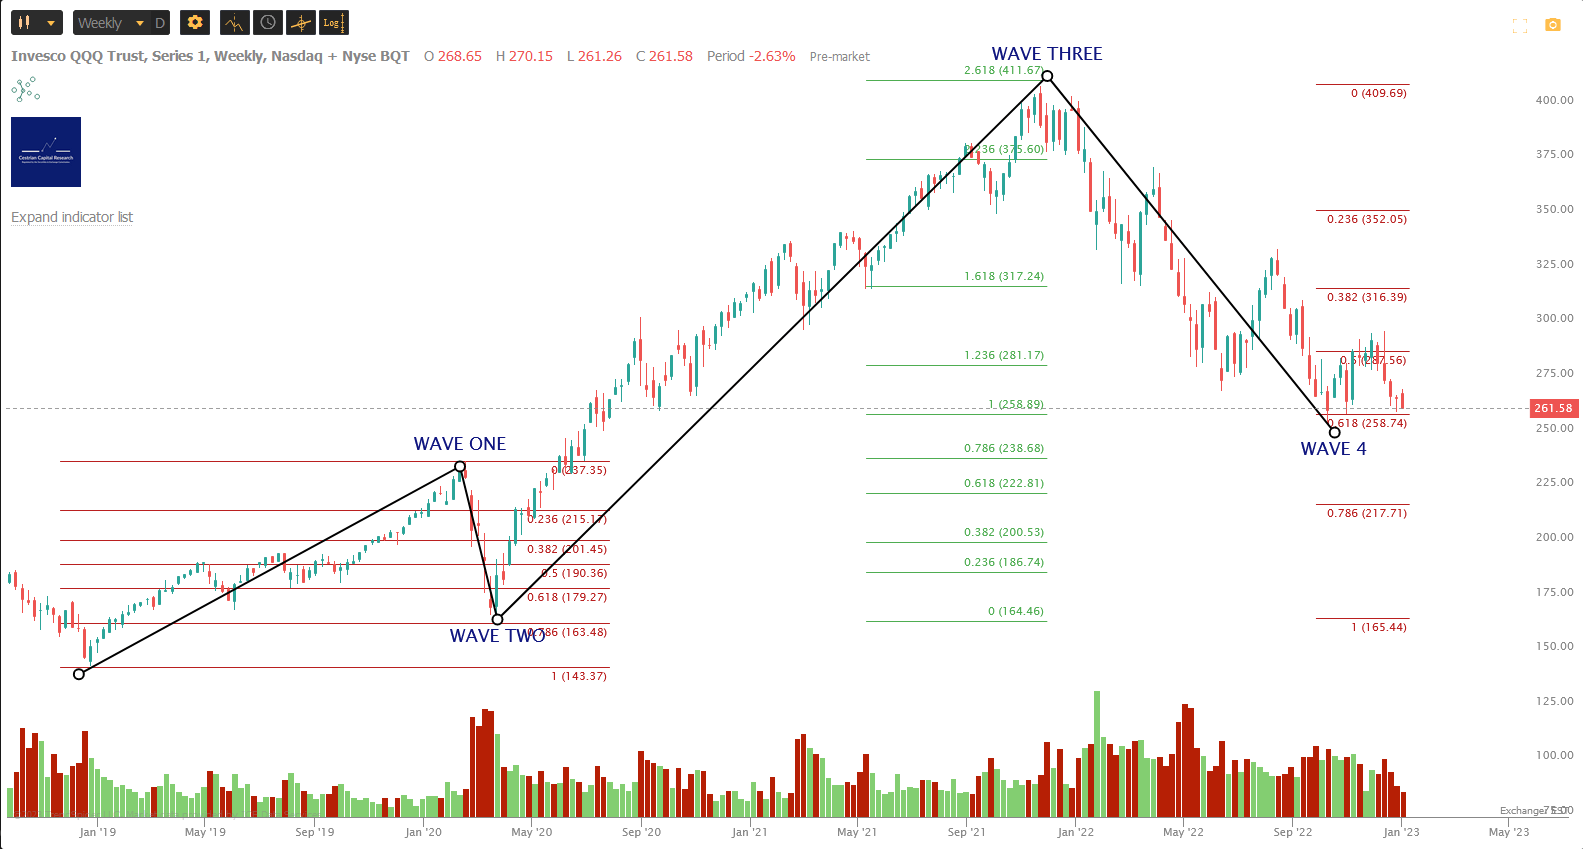
QQQ Chart (TrendSpider, Cestrian Analysis)
From the 2018 lows – the last time the Fed tried to normalize monetary policy but had to give up under pressure from markets and politicians – QQQ put in a Wave One up from $143/share to $237/share in little more than a year. Along comes the Covid crisis and we see a correction down to $167/share, a little above the 78.6% Fibonacci retracement level. Then a Wave Three up, peaking at the 2.618 Fib extension of Wave One ($409/share). This was a clear market high – a big extension that could not be defeated despite a couple of attempts to do so. And on the way down? Plunged directly through the 0.236 retracement level, no surprise; found support at the 0.382 and reversed sharply upwards in March 2022. Couldn’t hold that level and then dived for the 0.5 retrace, held that for a while until the June lows, reversed upwards and then formed the August countertrend rally highs made a beeline for the 0.618 retrace – that’s around $258/share for QQQ. And this level has held since October – it was tested twice that month and again in December and now again in January.
We’ll get to that forecast in a moment. Before then let’s just look at how the Dow and the S&P500 fared under the same macro conditions.
Here’s the Dow in DIA ETF format. (Full page version, here).
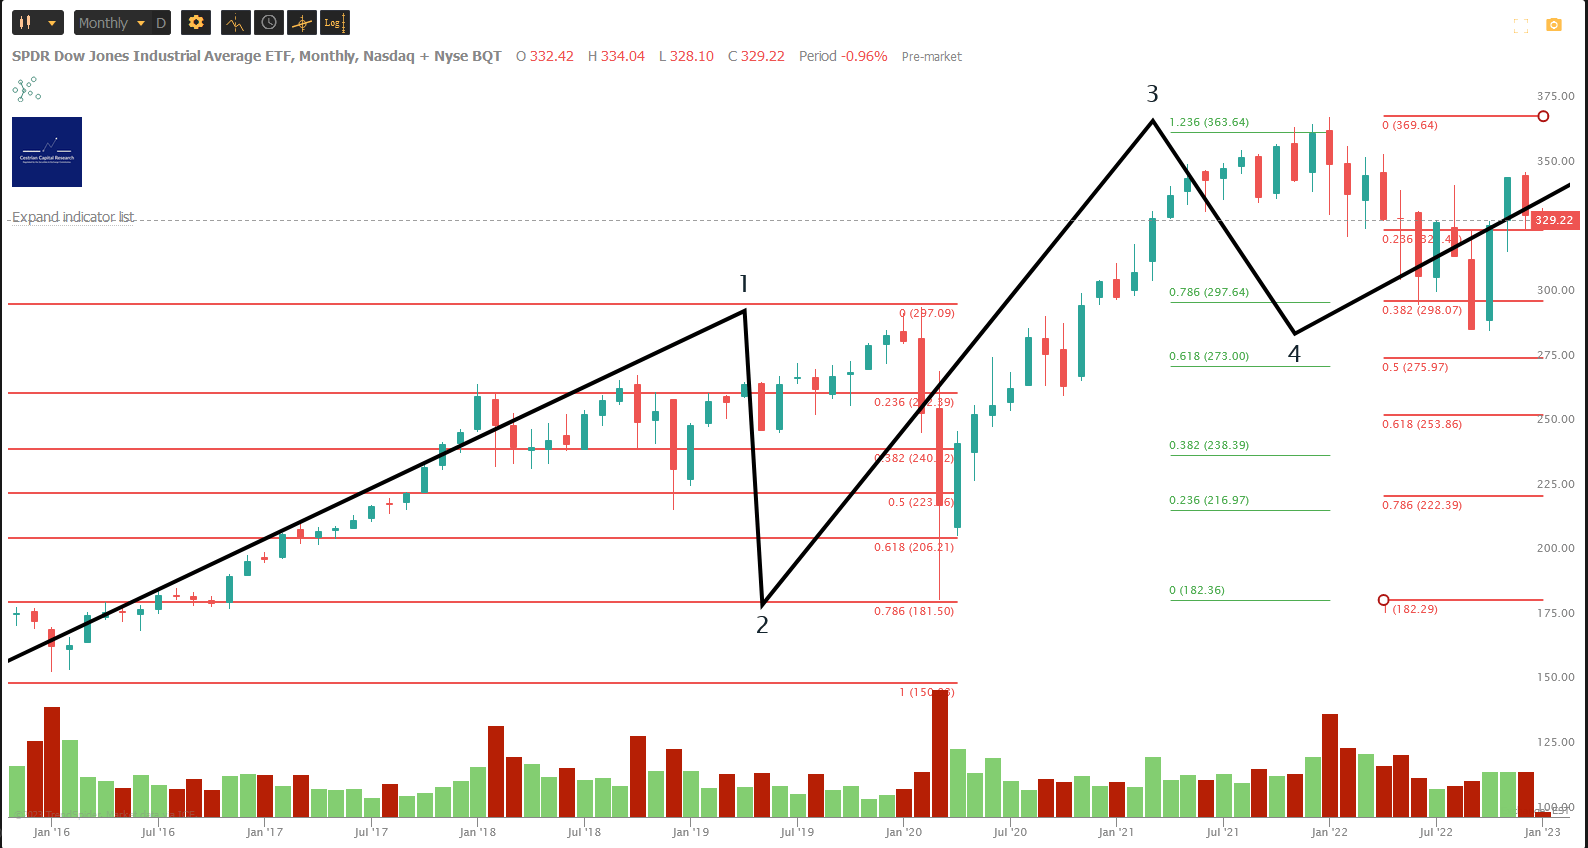
DIA Chart (TrendSpider, Cestrian Analysis)
The chart starts at the 2015 lows; a longer buildup than the Nasdaq to reach that pre-Covid high, then we have the same 78.6% corrective Wave 2, a muted 1.236 extension Wave 3 up, and a Wave 4 down which has halted and reversed about halfway between the 38.2% and the 50% retracement. Of note perhaps is that the Wave 4 low briefly dropped below the Wave 1 high. The Dow has put in a big up move since its 2022 lows and will, we believe, be the first of the indices to make a new all time high.
Now for the S&P500.
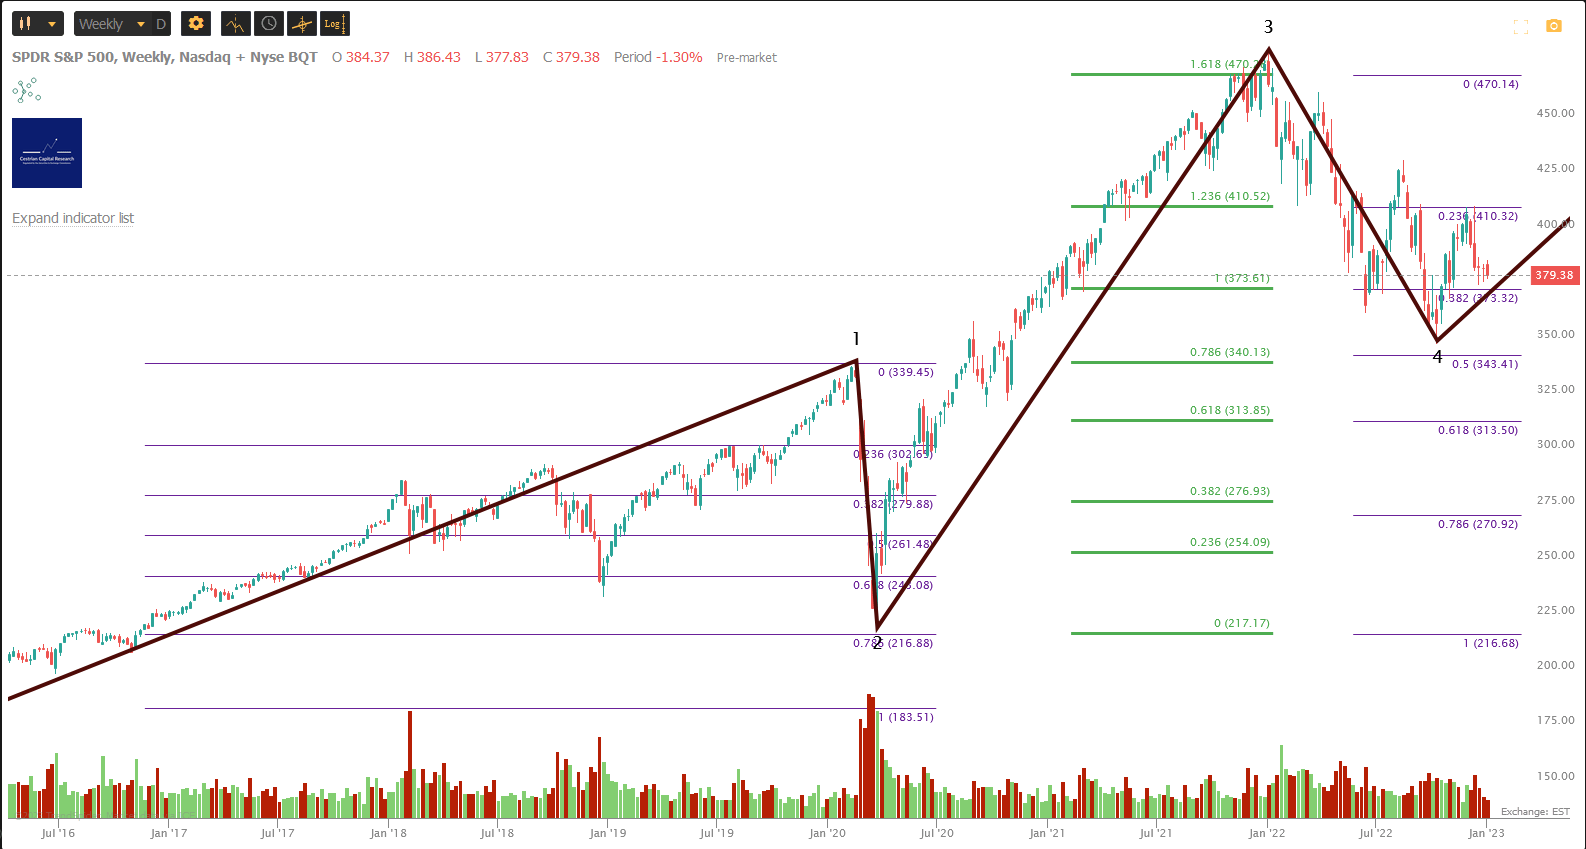
SPY Chart (TrendSpider, Cestrian Analysis)
Briefly – similar Wave 1 up and Wave 2 down moves to the Dow. Bigger Wave 3 up than the Dow but less than the Nasdaq – peaked at the 1.618 extension of the prior Wave 1 (compares to 1.236 for the Dow and 2.618 for the Nasdaq). And on the way down in 2022, plunged briefly towards the 0.5 retrace between September and October but that aside has respected the 0.382 retrace fairly well.
OK – so – from all this what can we learn about where the Nasdaq may be headed?
First, we’ll administer our own beating. In retrospect, the degree of Wave 3 extension in the Nasdaq should have told us that halting at the 38.2% wasn’t going to happen, wave theory of alternation notwithstanding. A further drop to the 50% level (around $288) would likely have held save for the relentless Fed narrative of beating inflation even when it appears to be in retreat already – this is likely the driver behind the move down to that $258 support level.
Today we had US hourly wage news that showed a month-on-month change of 0.3% vs. 0.4% last month. In other words a slowdown in the rate of wage growth. Given the Fed wants to see labor costs under control, this is a good story for markets because it means the Fed will have a hard time arguing why they need to hold the line on rate rises (still less to accelerate rate rises).
Next week we have CPI data which may also prove a little softer than has been the case this year. And if so that will further provide support for markets we think. So there are some catalysts coming up that can propel the Nasdaq one way or the other from the base camp it has set up at that 61.8% retrace.
This is our best guess for QQQ in 2023-24. Full page version, here.
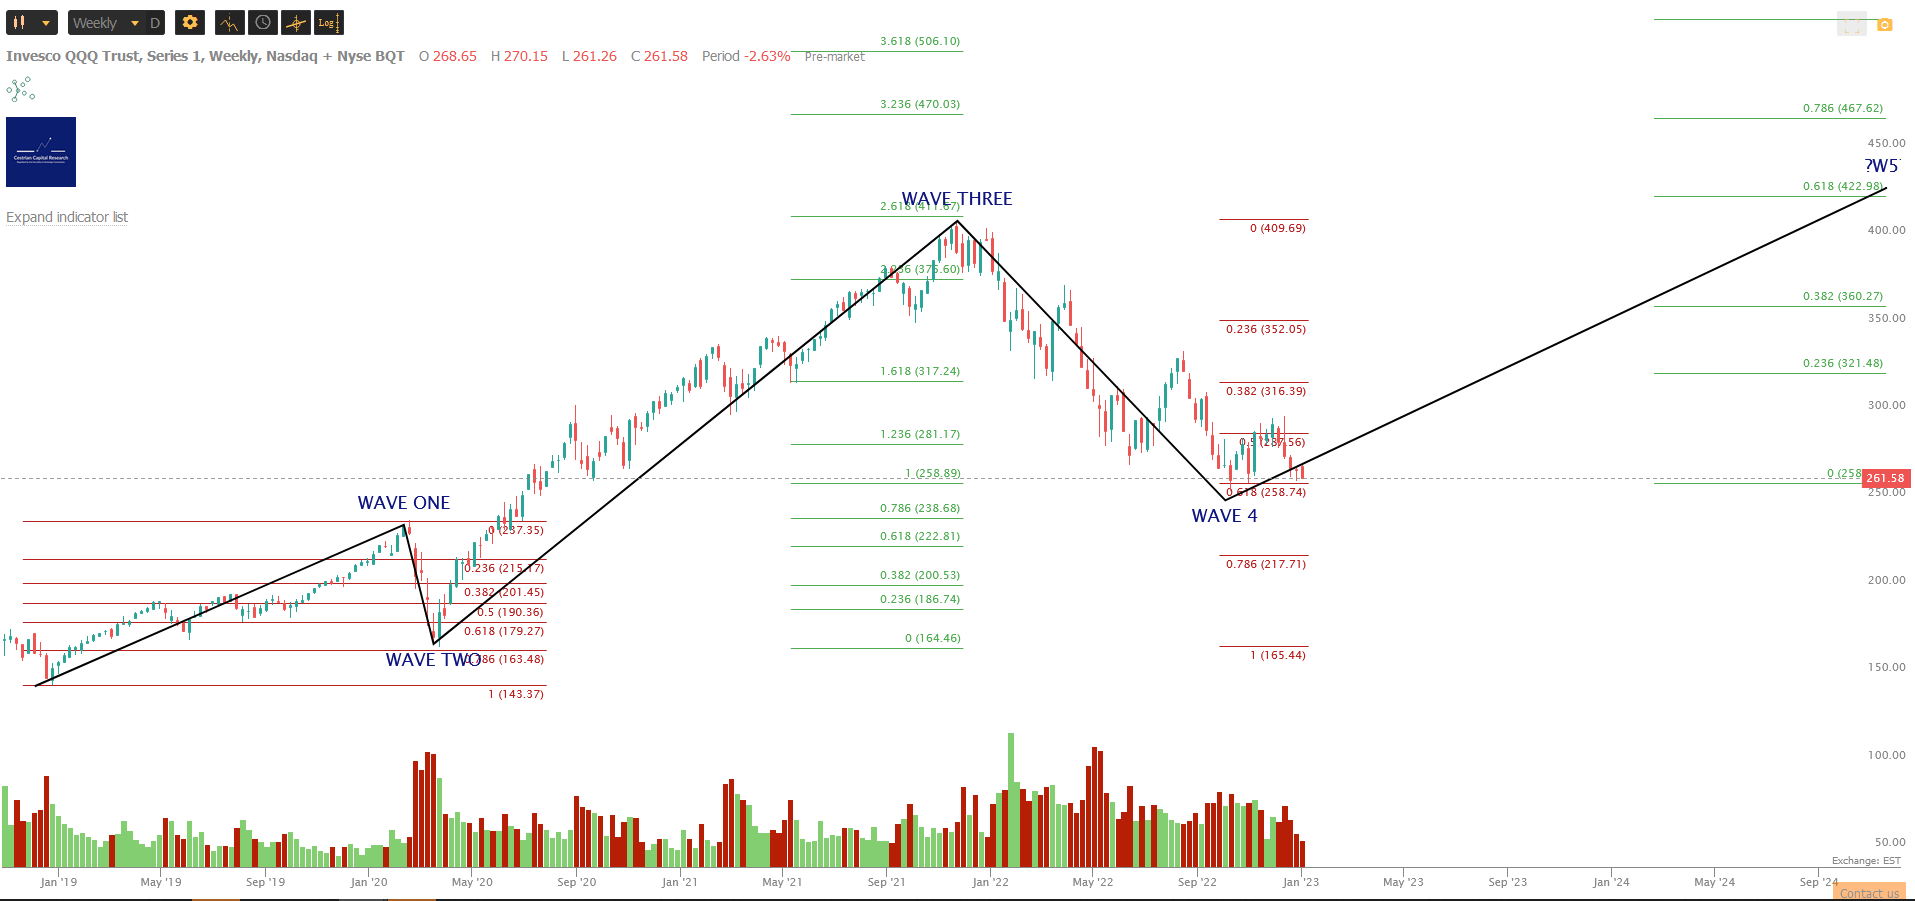
QQQ Chart II (TrendSpider, Cestrian Analysis)
Our best guess is that the low is in for this cycle. Now, we’ve been wrong before on this, so we should say right away that if $258 doesn’t hold, the next stop on the Bear Train To Doomsville is $237, which is that prior Wave 1 high. So if you are contemplating buying QQQ at this stage, placing a stop a little below that $258 level is likely sensible.
If the low is in?
Then we think this 5-wave cycle can terminate between $423 and $467, which is the 61.8% and 78.6% extension of Waves 1+3 combined. That’s not complete voodoo but instead a couple of common Wave 5 termination points. As for how long it takes to get there? We’ve set the Wave 5 above to climb at the same rate as in 2019. Reason? Well, for the market to move up we’re going to need some accommodation from the Fed, and 2019 moved up following just that kind of policy shift. And we can be fairly certain this Wave 5 won’t move up at the rate of the 2020-21 Wave 3 because as everyone knows, it was a result of too much money being shoveled into the system by the Fed, a mistake that is unlikely to repeat itself this soon. So, on that basis, we’ll nail our colors to – around $350 by year end 2023 (that’s +36% from here) and $420 or better by Q4 2024.
Now, let’s see how well this one ages!
Cestrian Capital Research, Inc – 6 January 2023.
Be the first to comment