

wundervisuals/E+ via Getty Images
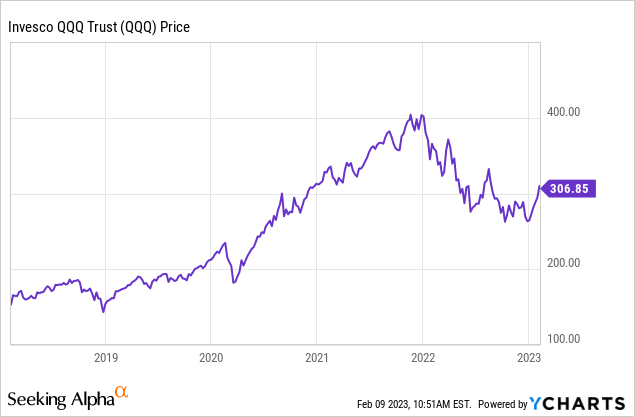
Stocks have staged a monster rally since the start of the year, with the NASDAQ (NASDAQ:QQQ) soaring 16% in the first five weeks of the year. Stocks have been all but invincible, brushing aside dozens of weak earnings reports and going all-in on a Fed pivot. Fed Chair Jerome Powell announced a 0.25% interest rate hike to 4.50-4.75% at January’s FOMC meeting but declined to challenge the market when asked about the massive rally in stocks. During and after his speech, traders poured billions into call options, breaking the all-time volume record set during the meme stock frenzy of January 2021. Fundamentals couldn’t matter less-YOLO and FOMO are king. This 2023 rally has been led by a ragtag group of stocks, with Tesla (TSLA) up nearly 100%, Carvana (CVNA) soaring nearly 200%, and anything tangentially related to artificial intelligence entering the stratosphere. Even the broad S&P 500 (SPY) is up an eye-popping 8% YTD as of my writing this.
Are Stocks In An Echo Bubble?
Anyone watching the violent movements in the market lately should be able to understand that something is amiss. Massive, irrational swings are unsettling. Financial orthodoxy suggests that the way to have a happy retirement is to put the vast majority of your money in the stock market and not to try to time the market! But really? If you own a coffee shop on Main Street or a Chevy dealership, the fundamental value of your business does not fluctuate by 100% in 5 weeks. However, the stock market is a different animal, meaning we need a more flexible framework to understand what’s going on.
One way to understand what’s going on is to study some experiential economics. Economist Vernon L. Smith won a Nobel Prize for recreating real-world market scenarios in lab studies. Some of his most famous studies were where “investors” were brought into the lab to trade with each other, and the researchers were able to create asset bubbles and crashes even when the fundamental value of the traded assets was known. Another interesting finding was that when they invited the participants to play a second time, they usually created a second bubble, known as an “echo bubble“.
Essentially, some participants learned from the first bubble not to pay irrational prices for stuff, some knew they were paying irrational prices but passed the assets off to “greater fools,” and some didn’t seem to learn at all. In any case, the second bubble is generally much smaller than the first, and it doesn’t last nearly as long. Nonetheless, whether you call them dead-cat bounces, bear market rallies, or echo bubbles, these types of moves are surprisingly common, especially in extended bear markets like 2000-2002, where there were 3 rallies of 17% or greater and a near-wipeout of the fourth and final rally.
The NASDAQ was clearly in a bubble in 2000 and again in 2021. Some people might disagree with me, but if you didn’t see any signs of froth in 2021, then you weren’t paying attention to the fundamentals. Below is the market cap of growth over the market cap of value going back to 1995. Growth and value each represent half of the securities in the S&P 500 Index (note that the data predates some of the current rallies).
Market Cap of Growth Vs. Value (Yardeni Research)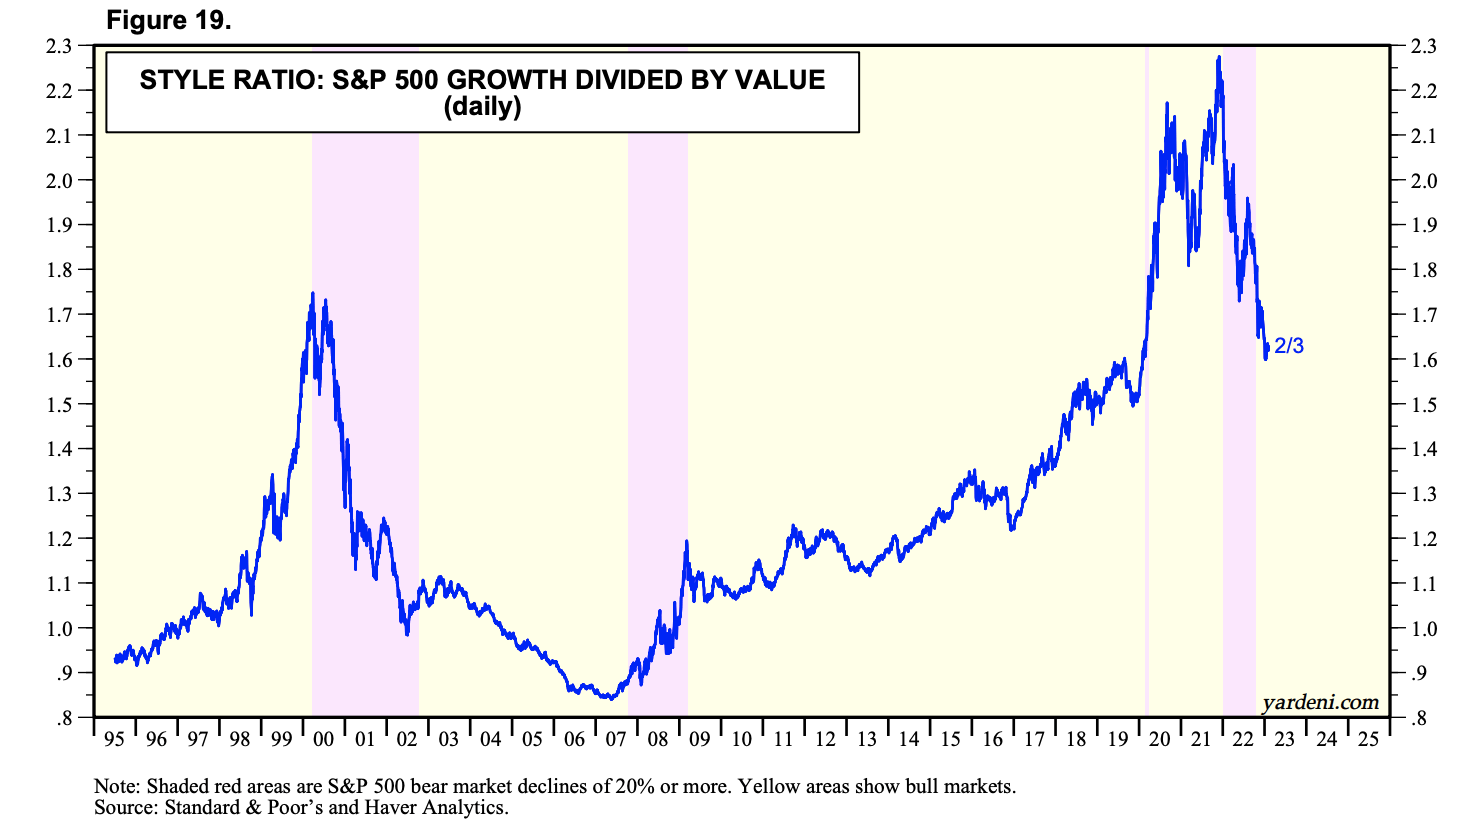
Another way of looking at this is to compare the underlying PE ratios of growth vs value. (I don’t have as good of historical PE data for NASDAQ, so I’m substituting “growth” as a proxy. Note that this isn’t an endorsement for “value” stocks – as defined by the mutual fund/ETF companies.
S&P 500 Growth and Value PE Ratios (Yardeni Research)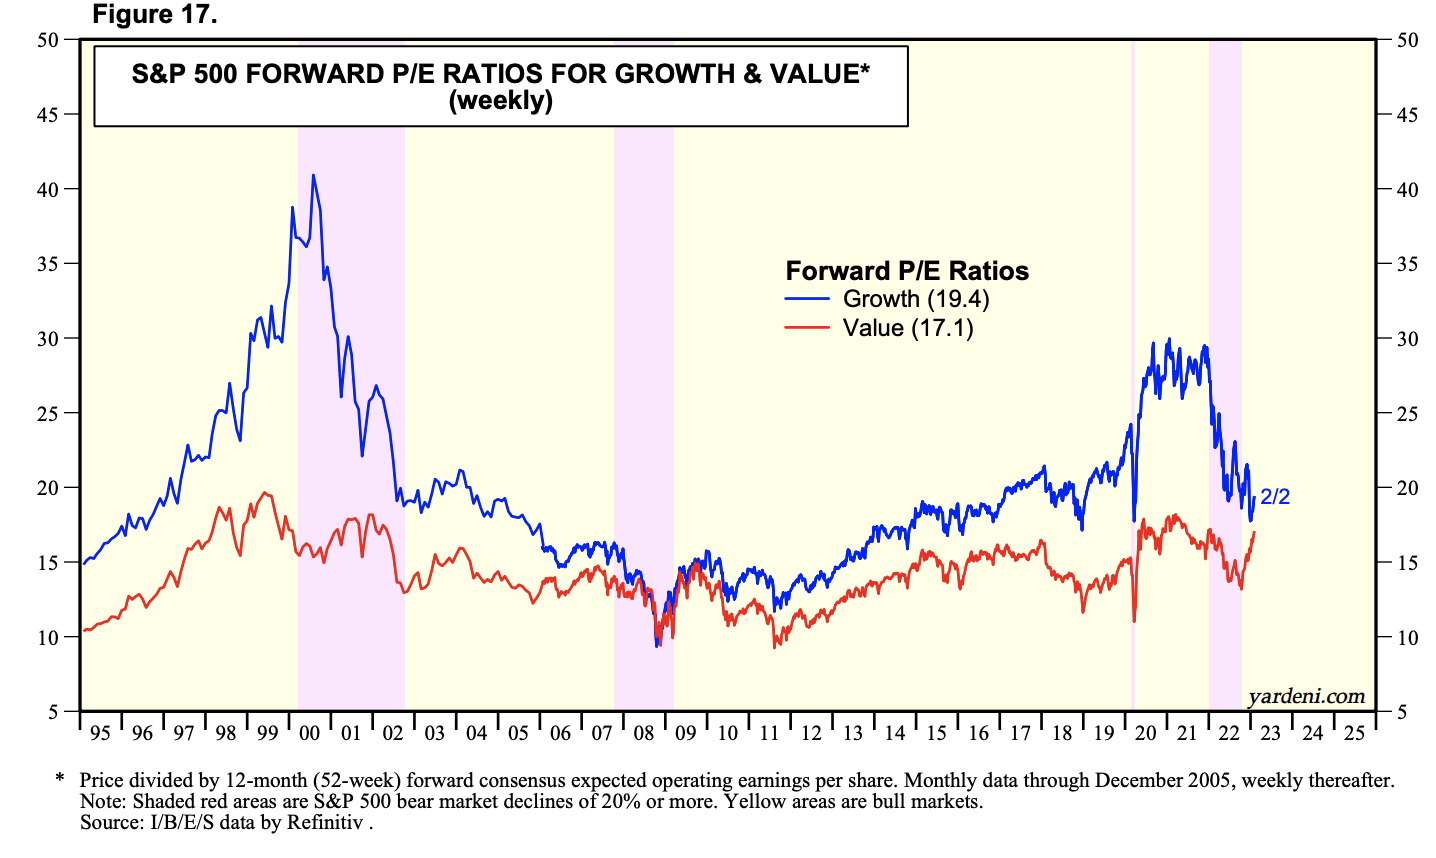
By one measure, 2021 was crazier than the dot-com bubble, but by another, it didn’t get quite as out of hand. These are both fairly consistent with behavioral finance theory. In both graphs, note the strong countertrend rallies by investors. These are echo bubbles by traders who think they’re buying dips or are playing on momentum. Once the trend reverses, it tends to stay down because there aren’t enough believers to come in and buy when the fundamentals no longer justify it.
We can also just look at the NASDAQ component valuations and reality-check them to see if valuations are suddenly reasonable. They’re mostly not. Apple (AAPL) trades for 25x earnings with single-digit growth prospects at best, Microsoft (MSFT) has better growth prospects but is nearing 29x, Amazon (AMZN) trades for 66x earnings, Nvidia (NVDA) trades for 52x earnings, Google (GOOG) (GOOGL) trades for 20x, Tesla trades for 51x, and even Meta (META) trades for 20x now. These alone are nearly 50% of the NASDAQ’s market cap, and they’re trading from anywhere from 20x to 70x shaky 2023 earnings estimates. You can buy some of these if they get cheaper (i.e., Google and Microsoft), but stocks like Nvidia, Tesla, and Amazon could easily fall another 50-70% and still not be cheap. Cash will be paying 5% in the coming months, far in excess of the earnings yields of long-duration mega-cap tech darlings. If they even so slightly miss growth expectations, there will be a nasty repricing in their shares.
Has the world really fundamentally changed over the past 5 weeks? Is Tesla twice as valuable as it was in December? Are meme stocks like Carvana going to the moon? The answer to all of these questions is no. The likely diagnosis is in. We’re in an echo bubble that will soon pop, just like the last ones did.
Traders Are Ignoring Inflation Red Flags At Their Peril
After Jerome Powell folded to the market’s bluff on February 1st, there has been a sense from the market that nothing can stop the rally. Big tech earnings already were released – they were soft and investors simply shrugged them off. The Fed meeting has already come and gone. Investors seem excited to buy as much as they can before the Fed pivots, not realizing that their actions are inadvertently contributing to the inflation that they are betting is over.
But while bulls were partying, some super-interesting inflation data came in, and the surprisingly popular minority opinion is that inflation is not over.
First came some wholesale used car data that indicates that the fall in used car prices has sharply reversed. Used car prices make up 4.5% of core CPI, and wholesale prices rose 2.5% in January. That alone accounts for an 11 basis point rise in core CPI. It might not come yet in January, but when it hits, it’s going to put a lot of pressure on the core CPI numbers, which already aren’t that great. The used car market is behaving consistently with the theory of the echo bubbles, buyers who had waited for used car prices to come down in 2022 jumped at the first opportunity for prices to fall.
Second is some signs of something similar happening in the housing market. Housing market fundamentals continue to worsen, but past bubbles and current data show a similar echo bubble trend, where a few buyers hop back in to try to time the market. The Fed is concerned about this because it means they’ll have to raise rates higher than they would otherwise, and because it makes it more likely that overextended buyers get hurt.
US Home Prices (Fortune)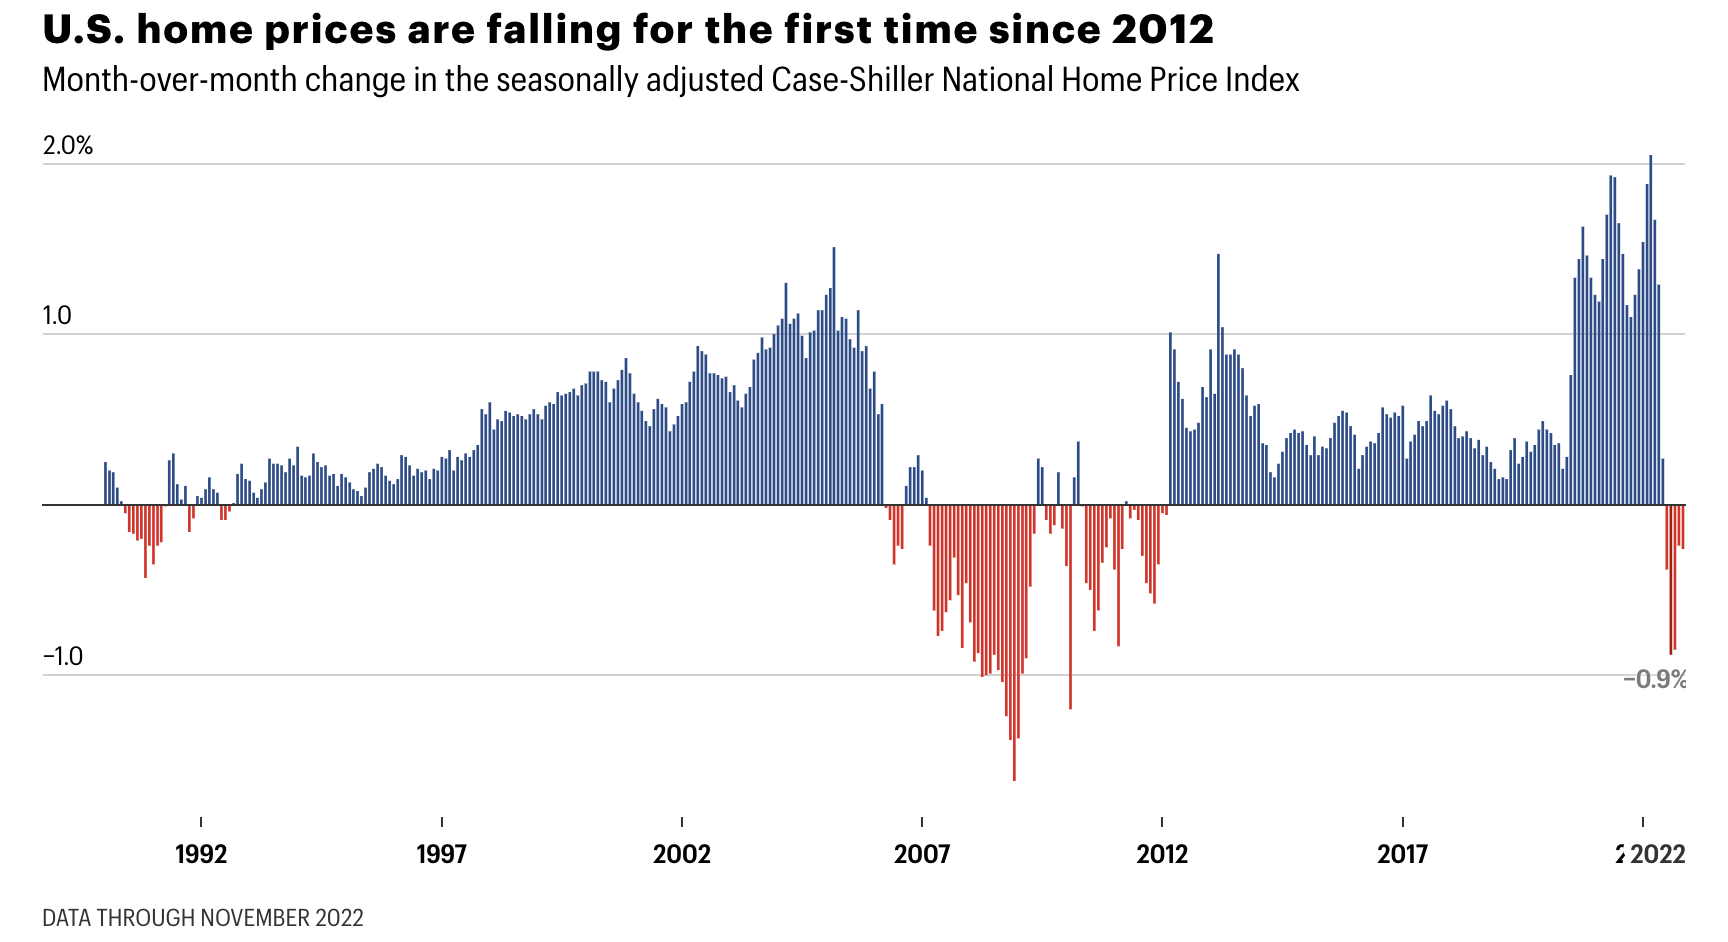
See the echo bubble during the first housing bubble?
Third, some European inflation data has come in shockingly high for January. Core CPI in Spain rocketed higher in January. In Italy, core CPI accelerated as well, despite a decrease in energy costs. German core inflation held steady rather than declining as anticipated.
Some sharp long-term bets are starting to come in that the Fed will not be able to pivot, that rates will go higher for longer, and that this inflation isn’t different from all the other times governments have fired up their printing presses. Market implied 10-year inflation rates have rallied smoothly but quietly off of their lows set in December. Yes, the labor market remains strong, with implications for better or worse on inflation and growth. But the stock market isn’t the economy, as evidenced by goofy lab studies where investors reliably create bubbles and crashes.
Bottom Line
If you feel silly because you missed this 17% rally in the S&P 500 and 18% rally in the NASDAQ since October and are earning 4.5% in cash, don’t! Valuations remained stretched in 2022, while cash rates have soared. As such, the best investors can expect at current prices is low long-term returns in excess of cash and a ton of volatility. The face-ripping 2023 rally in all kinds of speculative stocks should not be bought, but should rather be sold. The rally may go out with a bang or a whimper, but there’s an increasing amount of evidence that the Fed will be forced to hike by rogue inflation. The long-term picture for stocks is mildly positive, but the short-term risk-reward is exceedingly weak. Even if there were no structural economic problems, stocks would still be expensive at current prices compared with historical figures. I’ll cover the inflation/Fed picture in-depth early next week before January CPI is released on Tuesday.
Be the first to comment