

Sundry Photography/iStock Editorial via Getty Images
When we last analyzed Qorvo Inc. (NASDAQ:QRVO), we determined the company stood to benefit from the 5G wave given its broad portfolio of innovative RF solutions and highly differentiated semiconductor technologies. Qorvo derives the majority of its revenue from mobile products (71%), which is heavily reliant on Apple (32% of total revenue). In addition, Qorvo has also won contracts for new 5G phones from Samsung Electronics, Huawei Technologies and LG Electronics. Its RF chips are used across multiple industries, and we determined at the time that Qorvo had a strong footing in BAW filters, competing with Broadcom and Skyworks.
While Apple is the company’s major customer accounting for 30% of its revenue, Qorvo has large revenue exposure to Asian customers such as Samsung and leading Chinese smartphone makers which consist for 55% of its revenues in 2021. Compared to Apple which has already launched its first generation of 5G phones in 2020, the Asian smartphone makers have yet to fully roll out their 5G smartphones which we believe presents an opportunity for Qorvo.
We analyzed Qorvo’s RF Fusion20 RFFE modules developed to enable 5G support across lower-priced smartphones, by tackling the space constraints. We determined Qorvo had the competitive advantage compared to Qualcomm and Skyworks, given the higher amount of product advantages of its RF components. However, we determined through financial analysis that the company’s margins are weaker than its competitors, which we believe is due to their large exposure to mid-tier smartphone makers. Overall, we see its growth supported by its relationships with leading mid-tier smartphone makers, which are in the process of rolling out 5G phones.
Growth of 5G To Be Driven By Asian Smartphone maker Customers
Based on its annual report, Qorvo derives the majority of revenues from the Asian region at around 55% in 2021. Around 40% of revenues were from China and trailed the US very closely. The company has ties with major Chinese smartphone makers including Xiaomi, Oppo, Vivo and Huawei as well as Samsung (OTC:SSNLF) in Korea. As cited in our previous analysis, the top 5 leading smartphone makers account for 82% of the 5G smartphone market as of Q1 2021.
Qorvo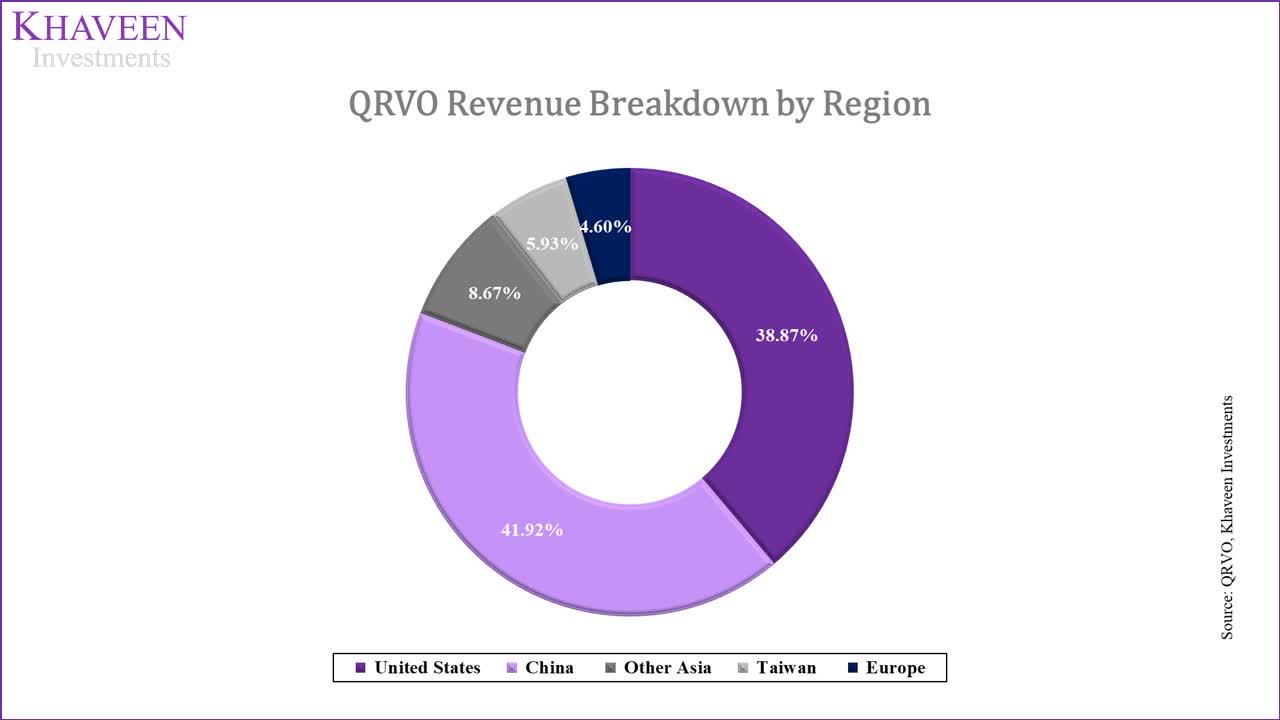
Still, Apple (AAPL) is the company’s largest customer accounting for 30% of revenues based on its annual report. Apple was also the largest 5G smartphone maker with a market share of 34% in Q1 2021. However, in the mid-tier 5G smartphone market, the major Chinese smartphone makers such as Vivo, Oppo, Xiaomi as well as Samsung lead with a market share of 77% combined according to Counterpoint Research.
Also, more than 92% of 5G smartphones are priced above $200 in Q2 2021. Based on IDC’s smartphone market breakdown by price bands, smartphones below $200 accounted for nearly half of the total smartphone market. Thus, we believe that this shows the massive opportunity for the 5G market to grow in the lower-priced smartphone market. Adoption of 5G of low and mid-tier smartphones is expected to continue rising as these smartphone makers continue to launch new designs which incorporate 5G connectivity and support.
We calculated the portion of each smartphone maker’s 5G smartphone shipments as a percentage of their total shipments in the table below.
Following the launch of the iPhone 12 with 5G support across all models, Apple’s 5G smartphone shipments as a % of its total shipments stood at 26% in 2020. It is also higher than the market average of 20.2%. In comparison, Samsung, Xiaomi and other smartphone makers have a relatively low percentage of 5G sales which we believe presents a massive growth opportunity for Qorvo.
|
Smartphone Makers 5G Shipments (‘mln) |
5G Shipments (2020) |
Total Shipments (2020) |
Shipments Share of Total % |
|
Apple |
201.1 |
26.0% |
|
|
Oppo |
111.8 |
21.1% |
|
|
Vivo |
108.5 |
21.9% |
|
|
Samsung |
255.7 |
14.7% |
|
|
Xiaomi |
145.7 |
17.0% |
|
|
Others |
508.5 |
31.3% |
|
|
Total |
1332.7 |
20.2% |
Source: Strategy Analytics, Counterpoint Research, Mobile World Live, Khaveen Investments
We derived the 5-year CAGR of 5G smartphone sales by the leading smartphone makers based on an estimate of 69% of the total smartphone market being 5G in 2025 by the IDC which we applied to all companies as our assumption. We forecasted Samsung and Xiaomi to have the highest CAGR of 41.3% and 37.3% respectively followed by Oppo and Vivo but still at a higher CAGR than Apple.
|
Forecast of 5G Shipments by Smartphone Makers |
% of 5G (2020) |
Total Shipments |
5G Shipments (2020) |
Total Shipments (2025F) |
% of 5G (2025F) |
5G Shipments (2025F) |
5-Year CAGR |
|
Apple |
26.0% |
201.1 |
52.2 |
241.5 |
69% |
166.66 |
26.1% |
|
Oppo |
21.1% |
111.8 |
23.6 |
134.3 |
69% |
92.65 |
31.4% |
|
Vivo |
21.9% |
108.5 |
23.8 |
130.3 |
69% |
89.92 |
30.4% |
|
Samsung |
14.7% |
255.7 |
37.6 |
307.1 |
69% |
211.90 |
41.3% |
|
Xiaomi |
17.0% |
145.7 |
24.7 |
175.0 |
69% |
120.74 |
37.3% |
|
Others |
21.1% |
508.5 |
107.1 |
610.7 |
69% |
421.40 |
31.5% |
|
Total |
20.2% |
1,333 |
269.0 |
1,601 |
69% |
1,104 |
32.6% |
Source: Strategy Analytics, Counterpoint Research, Mobile World Live, IDC, Khaveen Investments
Overall, we believe that this is significant for Qorvo due to its significant exposure to the leading Asian smartphone makers including Samsung, Xiaomi, Oppo and Vivo as it derives around half of its revenues from the Asian continent. These smartphone makers dominate the 5G market for mid-tier smartphones and are expected to exhibit the highest growth rates in the next 5 years as 5G penetrates mid and low-tier smartphone devices. As Qorvo caters to these customers, we believe that it is poised to benefit from its customers’ continued development of 5G phones as an RF supplier.
Qorvo’s Integrated RF Fusion20 Enabling Greater 5G Adoption
One of the headwinds of the adoption of 5G across lower-priced smartphone tiers is the higher cost factor associated with 5G components. According to Strategy Analytics, smartphone makers require integrated RFFE products to meet space constraints in 5G models. Comparing Huawei’s Mate 20 4G model with its 5G model in the chart below from SEMI, the PCB area and package size for the 5G are more than twice that of the 4G model.
SEMI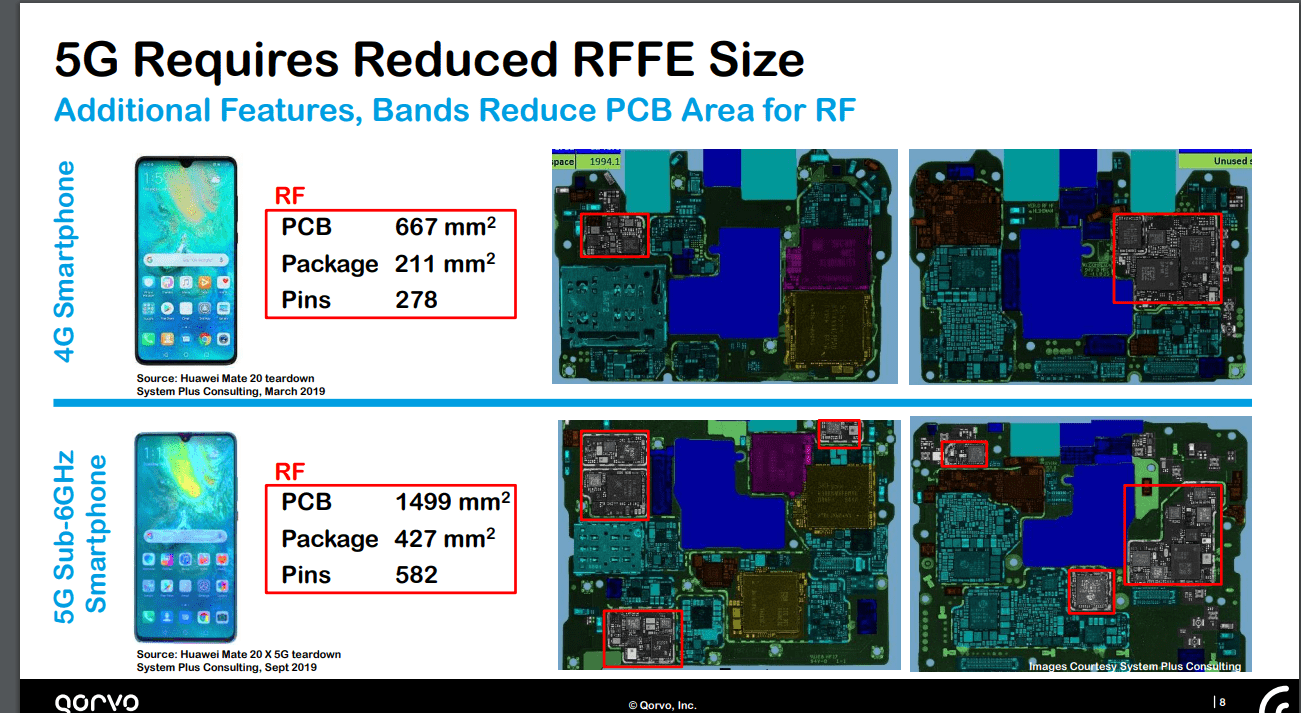
Source: SEMI
Qorvo has highlighted its commitment to the adoption of 5G across all smartphone price tiers in the development of its RF Fusion20 RFFE modules. It claimed to integrate various RF components by combining its “world-class GaAs power amplifiers, advanced BAW multiplexing and integrated RF shielding” in a solution to support its customer’s growth of low and mid-tier 5G phones according to the company. Qorvo highlighted the integration of a low-noise amplifier (LNA) which helps to improve receive performance and connectivity and its RF Shielding that minimize unwanted RFFE components’ interaction. Its complex switches also enable it to support every key sub-6GHz frequency band.
Furthermore, the integrated solution also features Qorvo’s antenna-plexers. According to Mobile Systems, an antenna catches ‘radio waves and turns them into electrical signals into phone or television’. It plays a very important role in the development and deployment of 5G. A 4G smartphone typically needs 4 to 8 antennas and hence 5G will need more than that. However, new trends in smartphone designs such as bigger batteries, more cameras, motion sensing and fingerprint/facial recognition reduce the space available for more antennas.
Reducing the need for antennas brings two main advantages. Firstly, the smartphone designers could have more innovative designs as the restriction becomes fewer since the number of antennas is decreased. Designers can make the phone do more with optimized antenna spacing. The next one is cost savings. Since the required antennas become fewer, it means there is less need for internal cabling, connectors and springs which save space and reduce costs.
Qorvo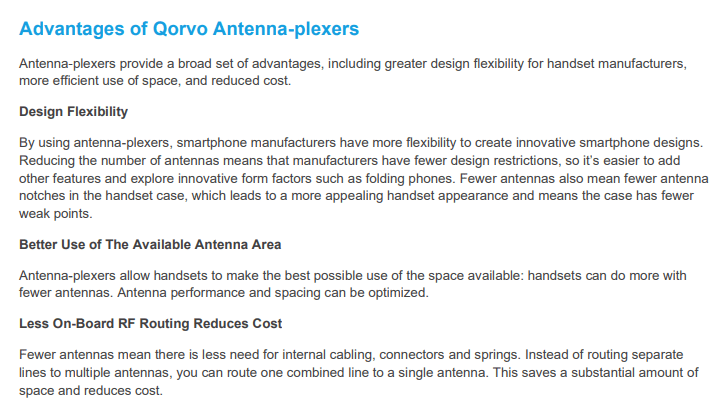
Source: Qorvo
Comparing Qorvo against competitors such as Qualcomm and Skyworks, we analyzed the integrated RFFE modules for these companies in terms of their RF components and their main advantage. Qorvo’s Fusion 20 integrates a low-noise amplifier and RF Shielding, which provides a key advantage in better connectivity and signals receiving and minimizing unwanted interactions between RFFE components respectively. Preventing undesirable interactions between RFFE components enables manufacturers to simplify development and accelerate time to market. Its complex switches also allow it to support all sub-6GHz frequency bands. Whereas Qualcomm’s integrated RFFE solution stands out in receiving mmWave as it integrates mmWave antennas in its solutions.
|
Company |
RF Components |
Key Advantage |
|
Qorvo (Fusion20) |
|
|
|
Qualcomm |
|
|
|
Skyworks (Sky5) |
|
Source: Qorvo, FierceWireless, Skyworks, Omdia
Based on our 5G RF content growth rate of 1.93x derived from our previous analysis driven by higher RF content requirements to support greater RF complexities and frequencies of 5G, we projected the RF demand growth from Apple and other smartphone makers through 2025 assuming 69% of smartphone sales are 5G. For Apple, we derived a CAGR of 6.96% and 7.76% for other smartphone makers.
|
Qorvo MP Revenue Breakdown |
Apple |
Others |
Total |
|
5G Shipments (2020) |
52.2 |
216.8 |
269.0 |
|
% of 5G (2020) (‘a’) |
26.0% |
19.2% |
20.2% |
|
5G Shipments (2025) |
174.8 |
982.1 |
1156.9 |
|
% of 5G (2025F) (‘b’) |
69.0% |
69.0% |
69.0% |
|
5G RF Content Increase (‘d’) |
1.93 |
1.93 |
1.93 |
|
5G Share Increase (‘c’) |
43.04% |
49.82% |
48.79% |
|
5G RF Content Growth % (‘e’) |
39.97% |
46.26% |
45.31% |
|
5-Year CAGR (‘f’) |
6.96% |
7.90% |
7.76% |
*c = b – a
e = [(c x d) + (1 x (1-c)]-1
f = (1+e)^(1/5)-1
Source: Qorvo, Khaveen Investments
With this, we projected Qorvo’s Mobile Products Segment revenues in FY2022 based on its prorated Q1 to Q3 results followed by our derived RF forecast CAGR beyond that and tapering by 0.5% per year as a conservative estimate.
|
Qorvo Mobile Products Segment ($ mln) |
2020 |
2021 |
2022F |
2023F |
2024F |
2025F |
2026F |
|
Apple Revenues |
791 |
857 |
1,072 |
1,147 |
1,221 |
1,293 |
1,364 |
|
Apple RF Revenue Growth % |
8.3% |
25.1% |
6.96% |
6.46% |
5.96% |
5.46% |
|
|
Others Revenues |
1,607 |
2,000 |
2,501 |
2,699 |
2,899 |
3,099 |
3,297 |
|
Others Growth % |
24.5% |
25.1% |
7.90% |
7.40% |
6.90% |
6.40% |
|
|
Total Revenue |
2,398 |
2,857 |
3,573 |
3,846 |
4,119 |
4,392 |
4,661 |
|
Total Growth % |
19.1% |
25.1% |
7.6% |
7.1% |
6.6% |
6.1% |
Source: Qorvo, Khaveen Investments
Thus, in addition to its exposure to leading mid-tier Asian 5G smartphone makers, we believe that the company’s commitment is highlighted by the development of its Fusion20 integrated RFFE modules which integrate various RF components to deal with the costs and space constraints headwinds associated with introducing 5G connectivity for low to mid-tier smartphones. However, at the same time, we also believe that Qualcomm and Skyworks offer an attractive integrated RF solution which may pose a competitive threat to Qorvo.
Superior Margins of RF Segment Than IDP Segment
In terms of operating margins, the company’s Mobile Products segment has superior margins to its Infrastructure and Defense Products segment. In 2021, the MP segment had operating margins of 35.3% compared to 24.5% of the IDP segment based on its annual report. The IDP segment consists of general analog products such as power semiconductors and MEMs.
|
Segment Operating Margins % |
Mobile Products |
Infrastructure and Defense Products |
|
Revenue |
2,856 |
1,158 |
|
Operating Income |
1,008 |
283.5 |
|
Operating Margins |
35.3% |
24.5% |
Source: Qorvo
The superior margin of MP highlights the relatively concentrated RF market with the top 5 accounting for almost 80% of the market share of RF semiconductors. We believe this indicates the relatively weaker bargaining power of buyers compared to the analog market.
However, in comparison with competitors, the company’s margins are weaker as it has lower market shares than Murata, Broadcom and Skyworks and lower scale. Its gross margins have a 5-year average of 41% which is below the average of 50.8% as well lower than average net and FCF margins. Its SG&A as a % of revenue is the highest among competitors.
|
Company |
Gross Margins – 5 yr Avg |
Net Income Margins – % 5 yr Avg |
FCF Margins – 5 yr Avg |
R&D as % of Revenue – 5yr Avg |
SG&A as % of Revenue -5yr Avg |
|
Qorvo |
41% |
6.06% |
19.17% |
14.85% |
14.18% |
|
Skyworks |
49.45% |
26.15% |
19.56% |
11.21% |
5.95% |
|
Murata (OTCPK:MRAAY) |
37% |
12.78% |
0.09% |
6.69% |
13.80% |
|
Qualcomm |
59% |
10.49% |
21.30% |
23.68% |
9.79% |
|
Broadcom |
68% |
19.03% |
40.20% |
19.71% |
6.09% |
|
Average |
50.79% |
14.90% |
20.06% |
15.23% |
9.96% |
Source: Company Data, Khaveen Investments
Though, its R&D and SG&A spending as a % of revenue have been decreasing slightly on a 10-year average compared to its 5-year average as the company’s scale grew.
|
Qorvo |
5-Yr Average |
10-Yr Average |
|
R&D as % of revenue |
14.85% |
15.96% |
|
SGA as % of Revenue |
14.18% |
14.47% |
Source: Qorvo
We expect its margins to continue to improve through 2026 as the company’s scale improves. Overall, the company’s RF segment which is not only its largest segment but is also more profitable with higher margins. We attribute this to the company’s established market positioning in the relatively concentrated RF semiconductor market compared to the analog market.
Qorvo, Khaveen Investments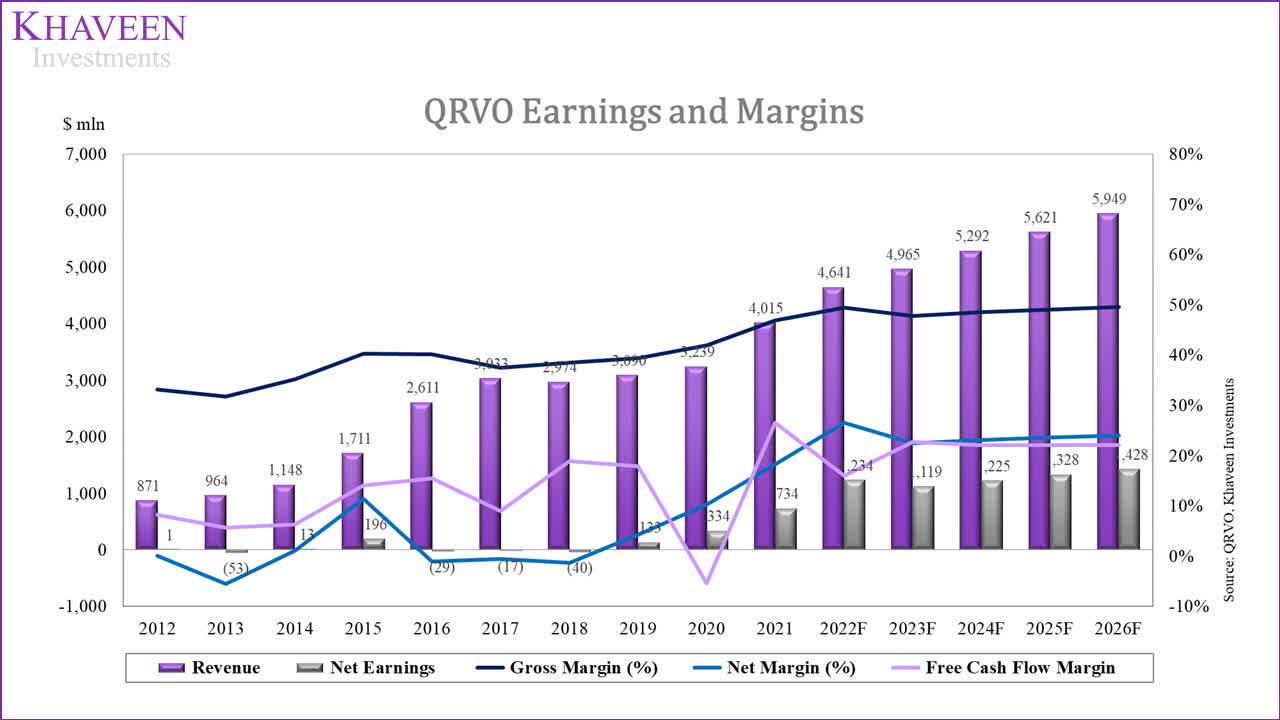
Risk: Apple In-House Development
While the company has customer relationships with the world’s major smartphone markers, the company’s largest customer, Apple, still represents around 30% of revenues. This highlights its concentration risk from a single customer. Additionally, Apple has been reportedly seeking to develop RF chips in-house which could impact its future business with the company. Compared to competitors, Qorvo has the second-highest revenue exposure to Apple at 30% trailing behind Skyworks at 59% of revenues. Relatively, Broadcom and Qualcomm have a broader business model and are larger than Qorvo. All in all, this could place Qorvo at risk if Apple decides to expand its in-house capabilities.
|
Company |
Contribution of Apple Revenue as % of Total Revenue |
|
Skyworks (SWKS) |
|
|
Qorvo |
30% |
|
Broadcom (AVGO) |
|
|
Qualcomm (QCOM) |
Source: Skyworks, Qorvo, Broadcom, Qualcomm, Murata
Valuation
The company has had an average free cash flow margin of 14.18% for the past 5 years. The company acquired four companies in the fiscal year 2020, i.e. Active-Semi, Cavendish, Custom MMIC and Decawave with Decawave standing almost 50% of the whole acquisition amount.
Qorvo, Khaveen Investments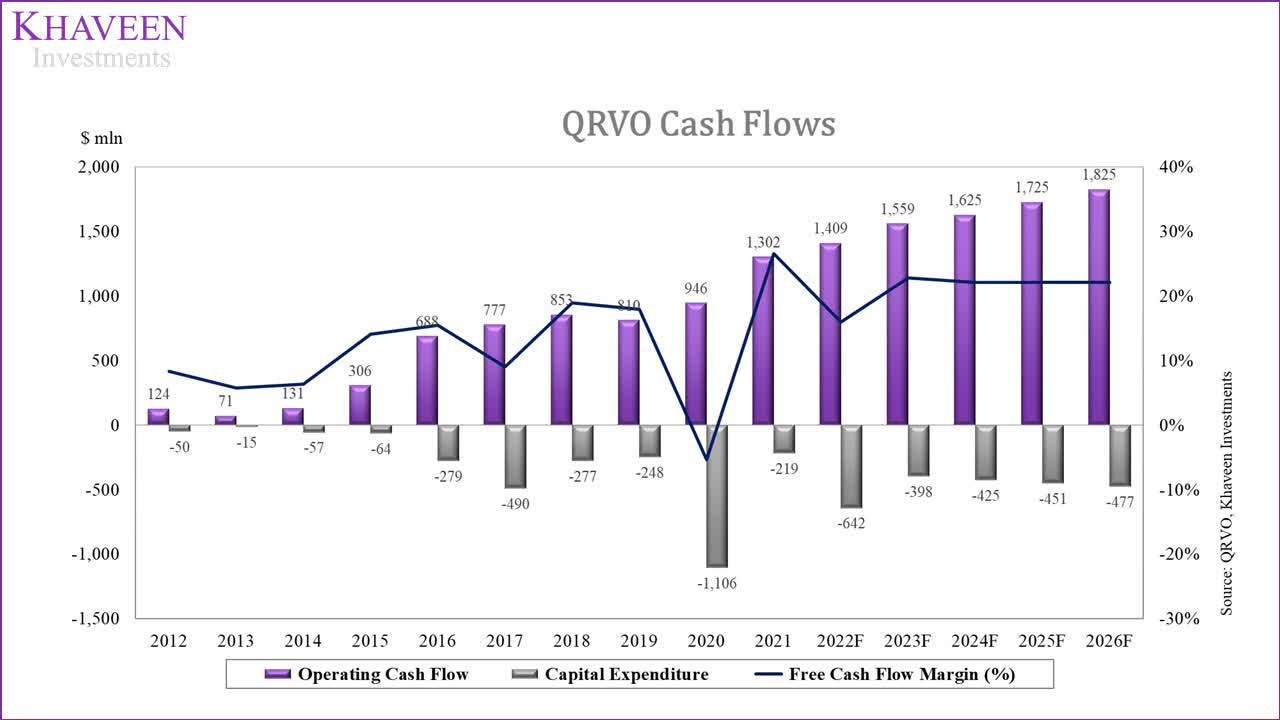
To value the company, we used a DCF analysis as we expect its cash flows to remain positive going forward. We based our terminal value on the chipmaker industry average of 24.15x.
SeekingAlpha, Khaveen Investments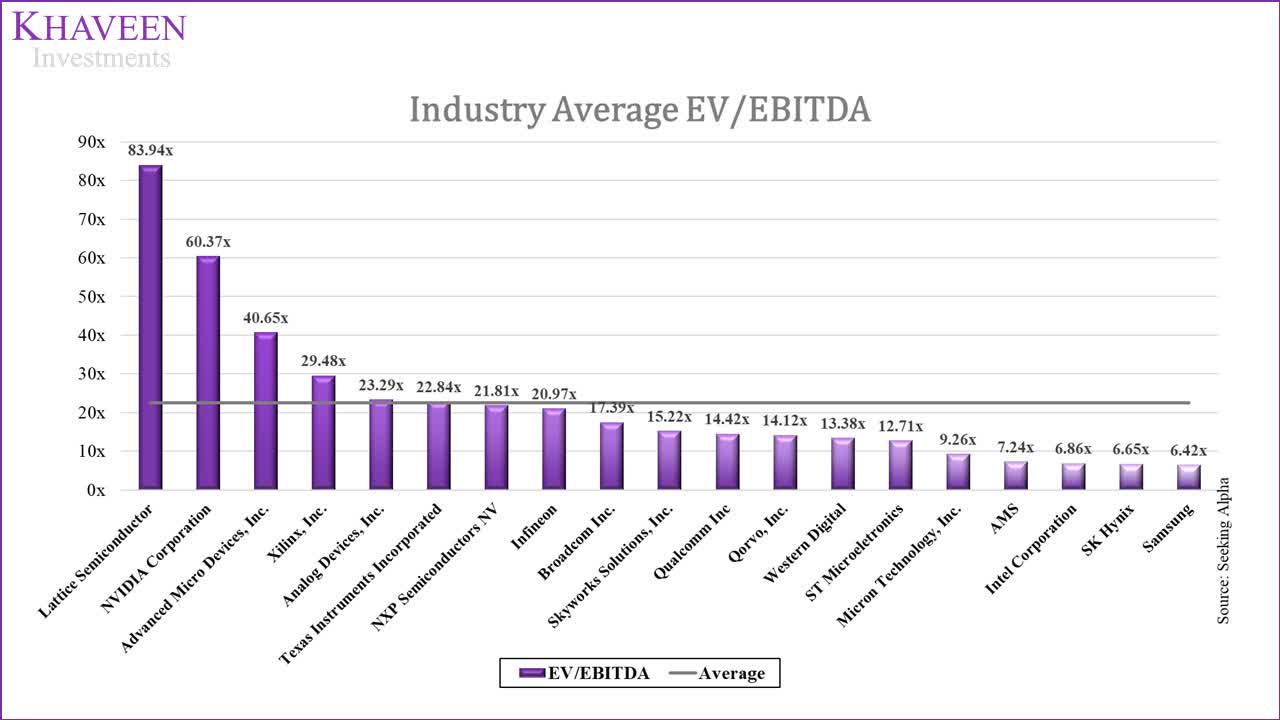
We projected its revenues based on its MP and IDP segments. For MP, we applied our derived CAGR through 2026 as we expect its growth to be supported by its relationships with leading mid-tier smartphone makers. For IDP, we based its growth on the analog market CAGR of 4.8% by Market Research through 2027.
|
Revenue Forecast by Product Segment ($ mln) |
2019 |
2020 |
2021 |
2022F |
2023F |
2024F |
2025F |
2026F |
|
Mobile |
2,198 |
2,398 |
2,857 |
3,573 |
3,846 |
4,119 |
4,392 |
4,661 |
|
Growth % |
0.8% |
9.1% |
19.1% |
25.1% |
7.6% |
7.1% |
6.6% |
6.1% |
|
Infrastructure & Defence Product |
893 |
841 |
1,158 |
1,067 |
1,119 |
1,172 |
1,229 |
1,288 |
|
Growth % |
13% |
-6% |
38% |
-8% |
4.80% |
4.80% |
4.80% |
4.80% |
|
Total |
3,091 |
3,239 |
4,015 |
4,641 |
4,964 |
5,292 |
5,621 |
5,949 |
|
Growth % |
4.0% |
4.8% |
24.0% |
15.6% |
7.0% |
6.6% |
6.2% |
5.8% |
Source: Qorvo, Market Research, Khaveen Investments
Based on a discount rate of 10.6% (company’s WACC), our model shows its shares are undervalued by 102%.
Khaveen Investments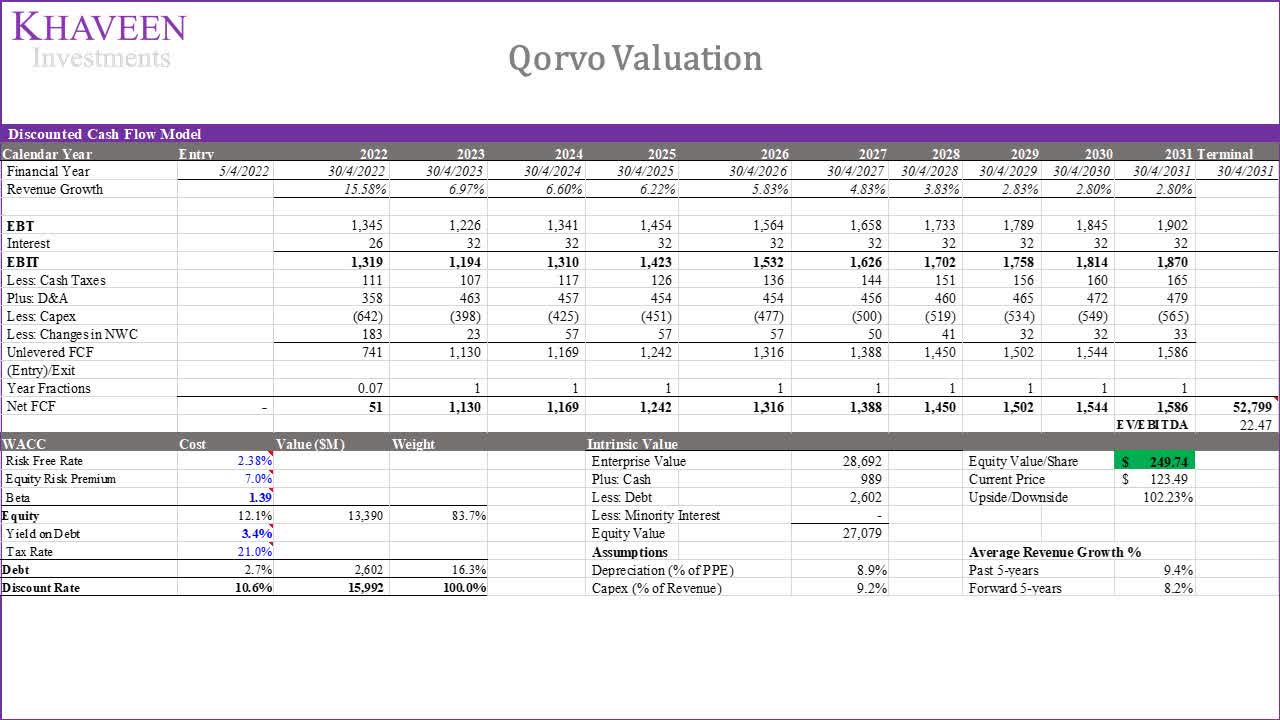
Verdict
All in all, we analyzed its revenue exposure by geographic regions where its Asian based customers contribute the majority (55%) of its revenues. We believe its customer relationships with leading Asian smartphone makers accounting for 77% of the mid-market 5G smartphone benefit the company’s growth outlook as adoption of 5G is expected to increase to 69% of the market by 2025 at a CAGR of 33%. Furthermore, we believe it is well-positioned to benefit from this growth with its RF portfolio including its Fusion20 integrated RF solution which highlights its commitment toward 5G adoption for the mass market. We projected its Mobile Products to grow by 7.6% in FY2023 based on our forecast of the rise in the share of 5G. Lastly, we believe its higher growth RF business is also highly attractive to its financials with higher profit margins than its IDP segment and expect its total gross margins to increase to 49.5% by 2026. Overall, we rate the company as a Strong Buy with a target price of $249.74.
Be the first to comment