

ismagilov
While momentum started (to the best of my knowledge) as quantitative hedge fund strategy in the late 1990s, it is now widely available for all kinds of investors. Democratization of the strategy was especially driven by the rise of ETFs and market indices with momentum-tilts (virtually all index providers like MSCI now have momentum-versions of their flagship indices). By itself, I believe that this is a great development because it gives all investors the opportunity to invest in a well-researched strategy.
This article emerged from an analysis of different momentum-products for the US market. I haven’t originally planned to write about the Alpha Architect U.S. Quantitative Momentum ETF (BATS:QMOM), but the investment process (and performance) turned out to be somewhat different. So I think it is interesting to take a closer look at the methodology.
Momentum – Idea and Evidence
Before we start, let me first define what type of momentum I will look at in this article. I have seen many different (sometimes creative) “momentum” strategies, so I think this is important at this point. I will only cover cross-sectional price momentum for individual stocks. This is different from time-series momentum (a.k.a. trend following/managed futures) and other trend-based strategies.
Okay, now what is cross-sectional price momentum? The basic idea is very simple and, to the best of my knowledge, was first published by Jegadeesh & Titman (1993) and Cliff Asness (1994) in the early 1990s: Stocks with high returns over the last 12 months (winners) tend to outperform stocks with poor returns (losers). Yes, it really is that simple.
For the most basic form of this strategy, you just rank stocks by their 12 month returns and construct a market-cap-weighted portfolio of the top third (the 33% of stocks with the highest 12-month returns). Repeat this procedure every month and you have a long-only momentum strategy. You can also trade momentum as an absolute return/market neutral strategy and simultaneously short a market-cap-weighted portfolio of losers (33% of stocks with the lowest 12-month returns). This long-short portfolio gives you the well-known momentum-factor (also known as “up-minus-down”).
The following chart illustrates the performance of this long-short momentum factor from 1926 to September 2022 for the US. The data comes from Kenneth French’s website, and the portfolio’s construction follows the methodology I described above.
Own illustration of data from Kenneth French’s website (Tuck School of Business)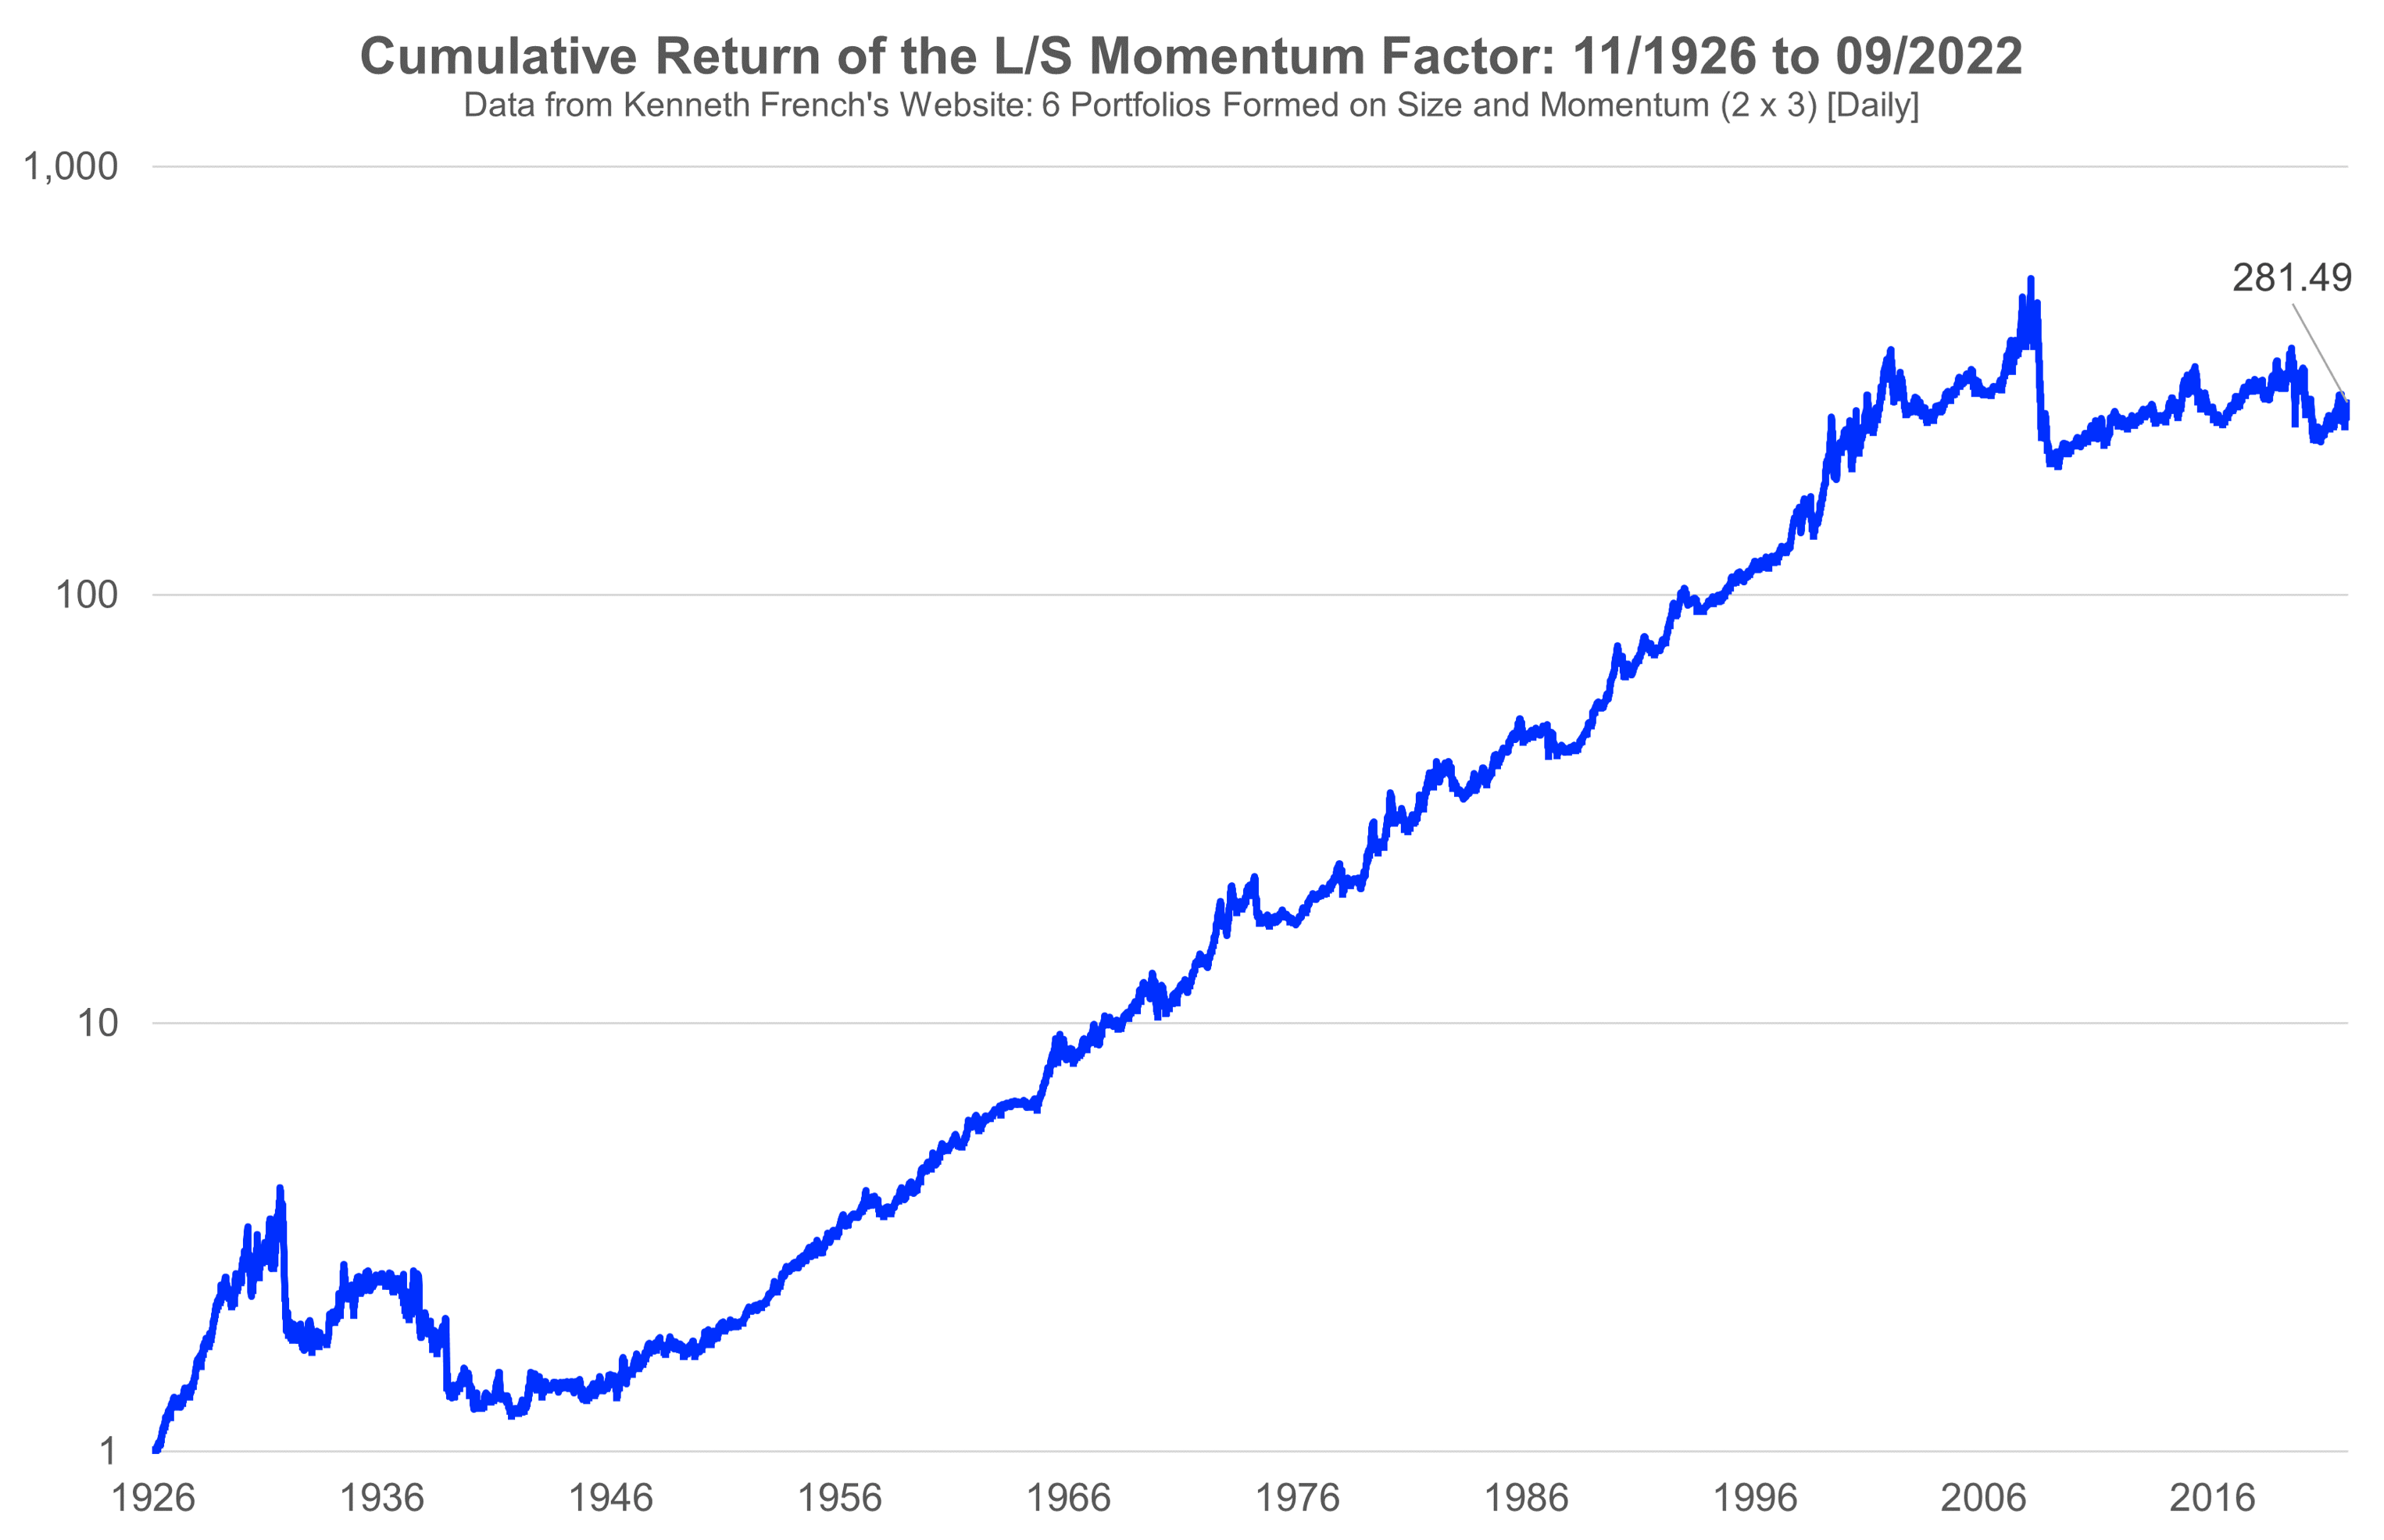
The chart highlights the very strong performance of the momentum factor over almost one century. One dollar invested in November of 1926 grew to about $280 by September 2022. This corresponds to an annualized return of about 6%. Before you criticize that as being lower than the return of the stock market, remember that this is a long-short portfolio that is mostly hedged against market moves. So 6% p.a. for a strategy that is mostly uncorrelated to the overall stock market is in fact pretty attractive.
As always in academia, countless other studies stress-tested those results and found very similar results. Nowadays, the literature on momentum is gigantic and it has become difficult to keep track. The bottom line, however, is almost always the same: momentum is a pervasive empirical phenomenon. Over the years, it has been documented in essentially all international stock markets, other asset classes, and over different time periods (for an overview, check Asness et al., 2013). Even Eugene Fama, famous for his hypothesis of efficient markets and an outspoken skeptic of momentum, acknowledges that momentum is “[…] the premier anomaly.” (Fama & French, 2008)
Why did momentum “work” (and hopefully continues to do so)?
Before investing in the momentum-factor, we should have an idea who is on the other side of the trade and why we may be smarter than the other person (this generally applies to all investment decisions…). In case of momentum, the literature again came up with countless theories. As usual in finance-research, we can sort them into risk-based (“rational”) or behavioral explanations. In the first case, the excess returns of momentum are a compensation for some type of risk. In the second case, momentum profits arise from mistakes of other investors. The first idea is consistent with efficient markets, the second one is not.
Citing all risk-based explanations is beyond the scope of this article, so I will give you just one example to see how the logic works. My personal favorite risk-based explanation are momentum crashes (Daniel & Moskowitz, 2016). The idea is straight-forward. If you look at the return-profile of momentum, you will recognize strong excess returns but also brutal crashes (for example after the financial crisis 2008/09; see chart above). This is not too surprising as momentum is a form of trend-following (you bet that past winners continue to win in the future). Whenever a trend breaks down (past winners suddenly reverse and start losing), the strategy cannot adapt immediately and crashes. Why is this a risk-based explanation for excess returns? Because you capture long-term outperformance as a compensation for exposing yourself to a higher risk for few but brutal crashes. That’s very similar to the structure of an insurance company. Over the long-term they make money, but there are a few unpleasant periods with catastrophes and losses.
Behavioral reasons are also manifold. One of the most prominent is an initial under-reaction of investors (Hong & Stein, 1999) such that stock prices need some time to fully reflect new information. For example, when good news emerge about a company, the idea is that the stock price will not immediately adjust completely. Instead, the price continues to move gradually to the new “fair” level. Momentum investors aim to exploit this price-adjustment by buying (selling) winners (losers) early.
Another behavioral reason that momentum might work is loss-aversion and the well-known disposition-effect (Shefrin & Statman, 1985). Nobody likes to realize losses and we all live in the hope that “paper” losses will come back at some point. Countless studies have shown that investors therefore tend to hold their losers for too long and sell winners too early. This goes directly against the idea of “cut your losses,” and the studies indeed find that this behavior is bad for performance.
Momentum is the exact opposite of the disposition-effect (sell losers and buy winners). In that sense, momentum investors exploit the (irrational) disposition-effect of other investors and therefore, it is a behavioral explanation for the strategy. Momentum investors win because disposition-effect investors lose.
These were just a few examples and the debate whether risk-based or behavioral reasons drive momentum is still not settled. Smart researchers and practitioners debate the issue every single day. The truth is probably somewhere in between. What, in my opinion, is more important is the fact that there is a set of plausible explanations. Together with the pervasive empirical evidence, I think we can therefore be reasonably confident that momentum is not just statistical noise. We are not yet sure what exactly drives it, but we know it is there and it has survived many years of “out-of-sample” testing after the first publications. There, I believe it makes sense to include the strategy in a portfolio.
QMOM and Momentum-Peers
Beyond this simple academic factor, there are of course several asset managers who offer real-world implementations of momentum. Typically, they devote quite substantial resources to efficient execution as momentum requires fairly high (and costly) turnover. For example, AQR writes on its website that their momentum fund “is expected to have annual turnover in excess of 100%, and will therefore employ optimization and other sophisticated techniques to keep transaction costs as low as possible.” In addition to that, momentum-managers typically also try to come up with new signals to improve the strategy even further.
To get an overview, I plotted the cumulative returns of QMOM, two other momentum ETFs (JPMorgan U.S. Momentum (JMOM) and iShares Edge MSCI USA Momentum Factor ETF (MTUM)), and the academic benchmark in the following chart. The sample covers 5 years as this is the longest common period for all funds. Unfortunately, I don’t have access to the time series of the AQR Large Cap Momentum Style Fund. So I could only include that one in the table with annualized returns.
Own illustration of data from Kenneth French’s website (Tuck School of Business and Microsoft Excel Stock API) Own illustration of data from Kenneth French’s website (Tuck School of Business and Microsoft Excel Stock API)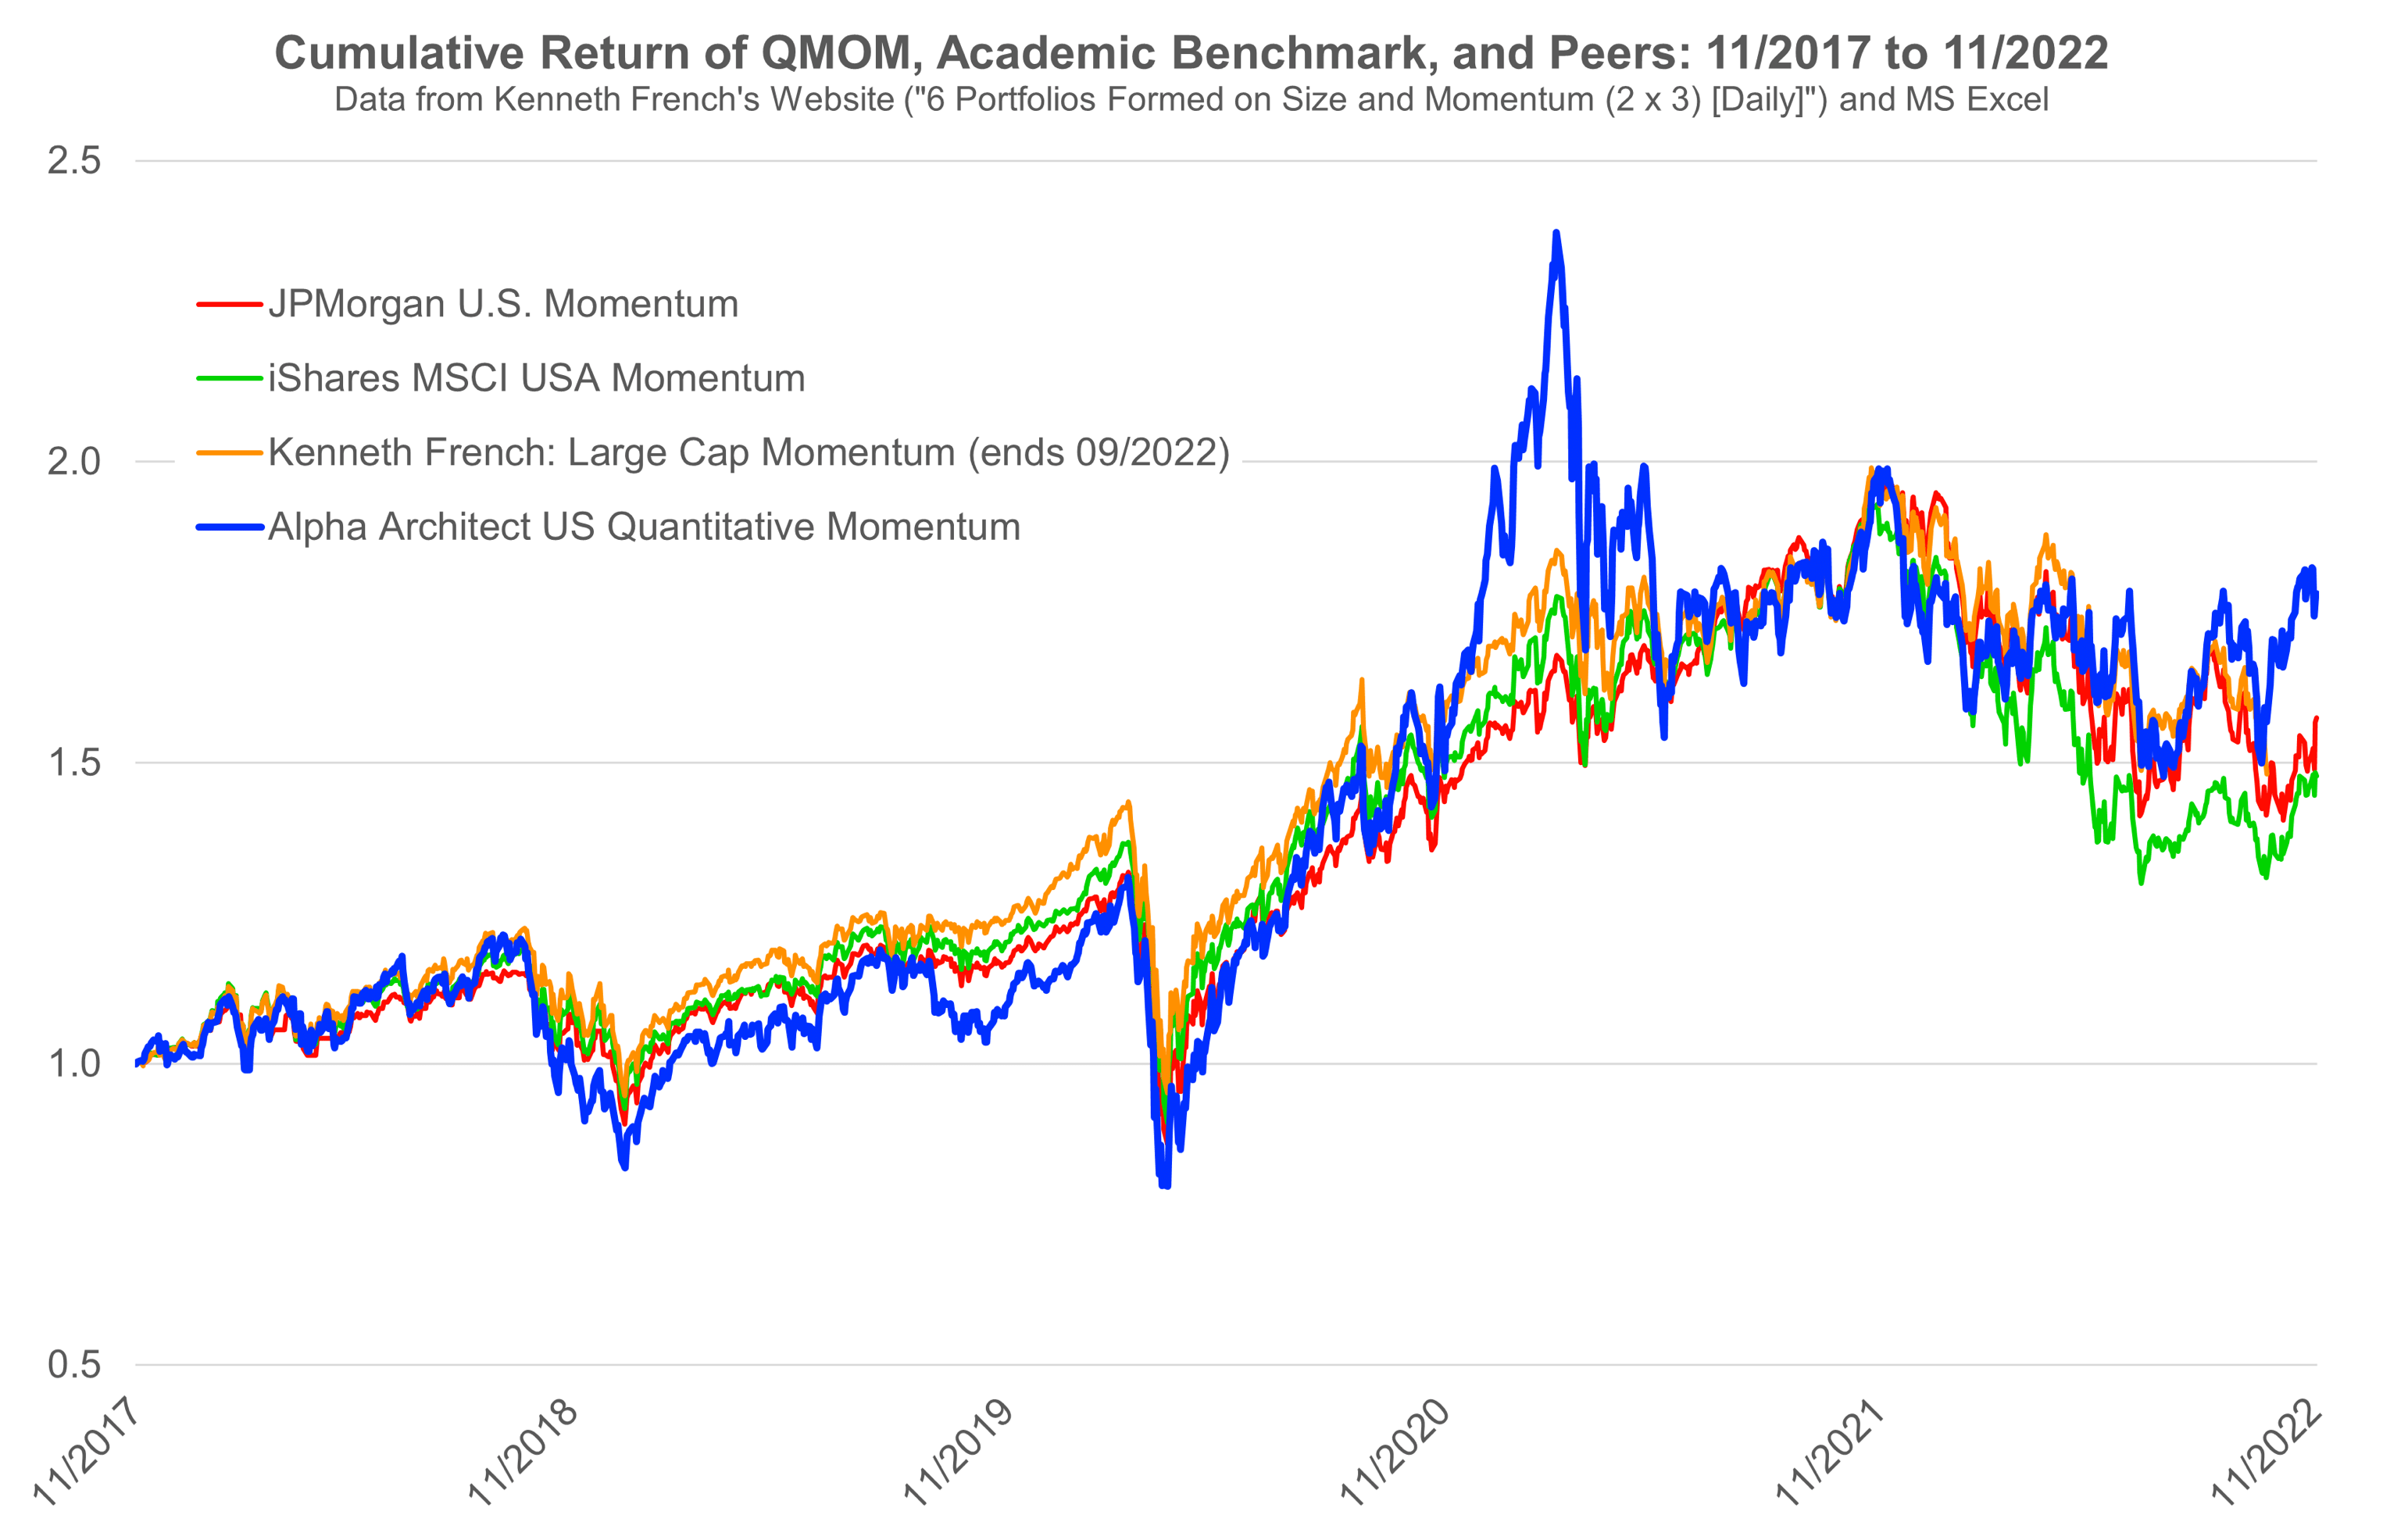
Before I come to the ETFs, let me first briefly comment on the academic benchmark. As we are looking at long-only momentum ETFs, the long-short momentum-factor is of course no fair comparison. I therefore used the returns of “large momentum” from Kenneth French’s website. This is a value-weighted portfolio of firms that are in the upper third with respect to momentum and in the upper half with respect to size. Everything else is official ETF prices delivered by the “Stock” API of Microsoft Excel.
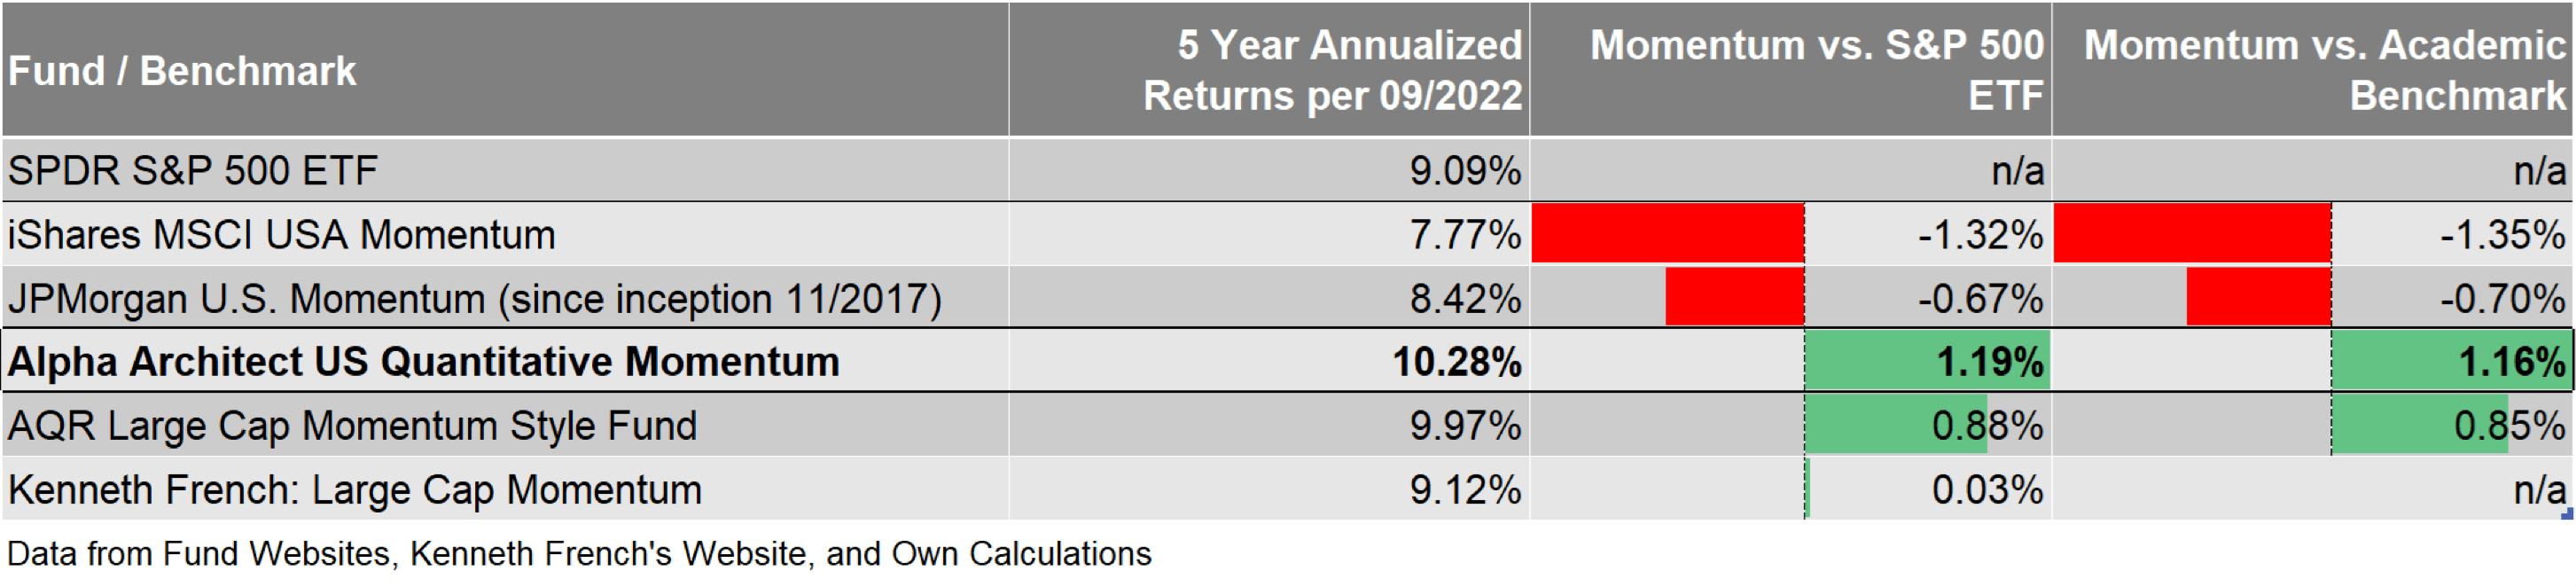
Both the chart and the statistics in the table show that the QMOM ETF is somewhat different than the rest. The ETF considerably underperformed its peers from 2018 until late 2020. After that, it apparently caught some of the meme-stocks and spiked in early 2021. Since then it performed roughly in-line with the peer-group and again started to outperform in 2022. For the 5 years ending at September 30, 2022, the QMOM ETF was the best fund of this little peer-group and beat the academic benchmark by 1.16%-points per year (see table). It also beat an ETF on the S&P 500 index by roughly the same amount.
Looking at the other ETFs in the table, there is considerable variation among momentum managers. As mentioned above, QMOM is comfortably ahead of the academic benchmark whereas MTUM trails it by about 1.35%-points (I may write about the reasons for that in a future article). That’s about a 2.5%-point spread between the relative performance of the best and worst. In my opinion, this is quite substantial. So let’s see where this difference comes from.
QMOM’s Implementation of Momentum
Alpha Architect, the manager of QMOM, is a well-respected and strongly research-oriented systematic asset manager. This comes with the advantage that that they are extremely transparent about what they do and I recommend everyone to take a look on their website. They outline their momentum methodology in a comprehensive white paper/blog post and in the following paragraph, I try to summarize the most important points. The figure provides an overview of the process.
Illustration from Alpha Architect (Alpha Architect)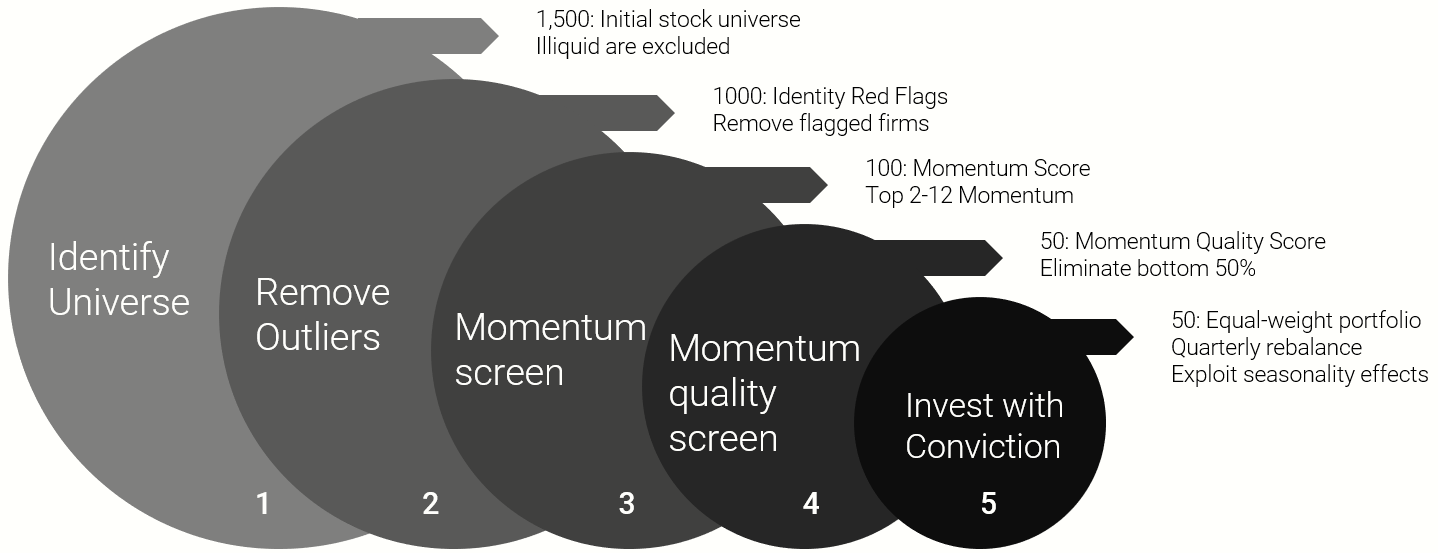
As the first step is self-explanatory, I directly jump to the second one. Alpha Architect runs several pre-filters to avoid very bad stocks in the final universe. For example, they remove the 10% of stocks with the highest betas. They also remove the respective 5% of stocks with the lowest 6- and 9-month returns to avoid contradictions with the final momentum signal in the next step. While it is true that high beta stocks tend to underperform (that’s the “Betting against Beta” anomaly), I don’t know why you want to consider that in a pure-momentum strategy.
Alpha Architect argues that they want to avoid bad stocks upfront and this is of course a valid argument. But on the other hand, you could also say that someone who invests in a pure-momentum fund should receive full-momentum exposure. No matter if high or low beta. In the end, it depends on each investor’s preference for herself. But by filtering high-beta stocks upfront, Alpha Architect essentially prioritizes the low-beta anomaly in their process.
In step 3 of the process, they obtain the 100 stocks with the highest 12-month momentum exposure. For that purpose, they follow the standard academic definition and exclude the most recent month (stocks tend to reverse over shorter time periods and momentum works best with intermediate returns of 6-12 months). There is not much more to say about this. That’s the well-researched definition of momentum and I think it makes sense to not re-invent the wheel at this point.
Steps 4 and 5 are in my opinion the differentiating features of the Alpha Architect momentum process. In step 4, they additionally measure the quality of momentum. The idea is relatively simple. Suppose you have two momentum-stocks with 12-month returns of 100%. The first stock compounded this 100% steadily over the year. The second stock, in contrast, first lost 50% and subsequently quadrupled to the 100% return. Which “momentum” is better? Most would argue for the first one. Remember that momentum tries to capture a trend and research shows that stocks with smoother paths to high 12-month returns tend to perform better (Da et al., 2014). Therefore, Alpha Architect considers the number of days with positive returns as second screen to again narrow the momentum selection to 50 names.
In step 5, they combine those 50 “quality-momentum” stocks into an equal-weighted portfolio and rebalance it quarterly (they also consider some seasonal effects). Note that this is very different from the portfolio construction of the other funds in the peer group. All of them are much more diversified (more than 100 stocks) and weighted by market capitalization. The QMOM ETF is therefore a much more active bet on momentum than the other funds and the academic benchmark. Alpha Architect is well aware of this and argues that by running such a concentrated, they want to deliver the purest possible momentum exposure.
The one thing that stands out at this investment process is research. Alpha Architect provides evidence and citations for every single detail of the investment process and I really admire that transparency and logic. It is therefore hard to criticize any of the steps because there are plausible arguments for each of them. So I can just say “good work”!
Conclusion
So what do we make out of all this analyses? First, I strongly believe that momentum is a useful strategy for all portfolios. The factor is extremely well-researched, there are plausible explanations, it survived decades of real-world implementation and still achieved outperformance after costs. I also believe that you don’t necessarily need to time a momentum strategy because when it is fast enough, it should adapt to changing market environments (as of October 31, 2022, the QMOM ETF returned 1.57% YTD, well-ahead of the -17% of the SPY ETF). So the question “momentum – yes or no?” is definitely a “yes”!
As this article is primarily about the QMOM ETF, the next question is of course whether the QMOM ETF is a good way to implement momentum? Maybe let’s start with the easy part. The QMOM ETF definitely delivered momentum-exposure in the past and performed roughly in-line with the academic benchmark and other momentum funds. This is a nice result and in-line with what we would expect from such a fund.
The next part, however, is more difficult. From all funds in my momentum-peer-group, QMOM is the most active strategy. That has been a good thing over the last 5 years and especially YTD because the process worked and the fund outperformed. However, like it did over 2018, this can of course also reverse in the future. Alpha Architect is very open with that and explains that a portfolio with such high tracking error will “bounce around the benchmark”. They also explain that they cannot outperform constantly but aim to win over the long-term. Once again, this is very transparent and fair communication.
In my opinion, the bottom line is the following: with QMOM you get a more sophisticated but also more risky implementation of momentum. If you don’t want to bear the risk that this differentiated process underperforms, you can also get a more diversified type of momentum from the MTUM ETF or other alternatives. That said, I personally believe that the Alpha Architect investment process is very well-researched and the QMOM ETF is definitely an interesting way to add some momentum to your portfolio.
Be the first to comment