

liorpt
Note: This report was originally published on Value Investor’s Edge on September 20, 2022.
Overview
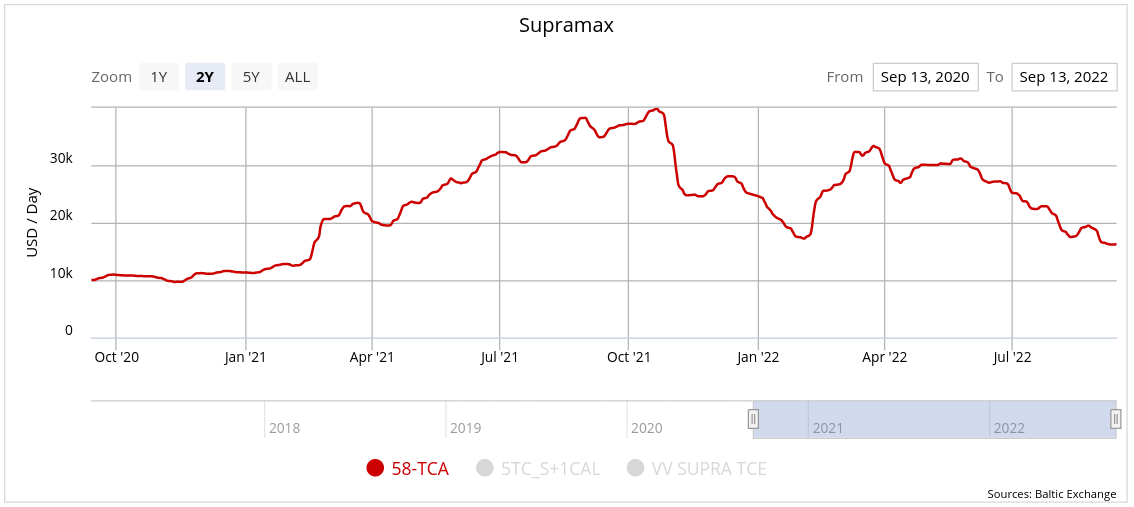
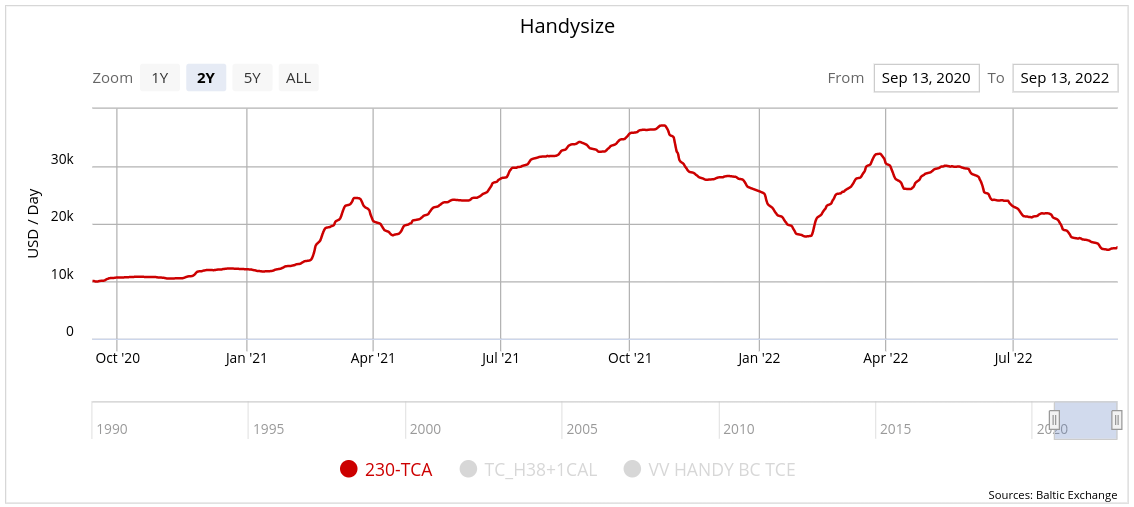
For the first half of 2022 the dry bulk market was mimicking a very positive 2021. However, it was around the end of May, when numerous bearish factors began creeping into the picture.
Clarksons SIN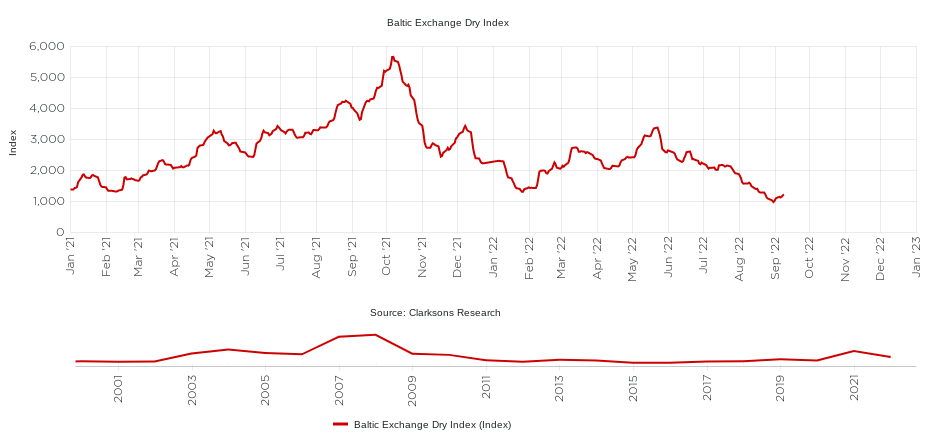
Source: Clarksons SIN
As a result, stock prices have dropped and spot rates are half what they were this time last year for midsize and small bulkers, while capesize rates have fallen by 88%.
While all this sounds horrific, it seems like a good time to put the current market into proper context while discussing longer term expectations. We’ll accomplish this by sorting out structural market trends from short term shifts.
Sustainable Vs. Unsustainable
The terms sustainable and unsustainable are used in my dry bulk analysis more than any other segment. Let’s clarify how they are used. Sustainable refers to a structurally supported market shift associated with a longer-term market trend. Unsustainable refers to a short-term market shock which is not supported by any long-term based market structure – and if strong enough often results in a deviation from existing market structure.
Traders would be interested in these unsustainable factors as they result in market opportunities. Investors might use them as entry or exit points based on long-term convictions. Both would also be interested in what composes the sustainable side of the equation, as that provides insight regarding the baseline from which to execute these decisions.
We’ll start with a supply side analysis, which would be categorized a sustainable and extremely influential market trend over an extended period. This will be followed by a demand side analysis where there are numerous issues which present varying degrees of unsustainable deviations from traditional market activity.
Supply
The time needed to construct a dry bulk vessel, typically between 14 months and two years depending on the size, provides quite a bit of transparency on the supply side.
These construction times must now take into account a shortage of yard space for which to build these vessels, especially the capesize and larger classes.
This situation has provided us with one of the highest degrees of forward clarity ever afforded to the market – and it is bullish.
The current dry bulk orderbook stands at just 7.1% in terms of capacity, well below the level needed to account for historical growth averages coupled with vessel retirements.
But as this thin orderbook plays out with its anticipated positive impact, we will also see two environmental mandates unfold; the EEXI and the CII. The EEXI presents an immediate impact, while the CII continuously challenges the market with ever tightening criteria, with the well-known intention of phasing out older vessels.
Before we get to that, let’s review some trends on the supply side which continue to favor that tightening market ahead.
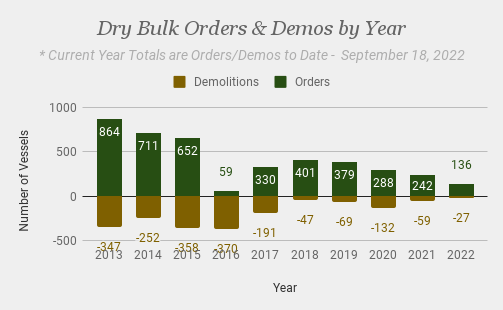
Newbuild orders have remained extremely subdued throughout the year with just 12 capesize contracts inked and 136 across the entire segment.
Value Investor’s Edge Value Investor’s Edge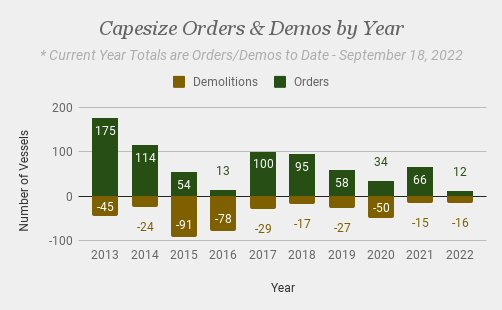
Source: Data Courtesy of VesselsValue – Chart by VIE
For the dry bulk market as a whole, this represents the second slowest pace of orders in two decades.
The most recent orders have found their way into 2025 and even 2026 delivery slots, illustrating the challenge owners face for a timely delivery if they were to order today.
Value Investor’s Edge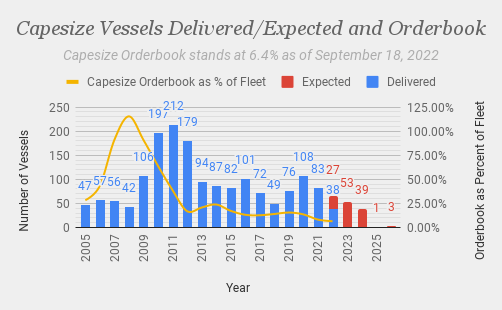
Source: Data Courtesy of VesselsValue – Chart by VIE
This tight yard space situation is also impacting the medium size ultramaxes, which have witnessed 8 out of the 9 most recent orders fall into 2025 slots as well. It’s noteworthy that the last two handy orders (handys are just 37k dwt, compared to 65k dwt ultras, and 180k dwt capes) have also been relegated to 2025 delivery dates.
In terms of broad trends, there appears to be a rapid progression forward regarding promised completion dates for newbuilds. It was April 1 of 2022 when the last 2023 delivery date was handed out for a dry bulk vessel. From that point on we witnessed 2024 completion dates dominate the market. It was July of 2022 when we first began seeing 2025 completion dates emerge indicating that 2024 was running tight on space. In August and September, we saw 2024 completion dates slip significantly, with 2025 emerging as the most popular year for promised completions, with 2026 coming in second place.
The result is that the combined two-year period of 2023 and 2024 is poised to bring the slowest pace of newbuild launches in 15 years.
Value Investor’s Edge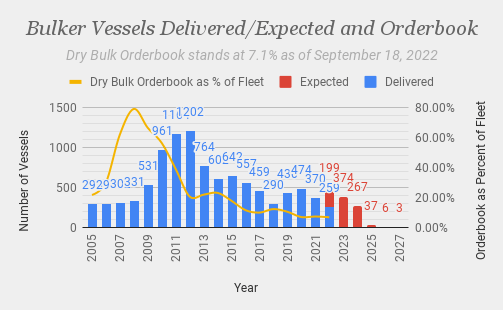
Source: Data Courtesy of VesselsValue – Chart by VIE
On a brief side note, there were a very high number of deliveries between the beginning of July and mid-September. As seen in my Q2 Charts & Commentary report, published on July 6, there were just 101 bulker deliveries up to that point. A total 158 deliveries have occurred since that time, representing roughly one-third of the 2022’s expected deliveries. This means 33% of the fleet was launched over a period representing about 20% of the year. This could have also been a contributing factor to the rate downturn experienced over that same period – with this factor now waning in intensity and set to become a tailwind.
Getting back on track, the slow pace of newbuilds and the age of the existing fleet will have varying impacts across classes. Below we see the panamax orderbook stands at 8.9% with reasonably spaced-out deliveries.
Value Investor’s Edge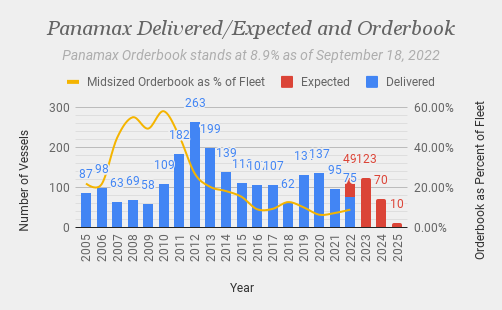
Source: Data Courtesy of VesselsValue – Chart by VIE
However, in the next chart we see that bulkers over 20 years of age represent nearly 15% of the fleet.
Value Investor’s Edge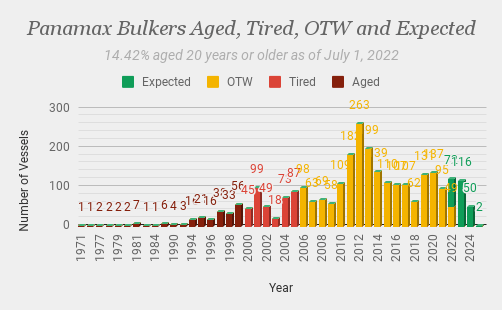
Source: Data Courtesy of VesselsValue – Chart by VIE
A similar scenario also applies to the smaller handy classes.
This in itself would be considered a bullish premise based on the aforementioned need for replacement tonnage and to account for traditional CAGR figures. However, now we must add in the EEXI.
For the EEXI, we are not only concerned with the number of vessels which are compliant vs. non-compliant, but we are also interested in the compliance gap, which represents the magnitude or degree of non-compliance and how much a vessel must adjust to again become compliant.
Simpson Spence Young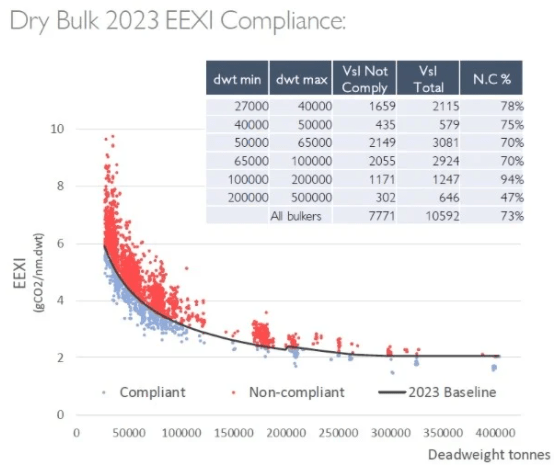
Source: Simpson Spence Young
The EEXI will impact roughly 73% of the global bulker fleet with the capesize class firmly in the crosshairs along with many of those older smaller vessels which suffer from significant compliance gaps and will therefore find it difficult to achieve compliance in an economically efficient manner, or at all.
This bulker fleet will further be challenged by the CII, where a significant number need to see their ratings improve if they are to continue sailing after the grace period for corrective measures, especially in the capesize class, which due to its size represents about 39% of bulker cargo capacity.
BIMCO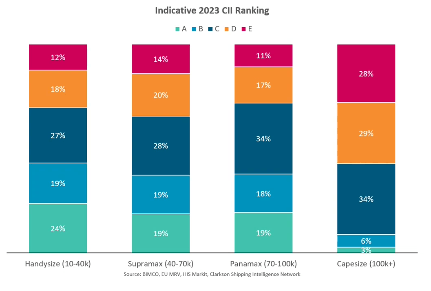
Source: BIMCO
While the EEXI is a one-time corrective measure, the CII will compel owners to follow increasing stringent guidelines which are adjusted annually. The chart above will undoubtedly change as some vessels see ratings improve as they comply with the EEXI.
Therefore, let’s just focus on the impact of the EEXI where there appears to be broad consensus that the implementation of this mandate will result in an approximate negative 3%-4% supply side shift, with my own (conservative) estimate at -2.68%, which takes into account expected demolitions and speed changes while adding in net vessel growth. This -2.68% should be balanced against demand side expectations for 2023.
Demand
Disruptions on the demand side have been unequal in their impact across the fleet, with the capesize class finding itself squarely in the cross hairs of unfortunate events, which is reflected in spot rates.
VesselsValue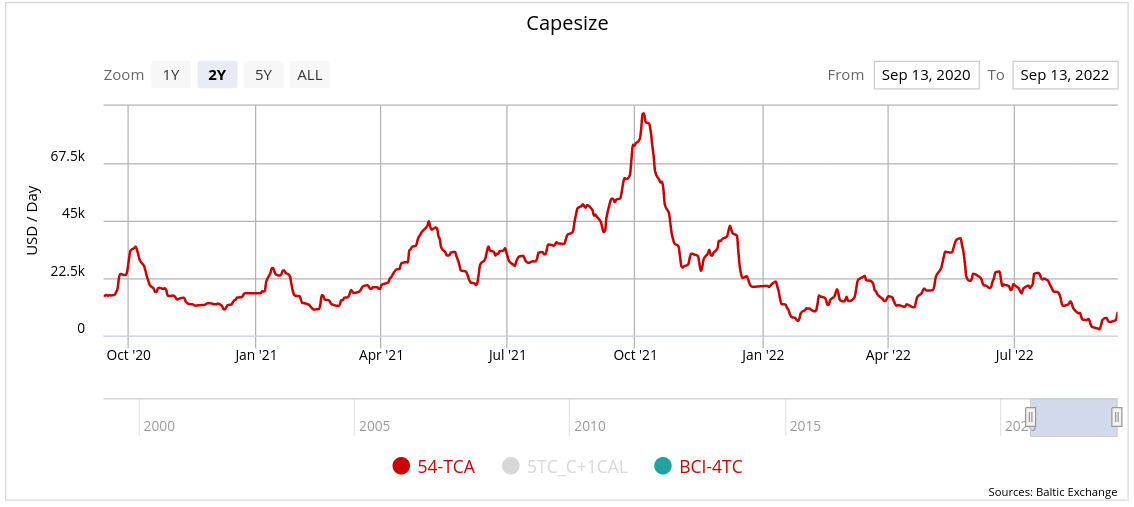
Source: VesselsValue
Meanwhile, the mid to smaller classes haven’t suffered nearly as much, though they are feeling the impacts of certain events as well.
VesselsValue VesselsValue VesselsValue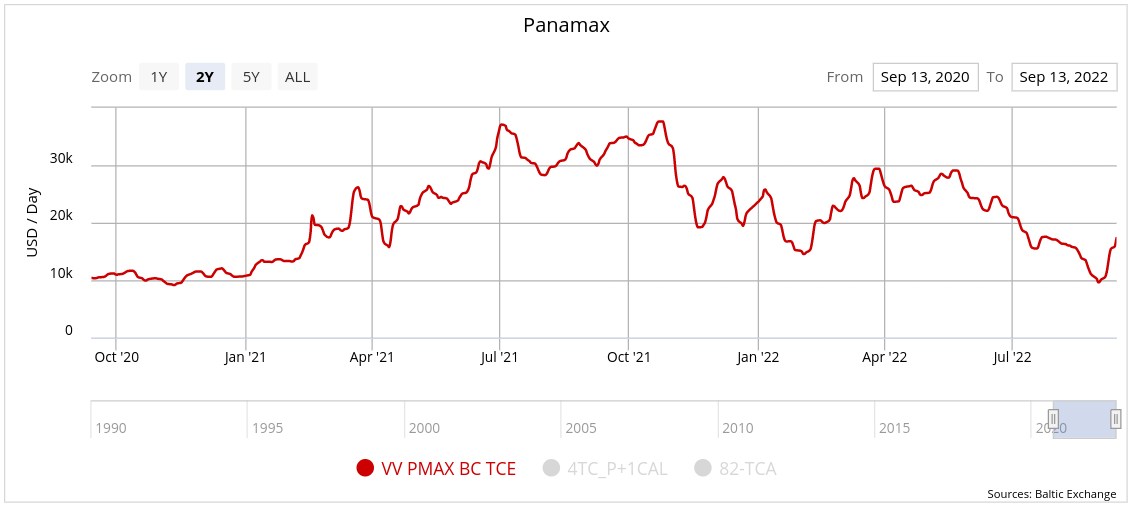
Source: VesselsValue
May proved to be a pivotal point for the dry bulk market. This was because China, which is the single largest source of demand for dry bulk, experienced a covid outbreak starting in April which resulted in an unusually high mortality rate, causing authorities to implement very strict measures.
These ‘zero covid’ designed policy measures curtailed economic activity impacting the demand for dry bulk by interrupting steel production and disrupting demand for that product. Iron ore demand, and consequently demand for capesize vessels, took a major hit.
As this situation was finding a slow resolution, another issue crept into the picture for China; a tightening global energy market. This was complicated by their own domestic energy issues as hydroelectric power generation waned due to severe drought. Those energy intensive industries, which were allowed to continue some degree of production, saw margins shrink, which naturally led those market participants to curtail production even more. Again, this was reflected in iron ore and capesize vessel demand.
Finally, consider China’s own real estate backdrop around this time, where home buyers in at least 80 cities threatened to halt making mortgage payments as liquidity problems or covid restrictions slowed or even endangered projects, which further added to concerns about a fading property market.
Not only was iron ore demand hit by this, but complementary minor bulks also took a correlated demand hit, which consequently impacted demand for mid to small bulk carriers.
But that wasn’t the only issue for these small to midsize vessels. While one area of their diverse cargo base was taking a China related hit, other areas were seeing geopolitical and economic factors influence demand for specific cargoes.
Coal
The Russia/Ukraine war not only shifted trading patterns for natural gas, but consequently coal. Many nations once dependent on Russia’s gas exports soon found themselves either cut off or imposing sanctions, both of which required substitutions.
From 2017-2021 Europe cut coal imports by approximately 40m tons, or about 38%. However, that trend was broken in 2022, as the Russian gas they were utilizing to wean themselves off coal was largely removed from the equation.
This caused January-August 2022 imports to jump by 35.5% YoY, with many of these new supplies coming from long haul origins, such as Colombia, S. Africa, and Australia.
Reuters – Kpler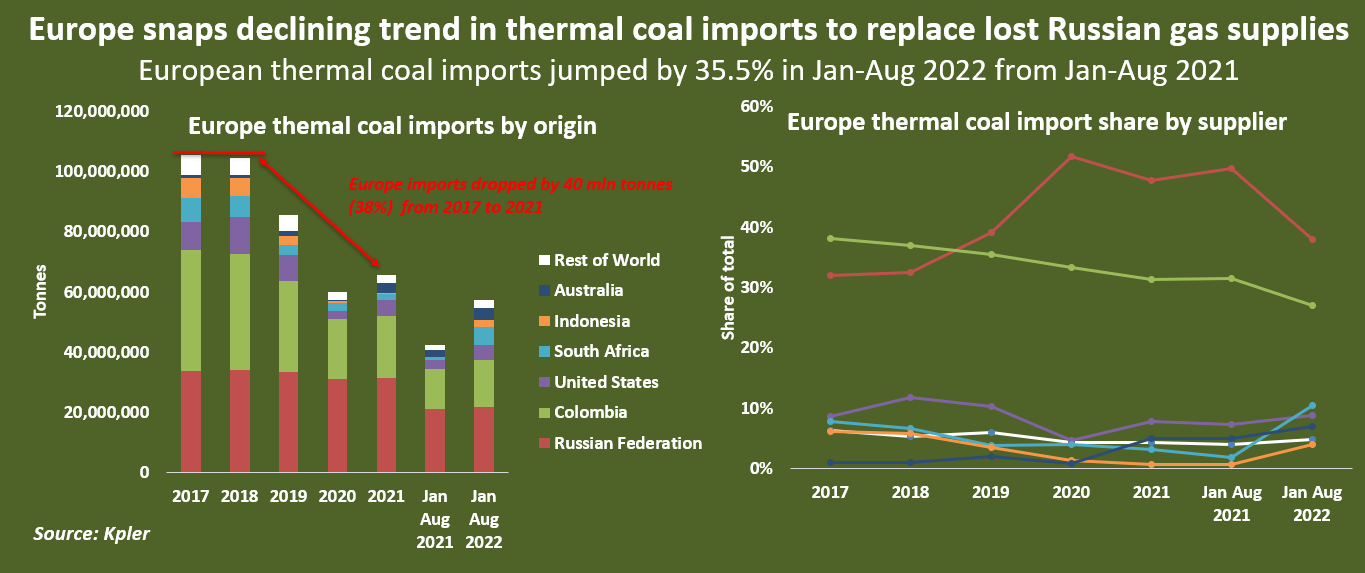
Source: Reuters – Kpler
Even the US would be considered a longer haul than the Russia to Europe cargoes which originated in the Black Sea.
From January through August of 2022, total cargo volumes carried on these midsize and small bulkers into West and Northwest Europe increased by 19%, YoY, while total cargo mile demand grew by nearly 21%.
Meanwhile, Russia’s largest Asian customers are all adopting different strategies.
Reuters – Kpler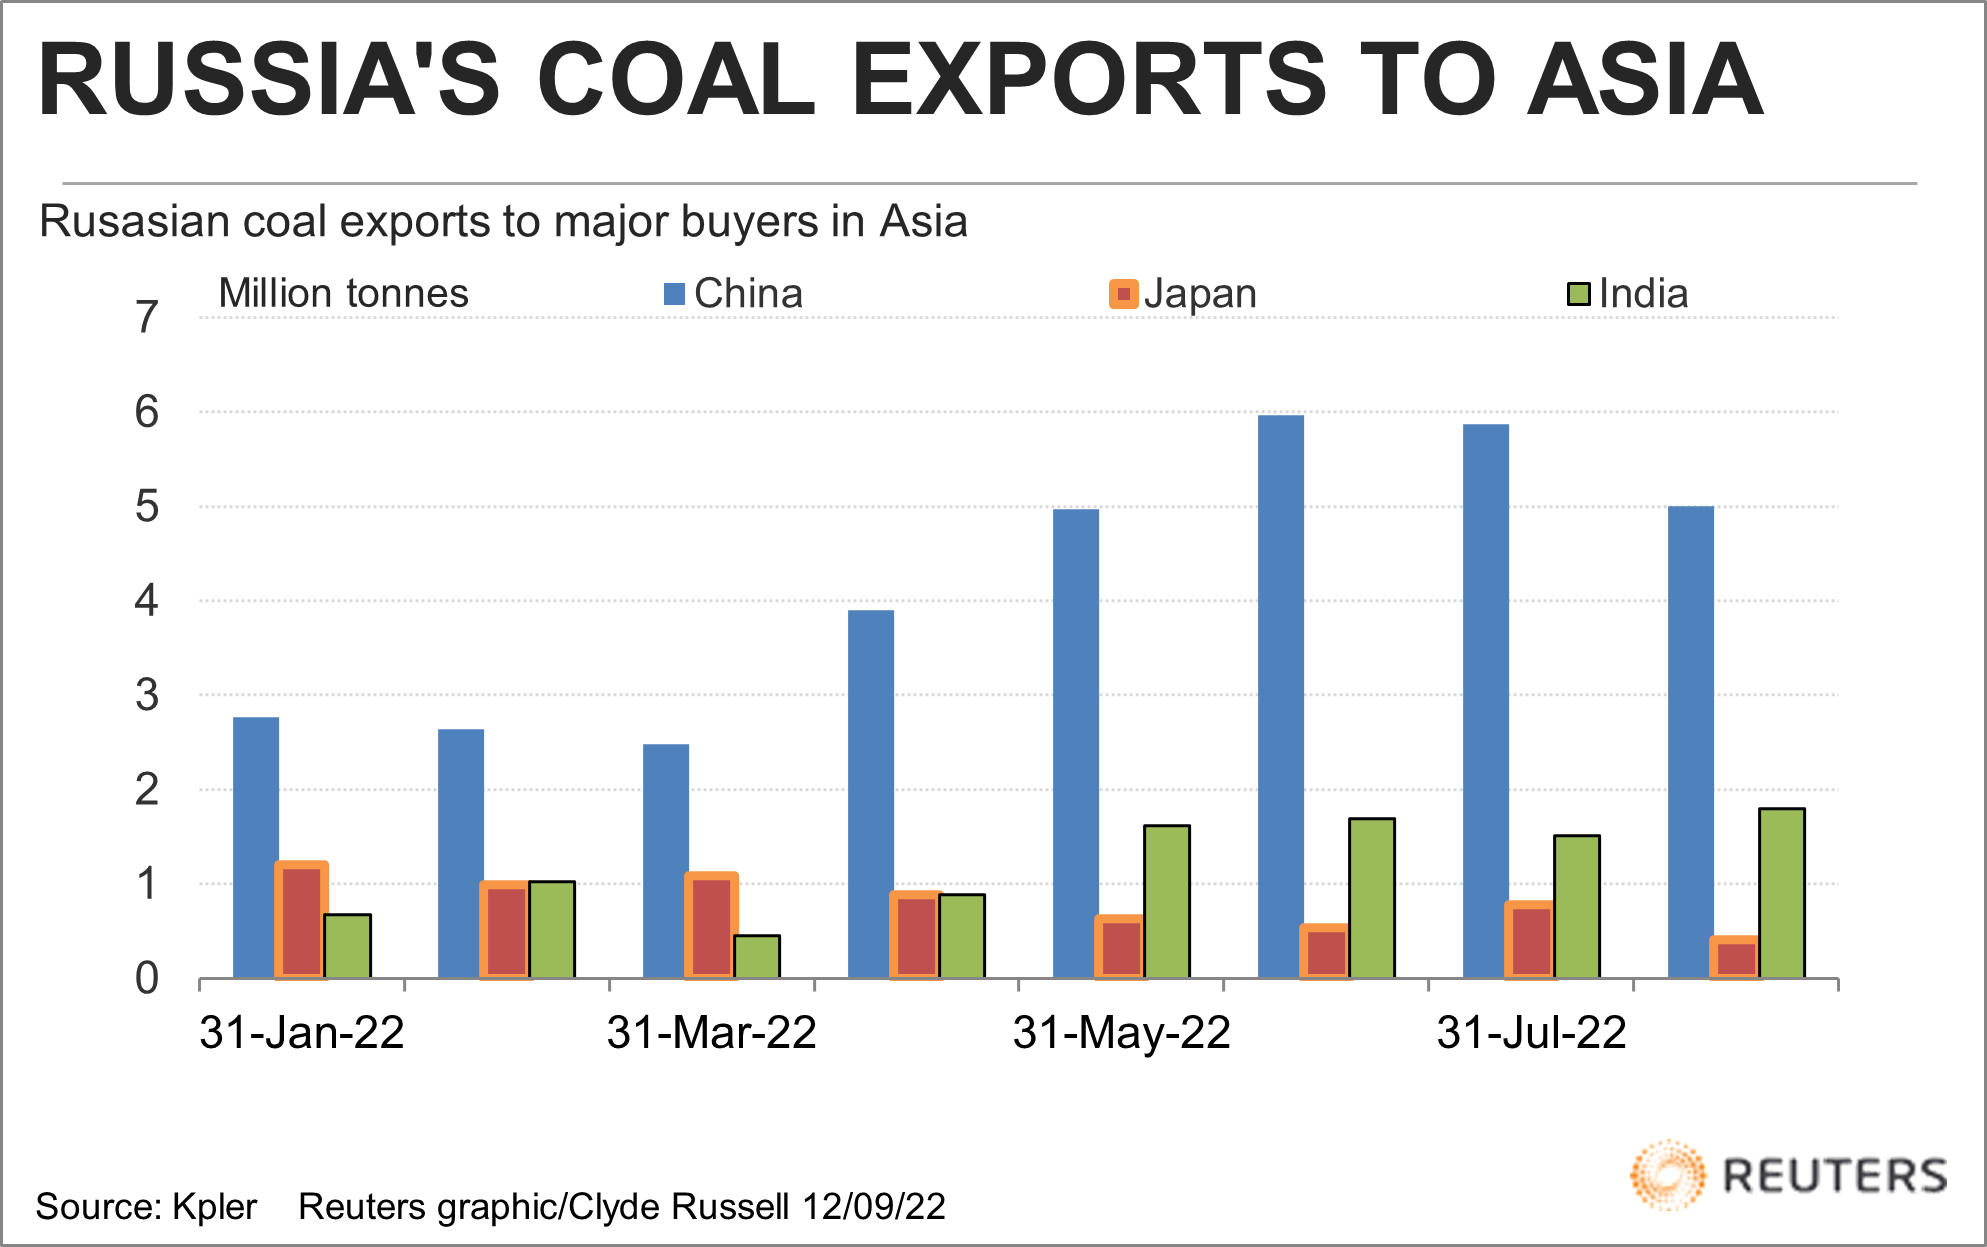
Source: Reuters – Kpler
Japan is the world’s third-largest coal importer and Russia was the second-largest thermal coal supplier and third-largest coking coal supplier to Japan in 2021, sending 12% and 8% of the country’s total thermal coal and coking coal imports.
Following Russia’s invasion of Ukraine, Japan adopted a phasing out strategy to replace Russian coal through alternative sources from Australia, Indonesia and Vietnam.
This shift had a very negligible impact on overall cargo volumes being imported into Japan on midsize and small bulkers (ex. capesize & post-panamax), with January-August of 2022 growing by 1.3% YoY. However, it registered a significant gain in cargo mile demand for those same imports, up 7.2% YoY.
As the price of coal has soared, some nations which have significantly lower per capita income and are therefore far more sensitive to global energy price movements don’t have the luxury to seek out the most politically correct commodity at a higher price.
Bloomberg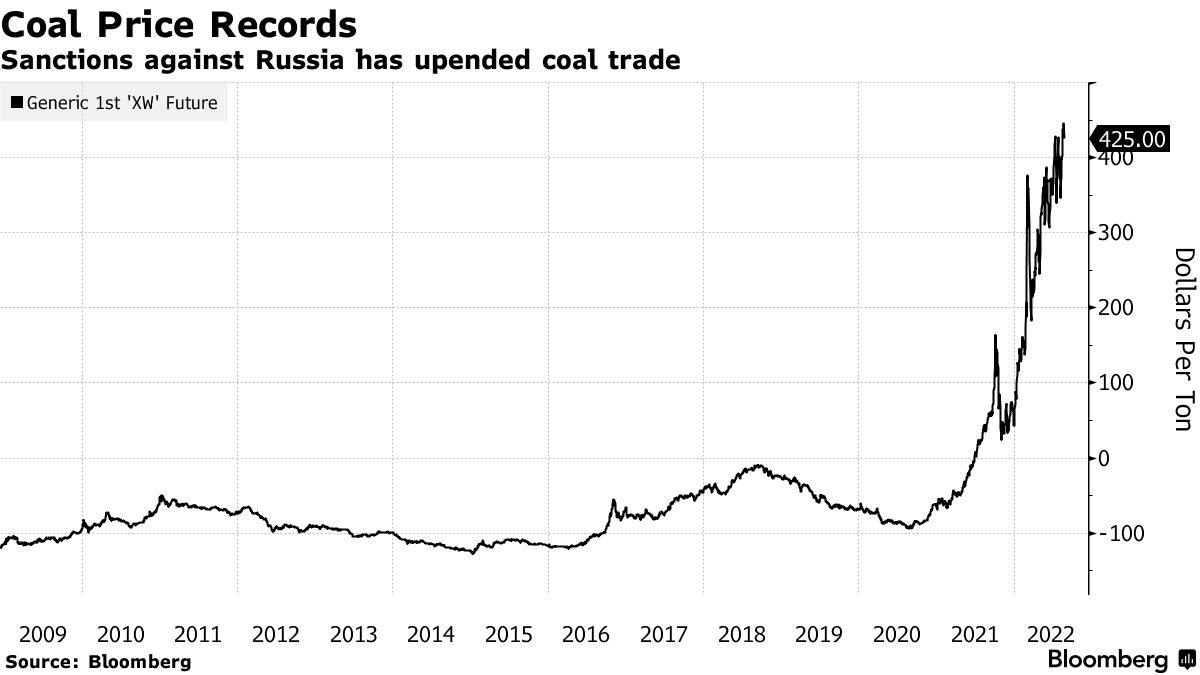
Source: Bloomberg
India has followed that more price sensitive approach, opportunistically snatching up additional Russian cargoes at discounted pricing.
For India, overall cargo volumes imported on midsize and small bulk carriers are up approximately 17% YoY (Jan-Aug) while cargo miles traveled into the subcontinent are up 14%.
We now have enough info to understand an interesting triangulation trade shift. As Europe shunned Russian cargoes it used Australia as a substitute. As Europe bid up Australian coal, less flowed into India. Those discounted Russian coal cargoes soon found customers in India to replace the Australian cargoes. This resulted in what should be medium-term trade flow shift which has a beneficial impact on cargo mile demand, with the potential to be sustainable over the longer run.
Unfortunately, we must now take China’s role into account (recall that China accounts for approximately 35% of global cargo demand) and this is where all those positive impacts listed above, have been swiftly negated.
Looking back at the chart showing Russian coal flows into China, it’s important to draw a distinction between seaborne and land-based cargoes. Nearly all of China’s increasing coal trade with Russia is being conducted over land. However, it’s noteworthy that July and August saw talk emerge of capacity constraints on the rail system. Furthermore, China has been importing more coal cargoes from neighboring Mongolia, again, by land. Finally, China is seeing a notable increase in their own domestic coal production as high prices are inspiring swing output.
Now, compound this with China’s slowing/challenging economic backdrop (touched on earlier) along with the Government’s known price sensitivity regarding commodities and the negative impact on imports.
Looking at January through August imports into China, this has resulted in small and midsize bulkers seeing a cargo volume decline of 12.5%, YoY, with a drop in cargo miles of 19.1%.
The lack of Chinese demand is absolutely the main culprit in this latest dry bulk downturn and as such many are asking about when the next stimulus may be unveiled.
I’ve held the position that major stimulus on the part of China will likely be put off until the global economy is nearing or on the other side of this latest slowdown; as that would present the greatest potential return on investment. This suggests some time must pass as factors contributing to this latest round of economic uncertainty must first be arrested. However, this also highlights expectations regarding the temporary nature of this downturn in Chinese dry bulk demand.
Grains
While this discussion centered around coal, it’s noteworthy that shifts in seaborne agriculture (wheat, corn, rice, etc.) have also contributed to the trade pattern changes as grain shipments out of Ukraine have stalled. An above average harvest in both Europe and Russia provided some relief, while Brazil had ample supplies available to shore up the gap. But let’s recall the extremely high, prohibitive for some, agriculture prices which also weighed on demand.
Bloomberg – AFP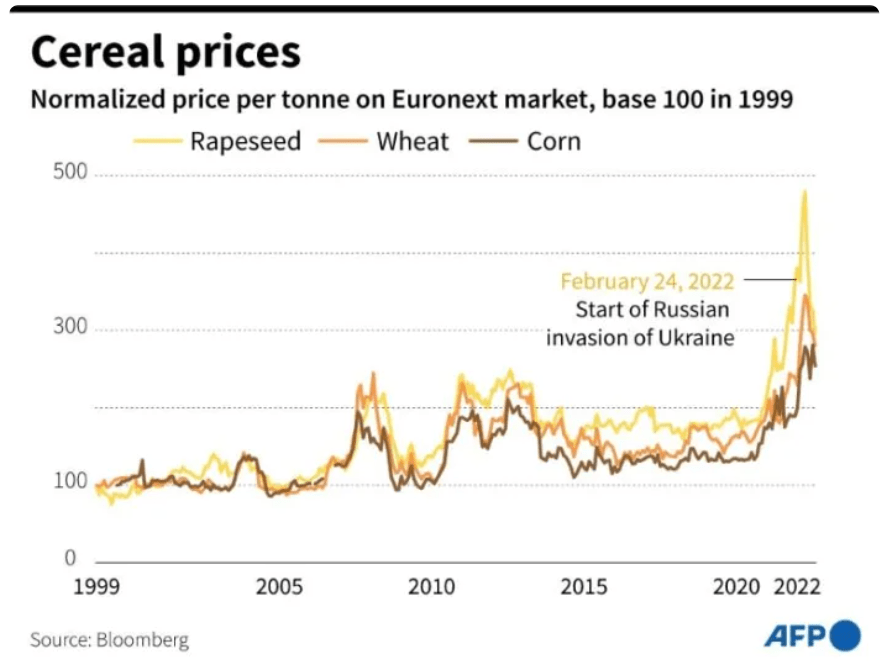
Source: Bloomberg – AFP
Therefore, we witnessed some trade pattern shifts as substitutes were available, but we also lost midsize bulk demand due to high prices linked to cargoes now in storage at Ukrainian ports. The trade-off does not favor the bull or bear case to a measurable degree.
Let’s unpack that last statement just a bit since the market did register a gain in rates at the onset of the conflict based on this shifting grain trade dynamic. In the initial stages of any geopolitical or economic shock, we can see a vessel dislocation phase. In this case, vessels which normally loaded in Ukraine were displaced. Other substitute routes emerged, some half-way across the world, at a faster rate than ships could sail there. Therefore, there was vessel dislocation, a gap between where cargoes were set to be picked up and the number of vessels which could get there in a timely manner. This drove up rates. As substitute trading patterns become established that dislocation lessens. Here, we see the true picture of the new market dynamic emerge, and while the data shows some shifts, the impacts are minimal.
This situation may be of a more temporary nature if the deal for a safe passage corridor in the Black Sea fully comes to fruition. If that does occur, we can expect a slow destocking of Ukrainian grain currently in storage. It’s expected to be slow due to the difficulties and uncertainties for vessels to traverse mine laden waters into a port of war; the safety of which is only guaranteed by Russia’s word. Nevertheless, it would prove to be beneficial to bulker demand as well as the global economy if we see a desperately needed 8-10 mt of grain hit the market to ease food shortage and inflation concerns.
Capesize Demand
As many know, capesize demand is tied largely to iron ore demand, a key component for steel making. With approximately half of the world’s steel output attributed to China, and a great deal of steel demand stemming from their real estate construction market, China’s future economic prospects become a central focus for this class.
On a side note, major steel producers in Europe are now facing extraordinarily high energy prices. This cost impacts margins (higher end prices are more difficult to be passed on to the consumer during times of slackening demand), which has a direct impact on output – with poor margins often leading to curtailed output. Obviously, this is impacting demand for iron ore in Europe, which is another key destination.
There are legitimate short to medium-run concerns for the Chinese economy, confirmed by key data: New property starting construction in July was down 45% YoY. Steel output in China fell 6% YoY to 81.4mt in July, as downstream demand was slowing. Chinese industrial production grew by just 3.8% YoY in July, well below the 5-year average of over 6%.
All this will likely propel iron ore imports into slightly negative territory for 2022, coming in against an expected gross capacity increase for capesize vessels of 2.6%.
This should be taken for exactly what it is and will likely be, a slowdown in capesize demand at least through H1 of 2023.
However, this again must be balanced against supply side expectations where expected net fleet growth in this class will be minimal and speed reductions will be implemented for a vast majority of the larger bulk vessels. Recall from earlier, 94% of the 100k dwt to 200k dwt vessels are currently non-compliant, with full realization of engine power and shaft power limitations being the expected primary method of compliance. This could curtail supply by as much as 4% for the capesize class at the onset of 2023.
Finally, consider that expectations for H2 of 2023 include far more control over inflationary impacts, central banks backing off, and measurable stimulus allowed to be introduced once again without fear of influencing that inflationary narrative to a concerning degree. Again, as mentioned earlier, this is ideally where nations, including China, would cautiously want to put any stimulative efforts into action as their impacts would not be dulled by the influence of central banks or global economic headwinds.
Congestion
While cargo mile demand for the dry bulk class has remained largely flat when compared to 2021, vessels waiting outside of ports during the first half of 2022 had grown as a result of port congestion.
BIMCO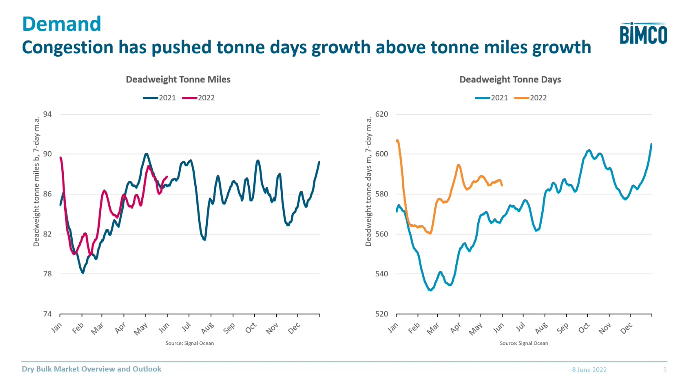
Source: BIMCO
This was another contributor to the upswing in rates witnessed during that same time period. However, it would stand to reason that any unwinding of that congestion would have the opposite impact.
Indeed, that was the case. Around the beginning of May, not coincidentally when rates began to slip, the market at large began experiencing port decongestion, freeing up tonnage and reducing waiting time.
Clarksons SIN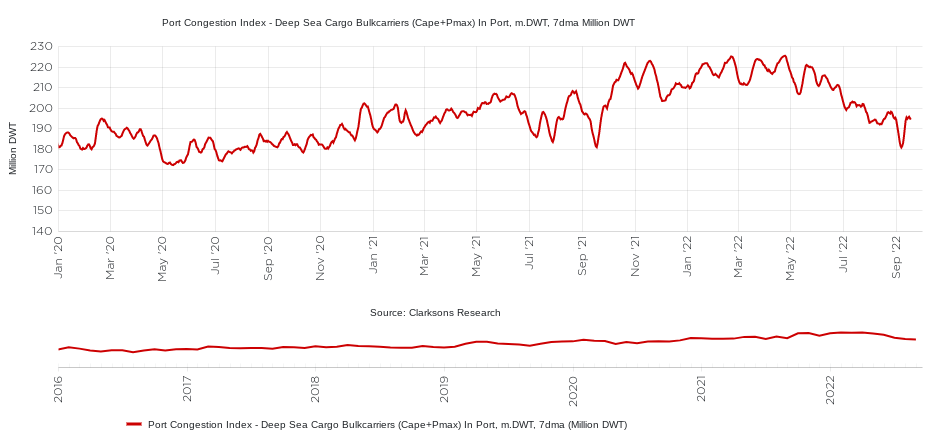
Source: Clarksons SIN
This sharp decline is likely approaching its end, as we near pre-pandemic levels, suggesting the market has normalized and the damage has been done. But as China maintains its zero covid stance, the possibility of another bout of port congestion remains.
Conclusion
Last year around this time, the dry bulk market was beginning to feel the impact of several bullish factors, that were identified as unsustainable, which propelled the BDI to multi-year highs. Currently, we are facing a different situation, where departures from traditional economic activity are pushing the BDI to uncomfortable lows.
Throughout all this, the turbulent ups and downs of the dry bulk market, it’s important to maintain perspective. Here, that perspective comes in the form of a 10-year, 2.2% CAGR, for the dry bulk segment.
Significant and sudden deviations often do not represent long-term sustainable shifts, especially for the demand side which can be influenced by a variety of short-term factors and shocks.
Lately we have witnessed several of those deviations, such as a high degree of vessel deliveries over a short period, easing of Chinese port congestion, prohibitive energy prices for manufacturing/industry, stockpiled grains unable to reach markets due to war, and many more. Unfortunately, the positive impact of coal demand was largely negated due to China’s economy and shifting import transport preferences (though those land-based options are now maximized leaving seaborne coal imports as the more likely route moving forward).
Nevertheless, this means we have many positive catalysts on the horizon, Ukrainian grain exports restarting, European coal demand likely to firm into winter, and potential improvements in China in the back half of 2023.
This should all be coupled with the very bullish supply side outlook which extends several years out. That bullish supply side outlook is further complimented by the EEXI and CII which will likely bring forward some vessel retirements and slow the speed of others.
Though cargo mile demand for dry bulk is down 0.34%, YoY, with clear risks and uncertainty remaining with regard to economic headwinds, geopolitical turmoil, and commodity pricing, it would not be a surprise to see improvements in dry bulk as we head toward the end of the year; due to the waning impacts of some of these short term negative unsustainable factors combined with seasonal strength.
Next up, we will look for the EEXI and global economic stabilization and consequent recovery to contribute to what has been, and will continue to be, a structurally firming market, likely through 2024 and beyond.
Any short run deviations (dips or rips) from this slowly improving market over the long run could therefore be viewed as opportune moments to trade, invest or divest accordingly.
Be the first to comment