

Warchi
A Quick Take On PTC
PTC (NASDAQ:PTC) reported its FQ3 2022 financial results on July 27, 2022, missing expected revenue and EPS estimates.
The company provides a range of software for product design and lifecycle management.
Given macroeconomic uncertainties and the stock’s currently potentially rich valuation, I’m on Hold for PTC in the near term.
PTC Overview
Boston, Massachusetts-based PTC was founded in 1985 and has developed a family of CAD/CAM and product lifecycle management software for organizations worldwide.
The firm is headed by president and Chief Executive Officer Jim Heppelmann, who was previously cofounder at Windchill Technology which was acquired by PTC in 1998 and prior to that was CTO at Metaphase Technology.
The company’s primary offering applications include:
-
CAD/CAM/CAE software
-
Augmented reality
-
PLM
-
Industrial IoT
The firm acquires customers through its direct sales and marketing efforts, as well as through partner referrals.
PTC’s Market & Competition
According to a 2022 market research report by Grand View Research, the global market for product lifecycle management [PLM] was an estimated $26.9 billion in 2021 and is forecast to reach $56.4 billion by 2030.
This represents a forecast CAGR of 8.6% from 2022 to 2030.
The main drivers for this expected growth are growing demand for cloud-based PLM solutions in a secure IT infrastructure and increased focus by customers on developing ‘smart’ products and factories.
Also, the U.S. PLM market history and projected future growth trajectory is shown below:
U.S. PLM Market (Grand View Research)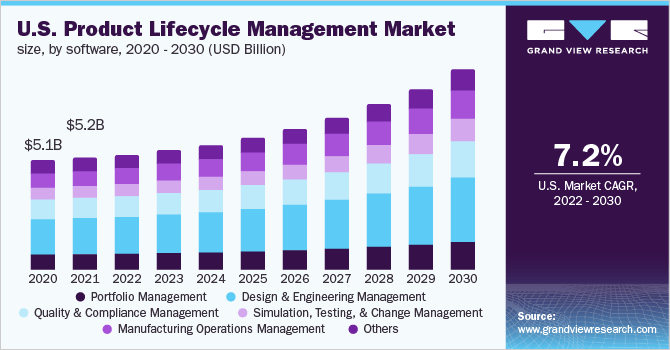
Major competitive or other industry participants include:
-
Aras Corporation
-
Arena Solutions
-
Oracle Corporation (ORCL)
-
SAP SE (SAP)
-
Autodesk (ADSK)
-
Siemens AG (OTCPK:SIEGY)
The company also has offerings in the CAD/CAM and Industrial Internet of Things markets, both of which are large and growing global markets.
PTC’s Recent Financial Performance
-
Total revenue by quarter has risen according to the following chart:
9 Quarter Total Revenue (Seeking Alpha)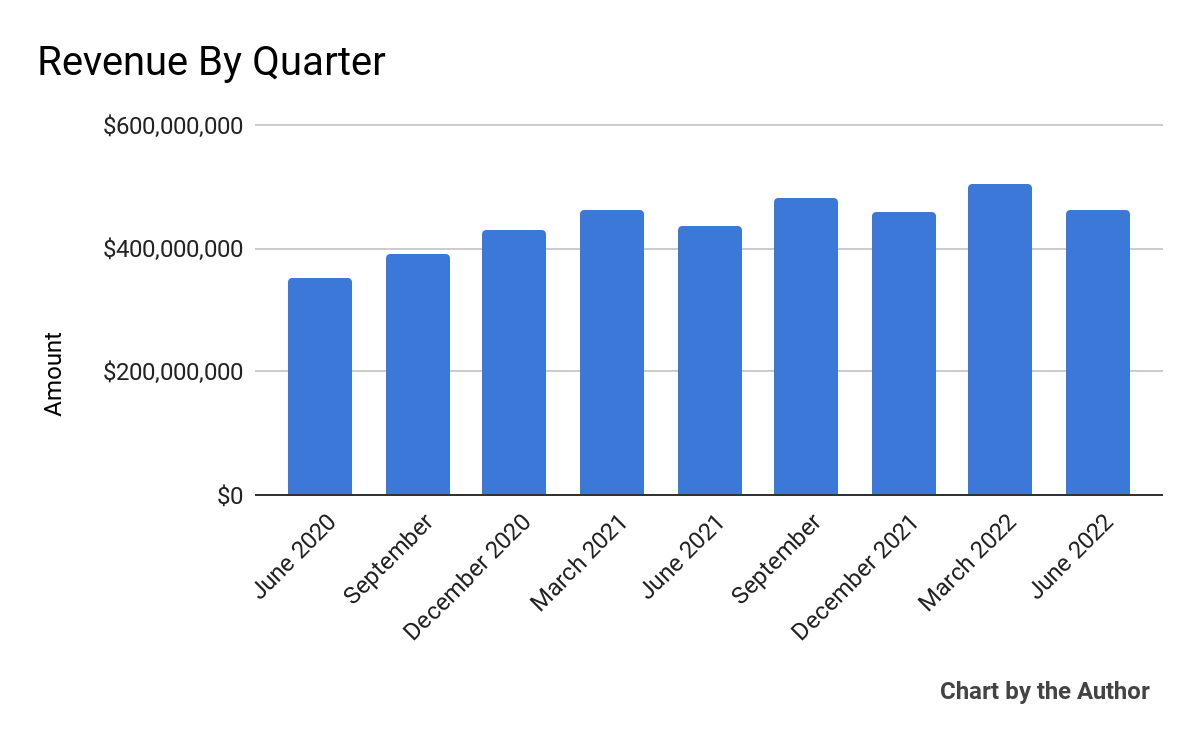
-
Gross profit by quarter has followed approximately the same trajectory as total revenue:
9 Quarter Gross Profit (Seeking Alpha)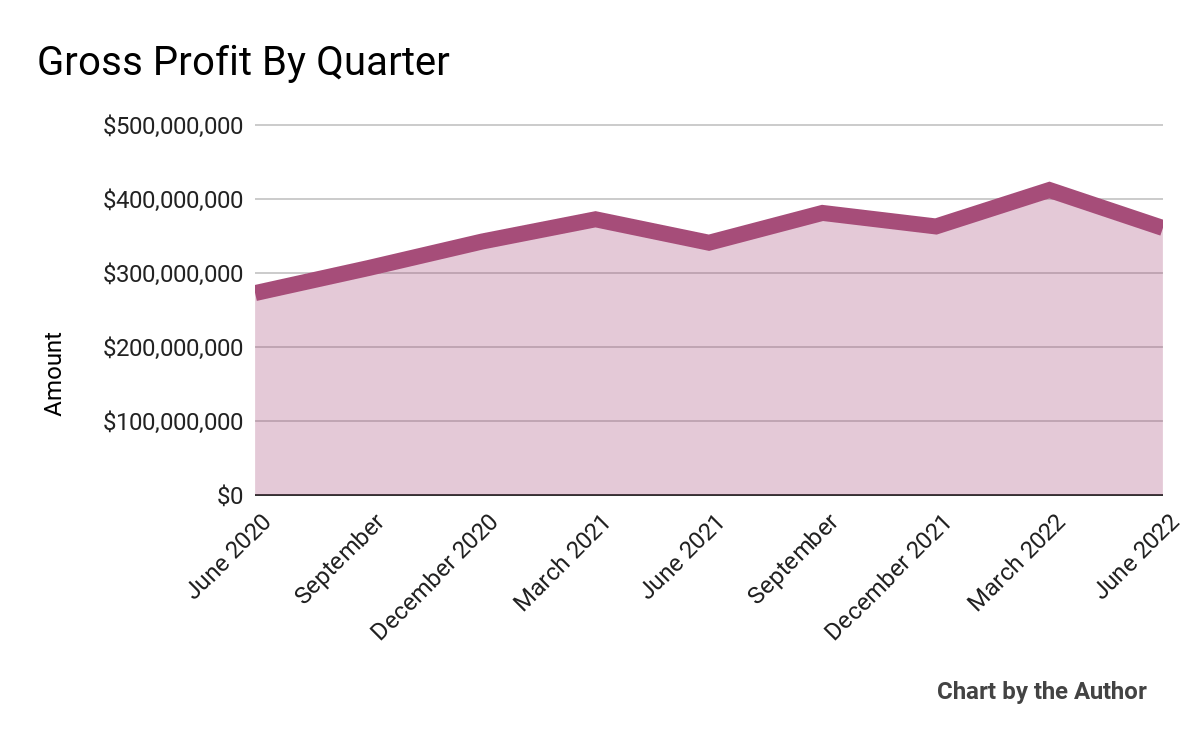
-
Selling, G&A expenses as a percentage of total revenue by quarter have trended slightly lower in recent quarters, as the chart shows here:
9 Quarter Selling, G&A % Of Revenue (Seeking Alpha)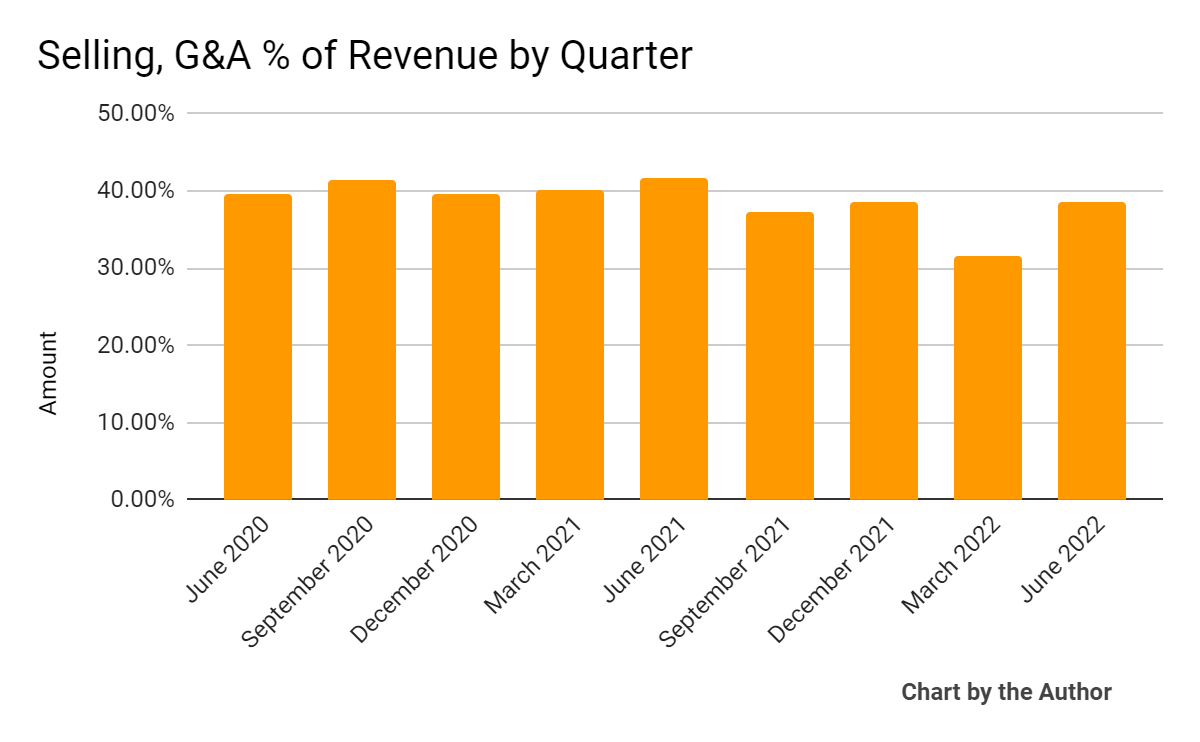
-
Operating income by quarter has followed the trajectory shown below:
9 Quarter Operating Income (Seeking Alpha)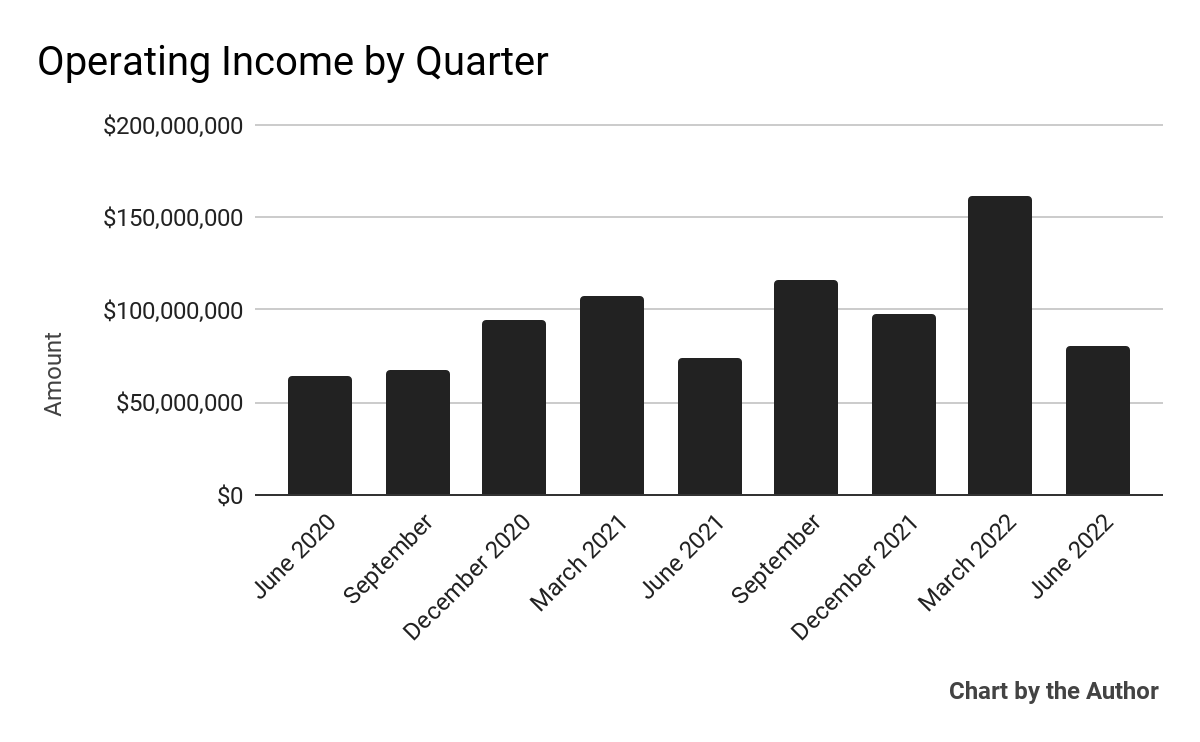
-
Earnings per share (Diluted) have fluctuated substantially:
9 Quarter Earnings Per Share (Seeking Alpha)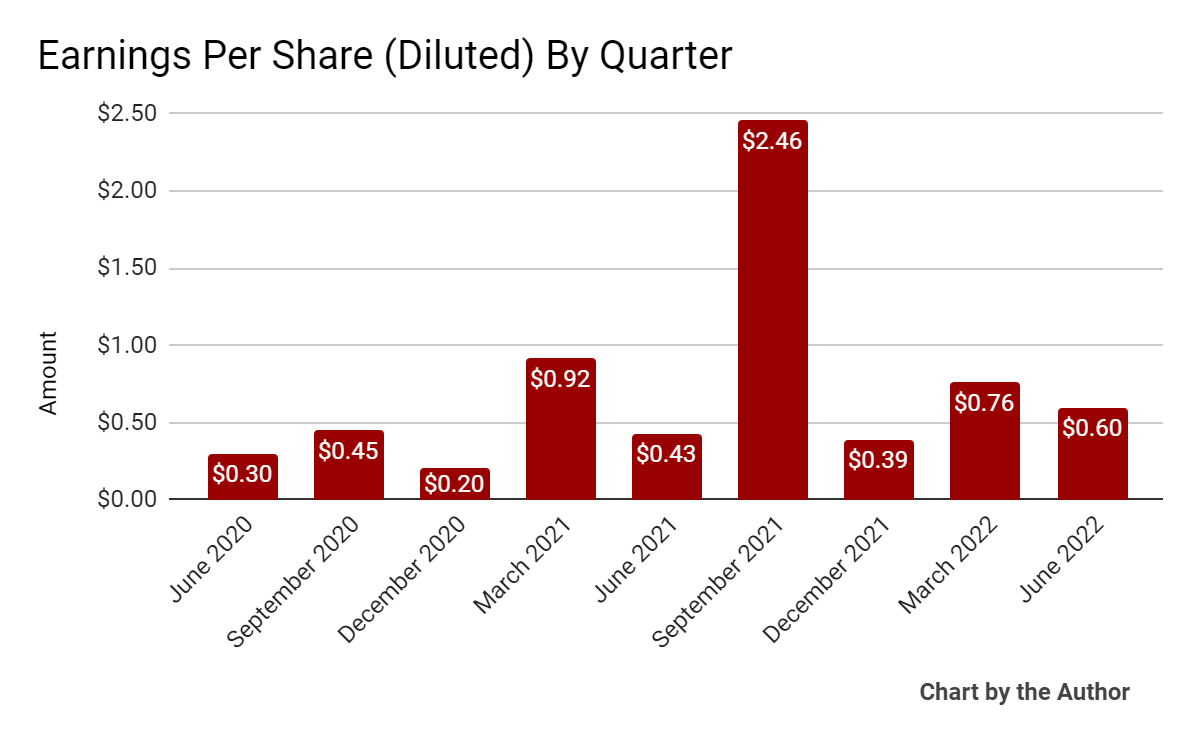
(All data in above charts is GAAP)
In the past 12 months, PTC’s stock price has dropped 10.4% vs. the U.S. S&P 500 index’ drop of around 15.9%, as the chart below indicates:
52 Week Stock Price (Seeking Alpha)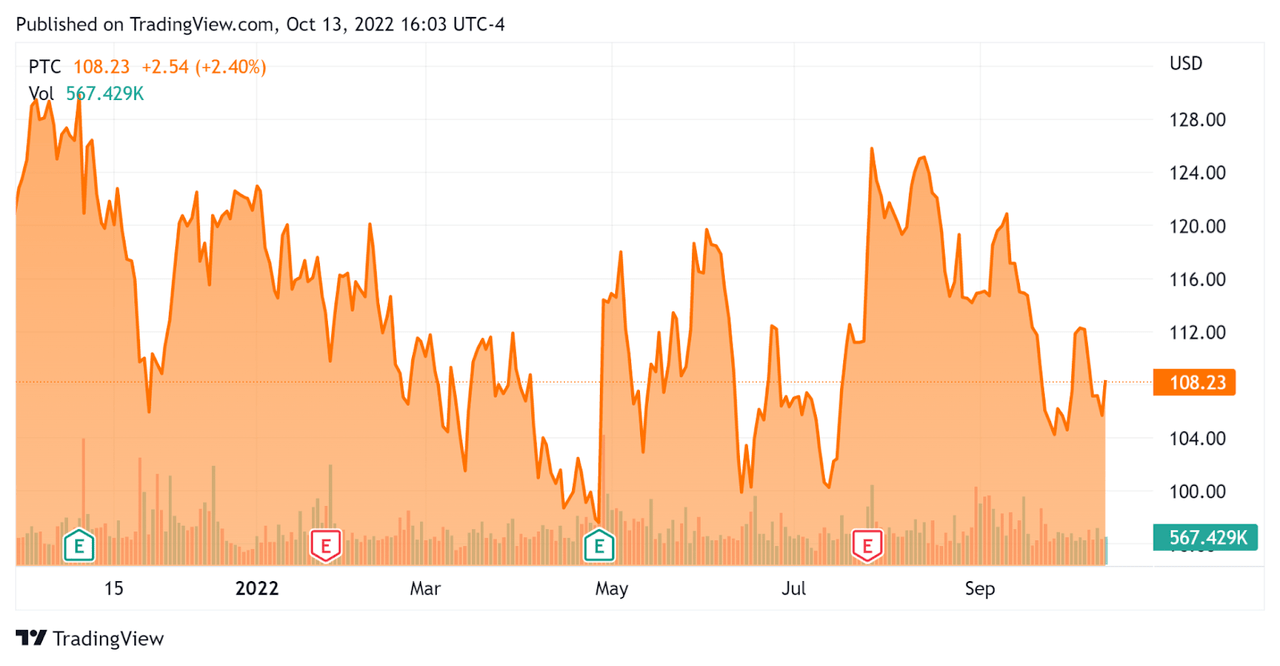
Valuation And Other Metrics For PTC
Below is a table of relevant capitalization and valuation figures for the company:
|
Measure [TTM] |
Amount |
|
Enterprise Value / Sales |
7.29 |
|
Revenue Growth Rate |
11.0% |
|
Net Income Margin |
26.2% |
|
GAAP EBITDA % |
25.8% |
|
Market Capitalization |
$12,590,000,000 |
|
Enterprise Value |
$13,890,000,000 |
|
Operating Cash Flow |
$442,150,000 |
|
Earnings Per Share (Fully Diluted) |
$4.21 |
(Source – Seeking Alpha)
Below is an estimated DCF (Discounted Cash Flow) analysis of the firm’s projected growth and earnings:
PTC Discounted Cash Flow Analysis (GuruFocus)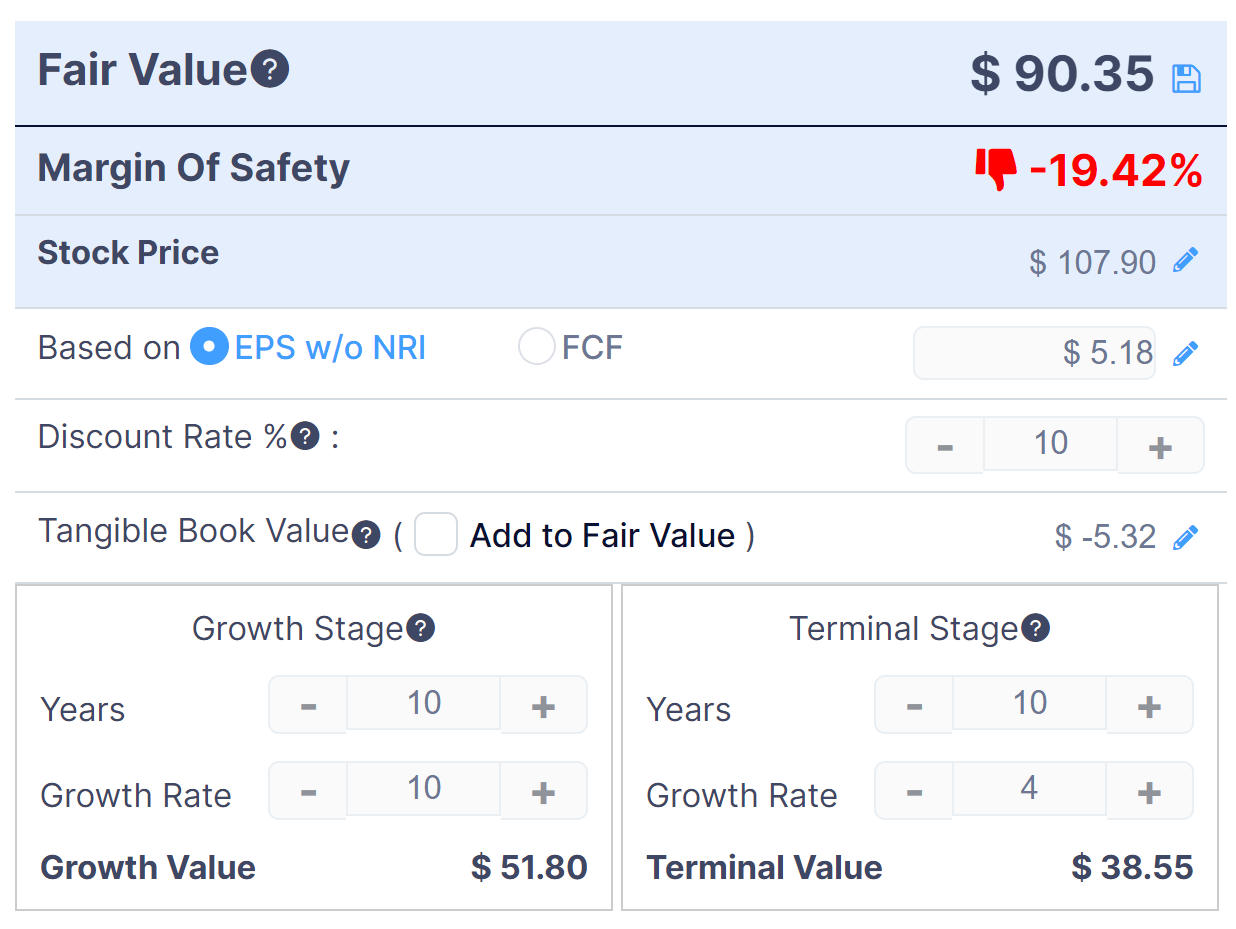
Assuming conservative DCF parameters, the firm’s shares would be valued at approximately $90.35 versus the current price of $107.90, indicating they are potentially currently overvalued, with the given earnings, growth and discount rate assumptions of the DCF.
As a reference, a relevant partial public comparable would be Autodesk; shown below is a comparison of their primary valuation metrics:
|
Metric |
Autodesk |
PTC |
Variance |
|
Enterprise Value / Sales |
9.00 |
7.29 |
-19.0% |
|
Revenue Growth Rate |
17.4% |
11.0% |
-37.0% |
|
Net Income Margin |
11.8% |
26.2% |
122.7% |
|
Operating Cash Flow |
$1,680,000,000 |
$442,150,000 |
-73.7% |
(Source – Seeking Alpha)
A full comparison of the two companies’ performance metrics may be viewed here.
The Rule of 40 is a software industry rule of thumb that says that as long as the combined revenue growth rate and EBITDA percentage rate equal or exceed 40%, the firm is on an acceptable growth/EBITDA trajectory.
PTC’s most recent GAAP Rule of 40 calculation was 36.7% as of Q2 2022, so the firm has performed fairly well in this regard, per the table below:
|
Rule of 40 – GAAP |
Calculation |
|
Recent Rev. Growth % |
11.0% |
|
GAAP EBITDA % |
25.8% |
|
Total |
36.7% |
(Source – Seeking Alpha)
Commentary On PTC
In its last earnings call (Source – Seeking Alpha), covering FQ32022’s results, management highlighted the growth of the company’s annual recurring revenue, which rose by 15% in constant currency terms.
Leadership believes that the company’s cost structure is ‘in great shape,’ with ‘most of the pain…behind us,’ as a result of last fiscal year’s restructuring and a ‘drive [to] a more aggressive and efficient SaaS strategy.’
Notably, the firm said that bookings grew by 20% in Europe, lower than in other regions. The company exited Russia recently.
As to its financial results, total revenue rose 6.2% year-over-year, with ‘broad-based’ strength across its product lines.
Management did not disclose any company retention rate information, but said that it was ‘the lowest churn the company has seen in many quarters.
PTC’s Rule of 40 results have been reasonably strong, especially for a company of its size.
Revenue growth would have been 12% except the company is seeing significant foreign exchange headwinds due to the strong dollar, especially against European currencies.
Gross profit was down, due in part to implementing ASC 606 which is a revised revenue recognition accounting standard now in effect.
For the balance sheet, the firm ended the quarter with cash and equivalents of $322 million and gross debt of $1.43 billion at an aggregate interest rate of 3.5%
Over the trailing twelve months, free cash flow was $419.1 million , of which $23.0 million was capital expenditures.
Looking ahead, the company aims to return one-half of its free cash flow to shareholders through share repurchases, assuming its debt-to-EBITDA ratio is below 3x.
Regarding valuation, the market is valuing PTC at an EV/Sales multiple of around 7.3x.
The SaaS Capital Index of publicly held SaaS software companies showed an average forward EV/Revenue multiple of around 6.9x at September 30, 2022, as the chart shows here:
SaaS Capital Index (SaaS Capital)
So, by comparison, PTC is currently valued by the market at a slight premium to the broader SaaS Capital Index, at least as of September 30, 2022.
The primary risk to the company’s outlook is an increasingly likely macroeconomic slowdown or recession, which may slow sales cycles and reduce its revenue growth trajectory.
Another risk is a continued rise in the value of the US dollar against other major currencies, which would negatively impact its revenue accordingly.
A potential upside catalyst would include a ‘short and shallow’ economic downturn or a pause in U.S. interest rate hikes, lowering upward pressure on the dollar and likely increasing the firm’s valuation multiple.
So, given macroeconomic uncertainties and the stock’s currently potentially rich valuation, I’m on Hold for PTC stock in the near term.
Be the first to comment