

monticelllo/iStock via Getty Images
Investment Thesis
The legendary all-weather dividend-yielding stock is in one of its weakest liquidity position currently, with substantial headwinds ahead for 2023. Choosing to stick to its shareholder return programs, the company might face a balance between operating spending and liquidity preservation, which might constrain its growth in the near term. We project weakening cash flow ahead and deem the current price overvalued.
Company Overview
Since founded in 1837, Procter & Gamble has become the most recognizable consumer brand. It has five major business units, including baby, feminine and Family care, and the beauty, health care, grooming plus fabric, and home care. Its focus markets are North America, Greater China, and Northern Europe, while the rest of the world is enterprise markets.
PG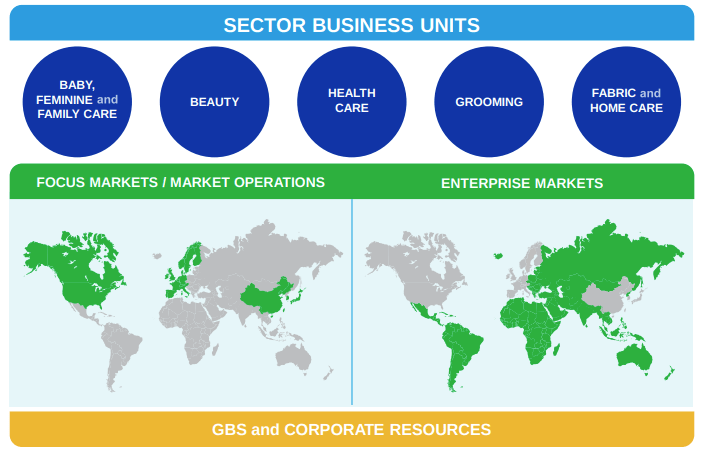
Strength
P&G has a lineup of leading brands that include more than 20 that generate more than $1 billion in revenue each in annual global sales, such as Tide laundry detergent, Charmin toilet paper, Pantene shampoo, and Pampers diapers. Most of them have been household names for decades.
P&G has a massive volume of sales through its global sales reach. The company has engaged in digital technology in its advertising campaign and channels while maintaining an online shopping presence. It also continued to develop a process to integrate the supply chain from design to manufacturing to delivery into a system with the algorithm to improve efficiency.
P&G Platform Structure (P&G Investor Day 2022 Presentation)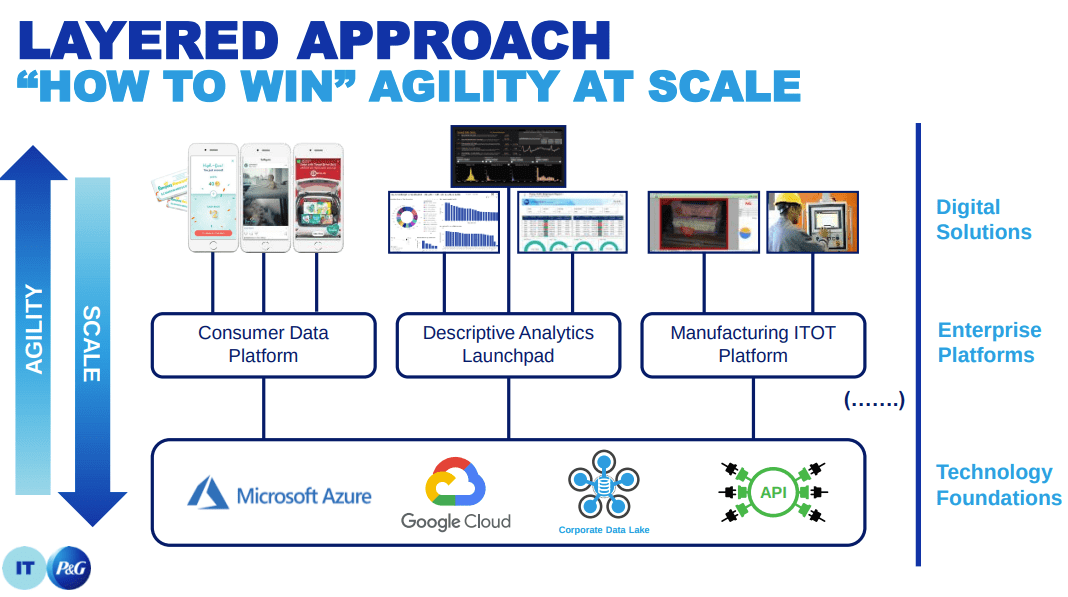
The system revamps and modernization has continued to drive P&G’s revenue recovery and growth in the past ten years. This year, the company’s revenue largely recovered back to its heights in 2013.
P&G Quarterly Revenue (Charted by Waterside Insight with data from P&G)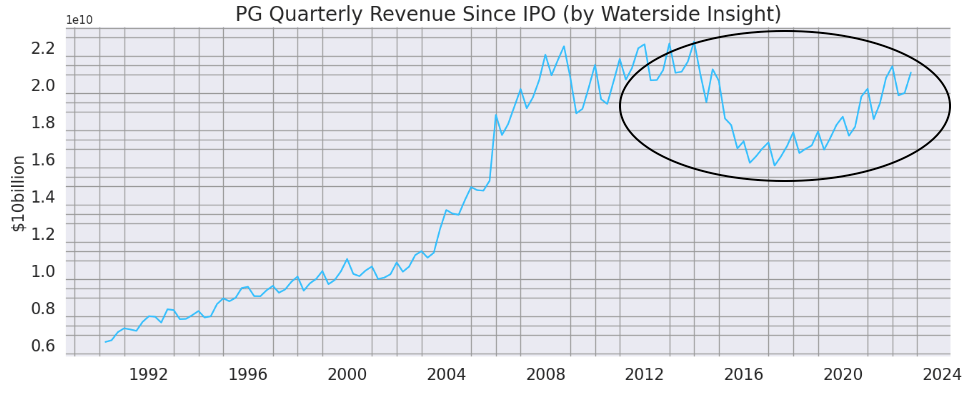
P&G has had a strong dividend-paying history since 1956. Its emphasis on shareholder return is obvious. This has attracted a large following among income-generating investors. We expect this to continue. There are a lot of analyst reports on the strength of the stock, we want to spend more ink on the current risks we are seeing.
P&G Dividend Payment History (P&G June 30 2022 10K)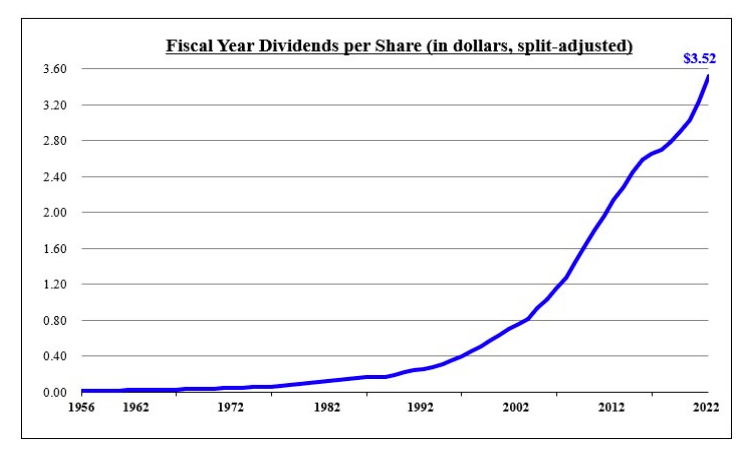
There are a lot of analyst reports on the strength of the stock, we want to spend more ink on the current risks we are seeing.
Weakness/Risks
In P&G’s presentation for Investor Day 2022, we encountered a lot of strong words, such as “superiority”, “productivity,” and “organic” as specific definitions. We went back to its 10-K to find the definitions. We found “organic” means the part of sales that Forex and Acquisition & Divestiture do not impact. For most companies, this “organic sales growth” would just be considered “sales growth”. Perhaps with the sheer size of P&G, it could wield its financial credibility and global coverage to boost sales, but those are not sustainable, hence the term “organic”. While “productivity” is the ratio of adjusted Free Cash Flow over Net Earnings. We couldn’t find any measurement of what “superiority” exactly is. We think perhaps a proxy to see both the “organic” and “productivity” is to see how much Revenue is being turned into Net Income. While its revenue has been climbing since 2015, its net income has more or less stayed at a similar level since 2009. That resulted in the gap between the two widening. In other words, a climbing revenue still resulted in a flat-ish net income. We don’t think the productivity of conventional definition has necessarily been improving.
P&G Revenue vs Net Income (Calculated and Charted by Waterside Insight with data from P&G)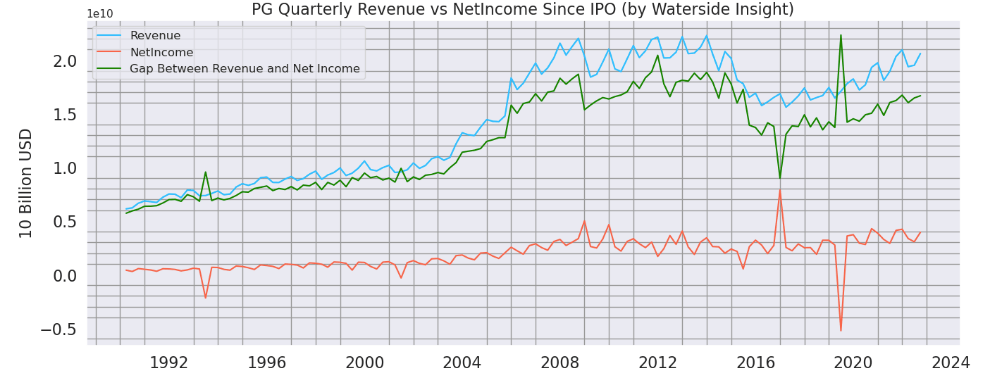
Since 2016, investors have been used to the increasing free cash flow of P&G, which reached its highest level of almost $5 billion in 2020. However, that trend seemed to have been revered as of late. Its Free Cash Flow has dropped to the middle range of 2008-2019.
P&G Quarterly Free Cash Flow (Charted by Waterside Insight with data from P&G)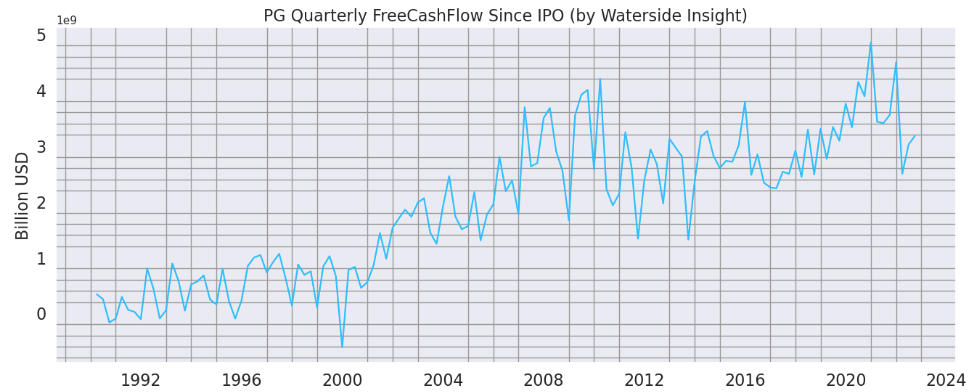
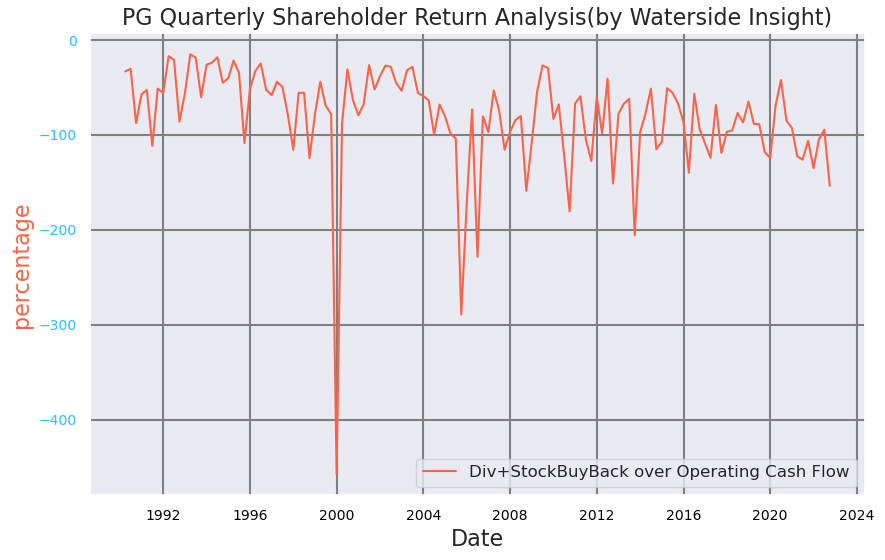
According to its 10-K filed in Q2, it funds shareholder dividends and share repurchases with excess operating cash flow after operating needs and CAPEX. However, its total shareholder return, which is Dividend plus Common Stock Repurchased Expenses, has exceeded 100% of its operating cash flow in the past few quarters. See the chart below:
P&G Shareholder Return Analysis (Calculated and Charted by Waterside Insight with data from P&G)
It has done this before. In fact, almost 40% of the time in the past 22 years, this ratio has exceeded 100% of its operating cash flow. What difference would it make this time, you ask. The difference is its current ratio in Q3 is at one of the lowest points in its entire history. It has dropped to almost 0.5 times.
P&G Current Ratio (Calculated and Charted by Waterside Insight with data from P&G) P&G Shareholder Return Analysis (Calculated and Charted by Waterside Insight with data from P&G)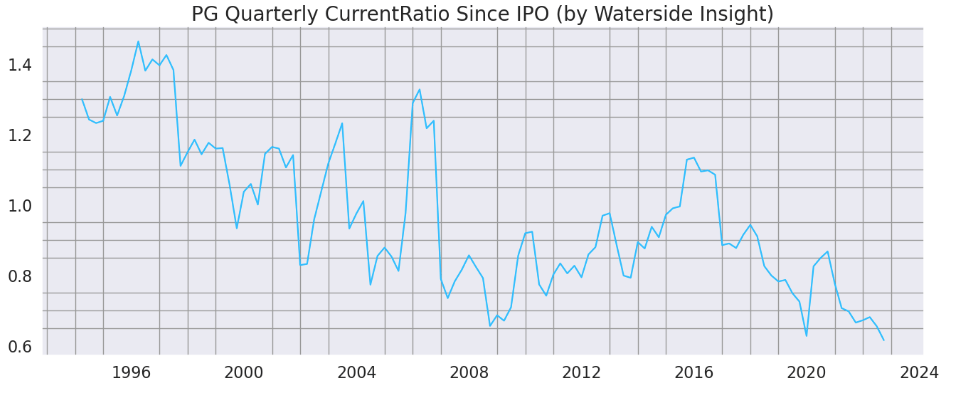
The pace at which P&G is converting product sales into cash is also at the lowest point since the 1990s. To analyze this, we need to understand P&G’s Account Payable has financial components to it.
P&G Liquidity Analysis (Calculated and Charted by Waterside Insight with data from P&G)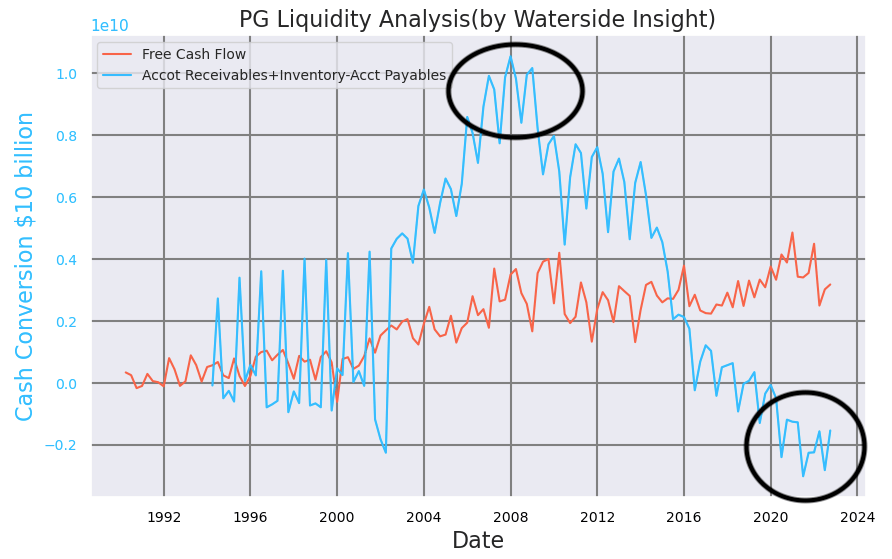
As a highly creditworthy company, P&G has a program called “Extended Payment Terms and Supply Chain Financing”. What it does is that the qualifying suppliers of P&G can bring their receivables sales arrangements directly with respective global financial institutions, called SCF banks (the “Supply Chain Finance program” banks), to establish credit spreads and associated costs with the bank in credit creation that otherwise they may not be able to qualify for. The invoices are still being paid by the due date by P&G. However, the suppliers obviously would be happy to extend favorable terms to the company. Therefore, we often see it reporting cash generated by accounts payables as the payment dates are extended. This financial component could impact its liquidity in a negative way when the SCF banks tighten lending standards, not to P&G directly per see, but to these smaller suppliers. And, in turn, impacting P&G’s liquidity. When facing an economic slowdown, the difference between now and pre-2008 for P&G is back then, the company was in a much better position in its cash conversion pace, almost the best in its recent history, while currently, it is in one of its worst, the negative territory.
The point we want to make is that P&G is a large, mature company. It has stable revenue and cash flow and long-standing history of setting shareholder return as a priority. But its growth isn’t the kind of multiple expansion or consumer disruption that some might think it to be. It has a high degree of earning visibility due to its brand recognition and efficient supply chain execution. However, the headwind remains.
P&G is expected to face over $3.9 billion in headwinds or a 27% cut to EPS growth for fiscal year 2023 from foreign exchange geopolitical issues, COVID disruptions impacting consumer confidence, and historically high inflation impacting consumer budgets. Compared with its similar estimate given in Q3 2022, it was expecting a $2.3 billion headwind total, or 16% cut to EPS growth. This year-ahead headwind estimate is a 69% increase for 2023. And if we are being even more persistent in looking back at its guidance in Q3 2020, this headwind was only about $525 million, with $175 million tailwinds of commodity cost, so the net headwind is only about $350 million. P&G is facing 11 times more headwinds in 2023 than in 2021, with a much weaker liquidity position than it was before the 2008 recession. That is substantial. We summarize it in a chart below:
P&G Headwind vs Op.CF Growth (Calculated and Charted by Waterside Insight with data from P&G)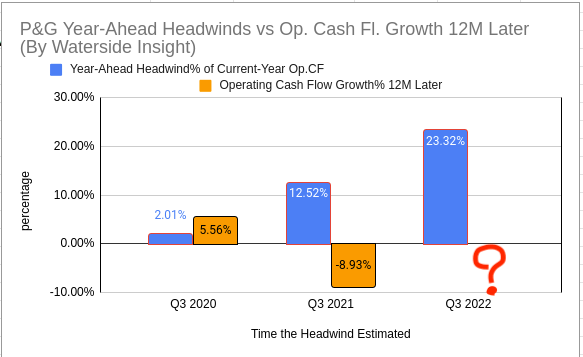
Today’s stock price happened to be at the same level as in November 2020, around $145. Let’s do a simple exercise to try to illustrate a point – supposedly, if we could make a very simplistic assumption that both prices were fair, that the company should be priced at $145 then and now, we knew its price rose by about 12.5% in 18 months after November 2020. Direction-wise, where do you expect it would be in the next 18 months from here? Another 12.5% up, flat out, or a downward movement?
We would choose the last. And we don’t think the weakness we outlined here is fully priced in yet. The stock is overvalued. See our valuation below.
Financial Review
P&G continued its revenue growth momentum in Q3 with $20.612 billion reported, a 5% growth QoQ and a 1.3% increase YoY. Its Operating Expenses rose to $4.83 billion, a 4.5% increase QoQ and a 1.7% decrease YoY. It maintained a $2.18 billion Levered Free Cash Flow, a 25.8% decrease QoQ and a 1.26% decrease YoY; its Net Change in Cash was negative $504 million for the quarter. Its Debt-to-Equity ratio is at 74.4%. The company’s quarterly earnings are $3.87 billion, a 29% increase QoQ but a 4.3% decrease YoY.
P&G Financial Overview (Calculated and Charted by Waterside Insight with data from P&G, Seeking Alpha and Yahoo!)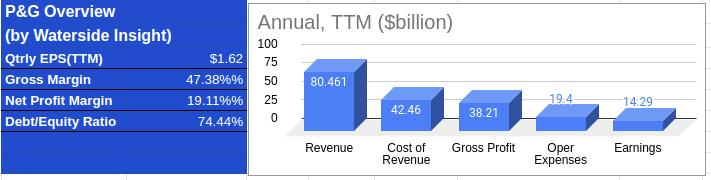
Valuation
To address its liquidity problem, the company will have to either cut back on its advertisement campaign via different channels/platforms, dig into its credit facility or extend the payables further within its suppliers. It will probably slow down the share buyback or freeze dividend increase, but it will be unlikely to cut the dividend. Therefore, we will not use the dividend discount model to price the stock because it doesn’t fully capture the whole picture.
To value the stock, we use proprietary models to analyze and forecast the stock price with projections ten years ahead. In the best scenario, where the company has no downturn but has lower growth due to the headwinds and eventually picks up the pace, it reached $152.7. In the base case scenario, the company suffered a blow in 2023 with a slow recovery but eventually has healthy growth, it is priced at $116.79. In our bearish case scenario, where the company does have negative growth in 2023 and recovers quickly, but growth fluctuates, it has a price of $98.51.
Conclusion
We wouldn’t recommend outright shorting P&G because it has a loyal following among income-generating investors. There is a premium that some investors are willing to pay to keep the income. But for capital-gain-conscious investors, the current price is not a good entry point. The downward trend is likely to resume for P&G’s price. Patient investors should wait for a price of $116 or lower before picking up more shares.
Be the first to comment