

designer491/iStock via Getty Images
“One of the most vexing problems in investment management is that diversification seems to disappear when investors need it the most.” – Sébastien Page, CFA, and Robert A. Panariello, CFA, “When Diversification Fails”
Two innovations over the last half-century have vastly expanded the range of securities to which investors have access.
Mutual funds were first launched en masse to the retail investing public in the 1970s and now tens of thousands have been created and sold to investors. Beginning in the 1990s, a similar wave of exchange-traded funds (ETFs) followed in their wake.
As mutual funds and ETFs have multiplied, far-off locales have become investable with the click of a few buttons. Emerging market equity funds led to frontier market equity funds and so on.
In theory, ever-greater access to world equity markets should have made it easier for investors to build and harvest the benefits of diversified global stock portfolios.
But has it really? Has diversifying across world equity indices actually helped reduce portfolio risk?
To find out, we collected as much data as we could find from various global stock market indices going back over the last several decades: the S&P 500 in the United States; the FTSE 250 in the United Kingdom; the DAX in Germany; the CAC 40 in France; the Nikkei in Japan; the Hang Seng in Hong Kong, SAR; the SSE in China; the TSX in Canada; the BVP in Brazil; the RTS in Russia; the KOSPI in South Korea; the SNX in India; the AOR in Australia; and the IPC in Mexico.
With this data in hand, we examined the correlations among each two-index combination in the 1980s, 1990s, 2000s, and 2010s to see whether diversifying between them actually yielded the hoped-for advantages in terms of risk reduction and how those advantages might have changed over time.
In the 1980s, the average correlation coefficient among all the indices studied for which we had data was 0.25. The minimum correlation coefficient was -0.51, for the BVP and HSI, while the maximum, for the S&P 500 and the FTSE 250, was 0.83. Of the 45 correlation coefficients in our sample for the decade, eight were negative.
Correlations among Global Stock Indices: 1980s
Author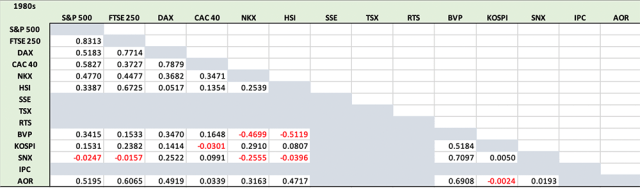
Fast-forward to the 1990s and the 2000s, and the negative correlations petered out as dispersion among the indices fell dramatically along with the associated diversification benefits.
Correlations among Global Stock Indices: 1990s
Author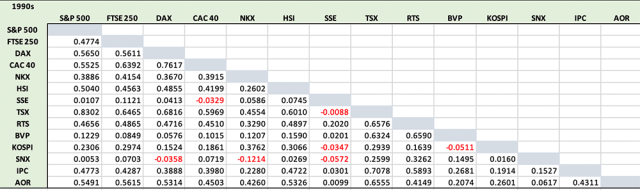
Correlations among Global Stock Indices: 2000s
Author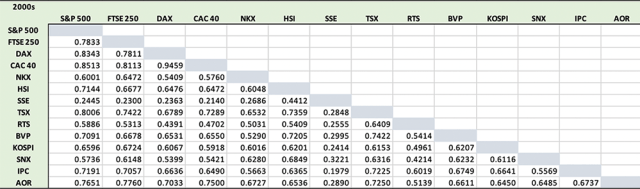
In the 1990s, the average correlation coefficient had already risen to 0.30. Of the 91 correlation coefficients, only eight were negative. By the 2000s, the average coefficient had climbed to 0.59, and there wasn’t a single negative correlation among the 91 index combinations.
This trend continued into the 2010s and the 2020s. Between 2020 and 28 February 2022, the average correlation was 0.70 and the minimum, for the RTS and SSE combo, was 0.36. So, for investors looking to reduce volatility this decade, dividing their equity allocation among international stock indices has not been a particularly effective strategy.
Correlations among Global Stock Indices: 2010s
Author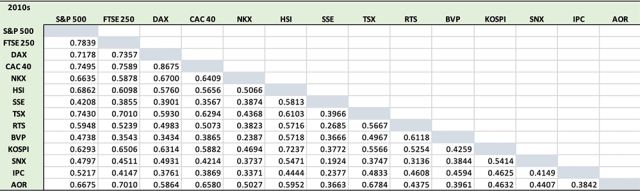
So what happened? Markets around the world have evolved and globalization has been the key theme of that process. In an interconnected and integrated world, equity markets have grown increasingly correlated.
So, even as investors have greater access to distant frontier markets as well as all manner of developed and developing stock indices, the benefits of diversifying their equity allocations among them have diminished.
Correlation among World Indices
| Min. | Max. | Median | Mean | Std. Dev. | |
| 1980s | -0.51 | 0.83 | 0.25 | 0.25 | 0.32 |
| 1990s | -0.12 | 0.83 | 0.30 | 0.31 | 0.24 |
| 2000s | 0.20 | 0.95 | 0.62 | 0.59 | 0.16 |
| 2010s | 0.19 | 0.87 | 0.50 | 0.51 | 0.14 |
| 2020s | 0.37 | 0.93 | 0.72 | 0.70 | 0.14 |
In the 1980s, an investor could diversify across the HSI and the BVI and cut the associated portfolio volatility by 12 percentage points compared to historical volatility.
Yet, in the 2020s thus far, the optimal index combo allocation for diversification purposes yields that paltry 0.36 correlation coefficient. That only cuts portfolio volatility by three percentage points compared to historical volatility. And requires an allocation to Russian equities, which have many strikes against them these days.
Of course, whether this trend of increasing stock index correlation will continue is an open question. Given the recent shake-up in world affairs, the answer may very well be no.
Many have speculated that the globalization wave of the last half-century has crested and is beginning to recede. In such a scenario, global stock market indices could become less correlated and their performance increasingly decoupled from one another. Whether that ends up being the case will be something to keep an eye on in the months and years ahead.
Disclaimer: Please note that the content of this site should not be construed as investment advice, nor do the opinions expressed necessarily reflect the views of CFA Institute.
Editor’s Note: The summary bullets for this article were chosen by Seeking Alpha editors.
Be the first to comment