

Pool Corporation Stock Is Finally Looking Like A Buy Imgorthand
Pool Corporation (NASDAQ:POOL) is the number one distributor of pool-related parts and products in the world. They also are much more than their namesake suggests after having expanded into related segments such as irrigation & landscape and outdoor living. In other words, if you have more than just a simple grass backyard Pool offers solutions to help you make the yard what you want.
Pool is largely focused on the United States market which generated around 90% of FY 2021’s sales. Europe as well as Canada & Other International both accounted for 5%.
While Pool benefits from new builds, they generate the majority of their sales from repair and maintenance spend. The fact is that parts and other pool supplies will go out over time so Pool benefits from a large amount of recurring revenue.
Additionally, according to management their primary operating spaces are highly fragmented, which should allow for continued M&A. That M&A should help to further cement Pool’s dominance in the pool-related parts of their business while also allowing for continued expansion into other segments of outdoor living.
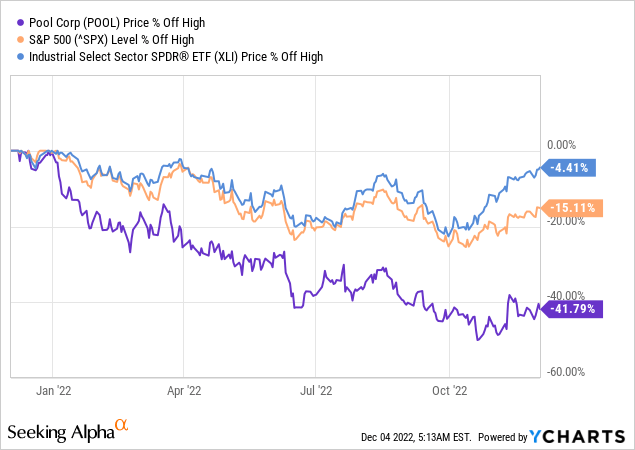
Pool’s share price is mired in a significant decline that is currently over 41% over the last year. That’s well below the S&P 500’s 15% decline and the Industrial sector’s 4% pullback.
Pool was a business that I didn’t get introduced to until the pandemic; however, the business caught my attention. While I think it’s safe to say at this point that there was a lot of froth in the share price heading into 2022, as evidenced by its underperformance; however, that decline has the business finally looking reasonably valued.
Dividend History
Dividend growth investing is the strategy that most appealed to me when I began investing many years ago. The strategy is very straight forward which is to focus on businesses that have a history of both paying and growing their dividend over time. One of the benefits to the strategy is that it helps to narrow your focus among the universe of investments and also helps to identify likely high-quality businesses.
Pool Corporation Dividend History (POOL Investor Relations)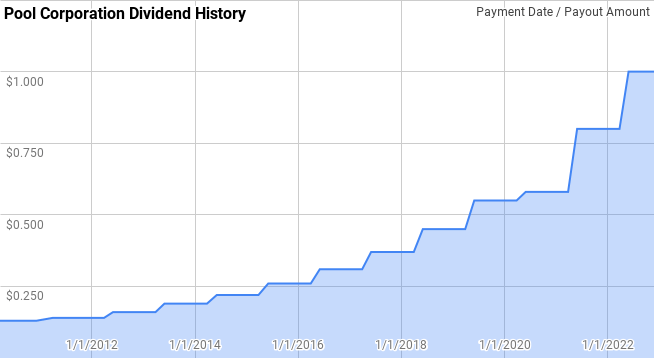
Pool’s dividend growth streak is up to 13 years now which gives them the title of Dividend Contender. While their streak isn’t that long it’s important to remember that every company with a longer history has a streak only 13 years old at one point.
During their streak, Pool’s year over year dividend growth has ranged from 7.7% to 30.1% with an average of 18.2% and a median of 18.4%.
There’s been 10 rolling 3-year periods during their streak with annualized dividend growth coming in between 12.0% and 21.9% with an average of 18.0% and a median of 18.2%.
Additionally, there’s been 8 rolling 5-year periods with Pool’s annualized dividend growth spanning from 14.0% to 21.8% with an average of 18.3% and a median of 18.4%.
The rolling 1-, 3-, 5-, and 10-year annualized dividend growth rates from Pool since 2010 can be found in the following table.
| Year | Annual Dividend | 1 Year | 3 Year | 5 Year | 10 Year |
| 2010 | $0.52 | ||||
| 2011 | $0.56 | 7.69% | |||
| 2012 | $0.62 | 10.71% | |||
| 2013 | $0.73 | 17.74% | 11.97% | ||
| 2014 | $0.85 | 16.44% | 14.92% | ||
| 2015 | $1.00 | 17.65% | 17.27% | 13.97% | |
| 2016 | $1.19 | 19.00% | 17.69% | 16.27% | |
| 2017 | $1.42 | 19.33% | 18.66% | 18.03% | |
| 2018 | $1.72 | 21.13% | 19.81% | 18.70% | |
| 2019 | $2.10 | 22.09% | 20.84% | 19.83% | |
| 2020 | $2.29 | 9.05% | 17.27% | 18.02% | 15.98% |
| 2021 | $2.98 | 30.13% | 20.11% | 20.15% | 18.20% |
| 2022 | $3.80 | 27.52% | 21.86% | 21.76% | 19.88% |
Source: Author; Data Source: Pool Corporation Investor Relations
The humble payout ratio can give you plenty of information about the health and safety of a dividend. In conjunction with the historic growth rates the payout ratios let you know if the business has been growing the dividend in line with the business as evidenced by a flat or stable payout ratio. Whereas a rising payout ratio lets you know that the dividend has been growing in excess of the business and dividend growth could potentially slow moving forward.
POOL Dividend Payout Ratios (POOL SEC filings)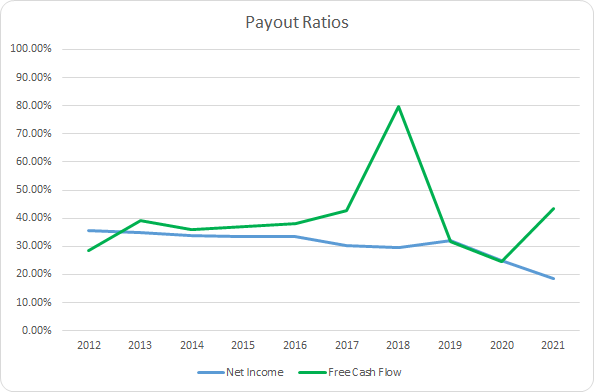
Pool’s payout ratios have been fairly stable over time. The 10-year average net income payout ratio is 30.7% with the 5-year average at 27.1%. Pool’s average free cash flow payout ratios are 40.0% and 44.4%, respectively. Historically, Pool’s dividend has been well covered by both net income and free cash flow.
Quantitative Quality
My goal is to invest in businesses that I have a high degree of confidence they will be able to continue to grow and improve over time. In other words I’m looking for businesses that I believe are high quality and with strong competitive positioning. As such I examine a wide variety of financial metrics to see how the business has performed historically.
POOL Revenue Profits and Cash Flow (POOL SEC filings)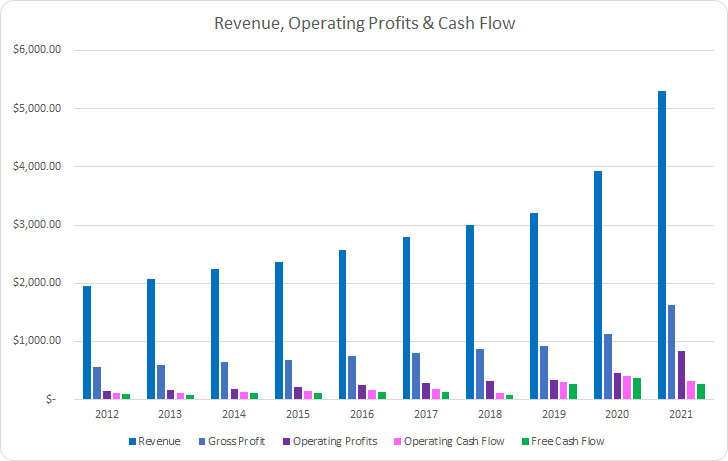
Pool has done an excellent job growing revenues both through organic demand growth, pricing, as well as acquired growth. Revenues increased by 171.0% or 11.7% annualized between the end of FY 2012 and FY 2021. Gross profits improved by 185.3% or 12.3% annualized over that same period.
Operating profits expanded tremendously rising by 474.9% in total or 21.4% annualized. However, operating cash flow lagged revenue growth improving by just 163.3% or 11.4% annualized. Free cash flow tracked closer to revenue growth increasing by 168.3% or 11.6% annualized over that time.
While higher margins are better, I prioritize margin stability and improvement over the absolute levels. Stable or improving margins suggest that the business is able to successfully thwart competitors’ attempts to challenge the business. I prefer to see 10% or greater free cash flow margins; however, the trend weighs more in that decision.
POOL Margins (POOL SEC filings)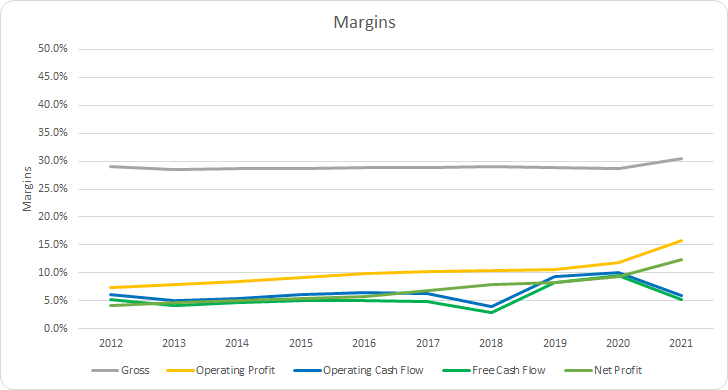
For most of the last decade, Pool’s gross margins were in a very narrow range between 28% and 29%. The 10-year average gross margin works out to 29.0% with the 5-year average at 29.2%.
Pool’s operating margins showed improvement each year over the last decade with a 10-year average of 10.2% and a 5-year average of 11.8%. Pool’s free cash flow margins are relatively tight with a 10-year average of 5.5% and a 5-year average coming to 6.2%. However, they have generally been trending higher over time.
An alternative measure of profitability is to compare a measure of profits compared to the asset or capital base. Some companies, like software companies, carry high very high margins; however, others such as retail outfits have low margins, but very high asset turnover that leads to strong returns. My preferred profitability measure is the free cash flow return on invested capital. I want to see stable or improving FCF ROIC’s over time with a minimum level of 10%.
POOL Free Cash Flow Returns (POOL SEC filings)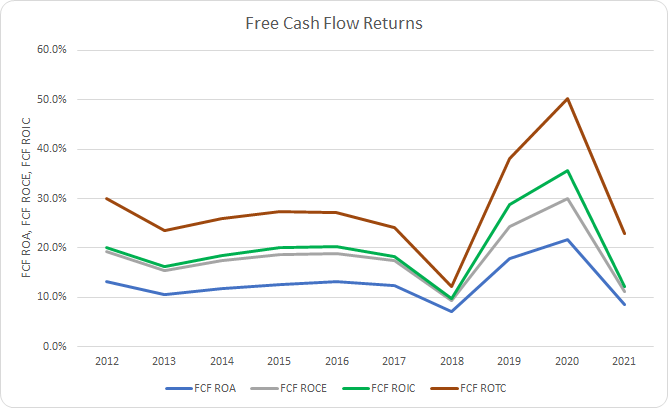
Pool’s returns have been solid over the last decade and relatively consistent outside of FY 2020, which saw massive improvement. The 10-year average FCF ROIC for Pool is 20.0% with the 5-year average coming to 20.9%. Additionally their FCF ROA has averaged 12.8% and 13.5%, respectively.
To understand how Pool uses its free cash flow I calculate three variations of the metric, defined below:
- Free Cash Flow, FCF: Operating cash flow less capital expenditures
- Free Cash Flow after Dividend, FCFaD: FCF less total cash dividend payments
- Free Cash Flow after Dividend and Buybacks, FCFaDB: FCFaD less net cash used on share repurchases
POOL Free Cash Flows (POOL SEC filings)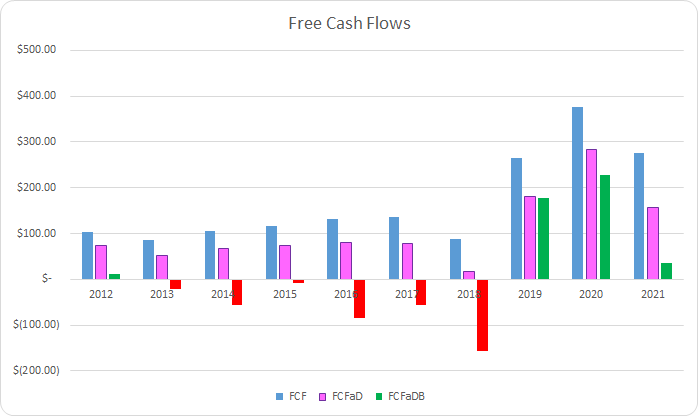
Between FY 2012 and FY 2021 Pool generated $1.68 B in cumulative FCF through their operations. They also sent out a total of $0.62 B to shareholders in dividend payments that grew each year. That brings the cumulative FCFaD for the period to $1.07 B. Additionally they have spent a net total of $1.00 B repurchasing shares over that time which brings the cumulative FCFaDB to $0.70 B.
Comparing the cumulative cash used on dividends and buybacks, Pool has clearly favored buybacks. Over that time they’ve spent around $0.62 for every net $1.00 spent on repurchasing shares.
POOL Shares Outstanding (POOL SEC filings)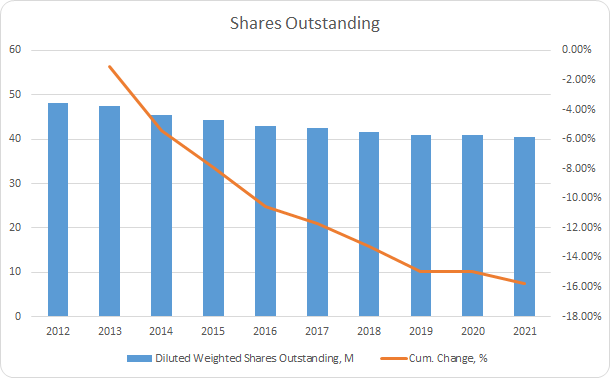
In total Pool’s share count has been reduced by 15.8% which is good for a 1.9% annualized reduction over that time.
I have to applaud management for not aggressively pursuing buybacks, especially in 2020, when their valuation was arguably extreme.
Additionally, I’m thinking through a measure of value created by repurchases. At the end of FY 2012, Pool’s average diluted weighted shares outstanding were 48.058 M. Between FY 2012 and FY 2021 Pool spent a net total of $19.47 per 2012 share on buybacks. Assuming a flat share count from FY 2012 and FY 2021, adjusted EPS would have been $13.45 compared to the $15.97 they actually were.
Based on the current share price of $330.43 that puts the P/E ratio based on FY 2021 EPS at 20.7x which puts the share price based on the adjusted FY 2021 EPS of $13.45 at $278.33. Cash is then added to the adjusted share price at a 1:1 ratio to bring the adjusted share price to $297.79.
That means the buybacks have “created” 11% value compared to if Pool had foregone buybacks and instead stockpiled that cash. It’s a very rough analysis of buyback effectiveness; however, it seems to suggest that Pool has done a good job with buybacks.
My intention whenever I choose to invest in a business is to own shares for at a minimum a 3-year period. The business’ results determine if that gets extended. As such I want to make sure the balance sheet is not excessively leveraged.
POOL Debt to Capitalization (POOL SEC filings)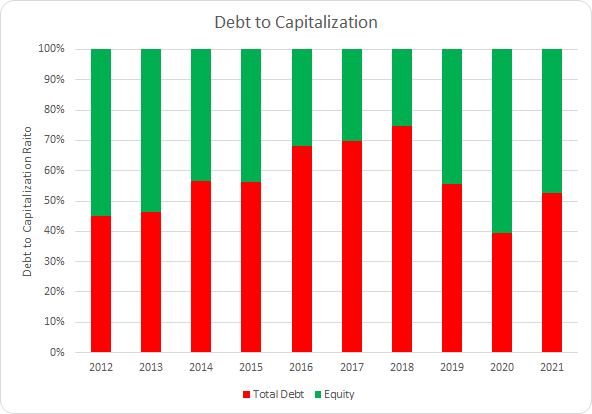
Pool carries a fairly leveraged capital structure although it’s been relatively stable over time. The 10-year average debt-to-capitalization ratio is 56% with the 5-year average at 58%.
I place more emphasis on the net debt ratios which examine the next debt carried on the balance sheet compared to a measure of profits or cash flow. I want to see stable levels over time that appear reasonable given the nature of the business. Additionally, the net debt ratios let you know how quickly the business could de-leverage if necessary assuming no material changes to the underlying business or its profitability.
POOL Debt Ratios (POOL SEC filings)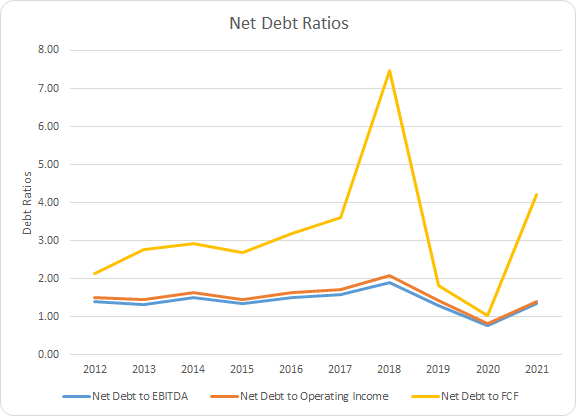
Pool’s leverage appears modest in relation to the profits and cash flows of the business. The 10-year average net debt-to-EBITDA, net debt-to-operating income, and net debt-to-FCF ratios are 1.4x, 1.5x, and 3.2x, respectively. Pool’s 5-year averages are 1.3x, 1.4x, and 3.6x, accordingly.
How Did We Get Here?
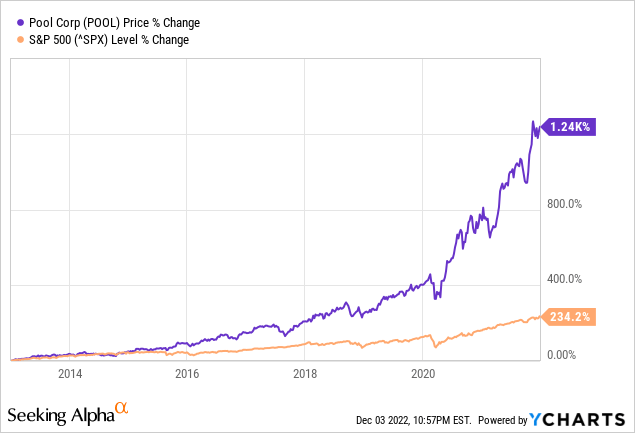
From December 31, 2012 through December 31, 2021, Pool’s share price rose by 1,237.4% or a 29.6% annualized rate. Add in the 1.5% dividend yield from the beginning and that brings Pool’s CAGR over that time to an impressive 31.1%.
That handily outperformed the S&P 500 benchmark return that saw a strong 234.2% total gain over that time or 14.3% annualized rate.
If you believe, like Graham and Buffett do, that over the short-term valuations can get out of hand due to manic and depressive states of investors, but over time returns should track gravitate towards the business fundamentals. As such I’ve broken down the returns over that period into various components to get an idea of what justified returns were.
- Business returns: measured as annualized revenue growth rate plus the annualized rate of change of net profit margin
- Capital Allocation returns: measured as dividend yield plus annualized change in shares outstanding
- Sentiment Change: measured as the annualized rate of change between starting and ending P/E multiple
This isn’t a perfect analysis; however, I believe that it gets you most of the way in identifying what the source of returns have been over a given period of time.
Pool’s revenues grew by 171.0% between FY 2012 and FY 2021 and counted as a +11.6% attribution to the annualized returns. Pool’s net profit margin rose impressively from 4.2% to 12.2% which contributed another 12.5% annualized to the returns. In total the business return attribution comes to +24.1%.
Pool reduced their share count by 15.8% in total over that time which boosted per share returns by 1.9%. Added to the 1.5% starting dividend yield and that brings the capital allocation return attribution to +3.3%.
Additionally, Pool’s trailing P/E multiple increased from 24.8x at the end of FY 2012 to 35.5x by the end of FY 2021 which was a 42.9% total increase. That works out to a +3.6% attribution of the CAGR to sentiment change.
| Annualized Returns | % of Returns | |
| Business Returns | 24.1% | 78% |
| Capital Allocation Returns | 3.3% | 11% |
| Sentiment Change | 3.6% | 12% |
| Total Annualized Returns | 31.1% |
Source: Author
While I expect Pool to continue to grow over time, I would be hesitant to expect a repeat of the 11.6% sales growth from the prior 10 years. Additionally, the net profit margin is not likely to be as big of a contributor to returns moving forward.
Based on the current market cap and the average of the last 3 years, plus TTM period, of FCFaD Pool could repurchase ~1.3% of shares outstanding. The dividend yield, while not very enticing, is also back up to 1.2% thanks to continued dividend growth and a falling share price.
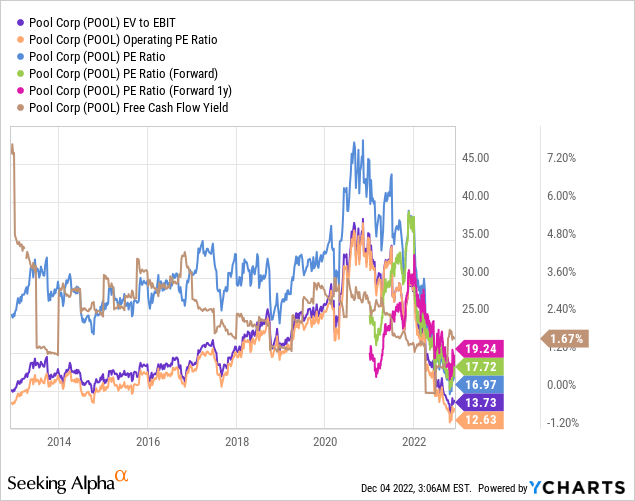
Looking forward, Pool is much more attractively valued at first glance. Based on the TTM P/E as well as the P/E based on FY 2022 and FY 2023 estimates.
POOL Return Breakdown (Author)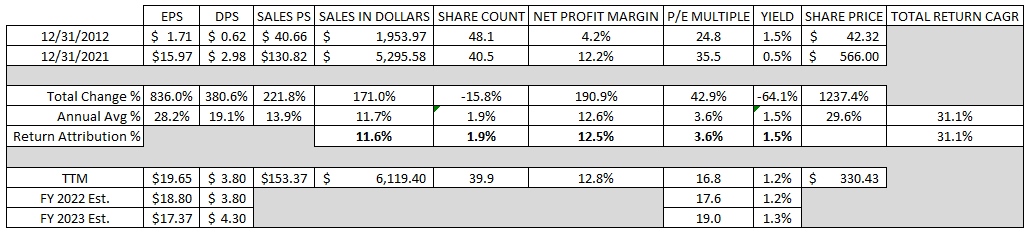
Pool expects organic sales growth to come in between 6-9% over the longer term. Assuming 10% to 30% net profit margin improvement would lead to 1.1% to 3.0% annualized contribution to forward returns. Assuming share repurchase to contribute 0.5% to 1.5% moving forward plus the current dividend yield of 1.2% puts the expected return ex-sentiment change around 8.7% to 14.6% annually.
Valuation
Once I’ve identified a business that I’d like to own, there also comes the issue of valuation. I utilize multiple valuation methods to narrow in on potentially attractive levels at which to purchase shares.
The dividend yield theory valuation method is based on the idea that over time investors, collectively, will value a business such that it offers around the same dividend yield over time. It’s a reversion to the mean-based concept and most attractively offers a quick yardstick to measure against.
Pool Corporation Dividend Yield Theory (Author)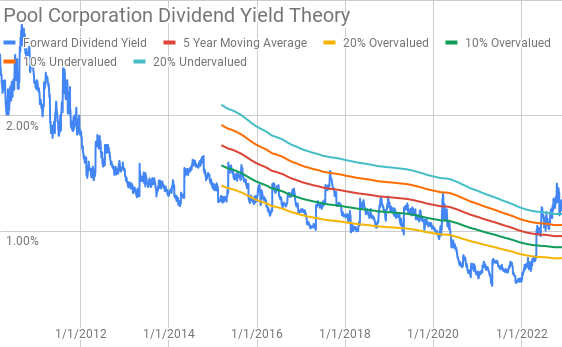
Pool currently offers a forward dividend yield of 1.21% compared to the 5-year average forward dividend yield of 0.96%. Compared to the last several years, Pool’s dividend yield is back to roughly 2019 or 2020 levels and is back around the 20% undervalued mark.
A discounted cash flow analysis is the proper way to value an asset; however, it’s rife with issues. However, the reverse discounted cash flow model can be used to decipher what kind of growth and margins you need to believe the business is capable of maintaining in order to generate the cash flows that would support the current market valuations.
I use a simplified DCF model based on revenue growth and an initial FCF margin of 6.0% that improves to 8.5% across the forecast period. The terminal growth rate is estimated at 3.5%.
For the discount rate I’ve assumed an after-tax cost of debt of 2.2% with a 10% and 8% cost of equity. That yields a discount rate of 9.4% and 7.5%, respectively. Additionally, I use a cost of equity derived from the dividend capitalization method with an estimated dividend growth rate of 9%. That yields a dividend capitalization cost of equity estimate of 10.2% and a discount rate of 9.5%.
Under the 10% cost of equity / 9.4% discount rate scenario, Pool needs to grow revenues 11.6% annually during the forecast period to generate the cash flows that would support the current market based valuation. With the 8% cost of equity / 7.5% discount rate, Pool’s required revenue growth comes to 5.7% annually across the forecast period. The dividend capitalization-based discount rate requires revenue growth of 12.2% annually during the forecast period.
A MARR analysis entails estimating the future earnings and dividends that a business will generate over a given period of time. You then apply a reasonable expected terminal multiple on those future earnings to determine an expected share price range. If the expected return from an investment is greater than your threshold then you can proceed with purchasing a stake in said business.
Analysts expect Pool to report FY 2022 EPS of $18.80 and FY 2023 EPS of $17.37. Despite the decline compared to FY 2022 they do expect Pool to manage 12.5% annual EPS growth across the next 5 years. I then assumed that EPS growth would moderate to 5% annually for the following 5 years. Dividends are assumed to target a 25% payout ratio.
Over the last decade, Pool has usually been valued between ~15 and ~35x TTM EPS. For the MARR analysis I’ll examine terminal multiples that span that range.
The following table shows the potential internal rates of return that West could generate provided the assumptions laid out above prove reasonably accurate. Returns assume a purchase price of $330.43, Friday’s closing price. Returns also assume dividends are taken in cash and that they are paid and raised along the timeline that Pool has usually followed.
| IRR | ||
| P/E Level | 5 Year | 10 Year |
| 35 | 25.5% | 15.3% |
| 30 | 21.8% | 13.6% |
| 25 | 17.7% | 11.7% |
| 20 | 12.7% | 9.4% |
| 17.5 | 9.9% | 8.1% |
| 15 | 6.7% | 6.6% |
Source: Author
Alternatively, I use the MARR analysis framework to work backwards from the future value to find out the maximum price I could pay for Pool shares today based on various expected terminal multiples. My minimum threshold for investment is a 10% IRR and for Pool I’ll also examine 12% and 15% return targets.
| Purchase Price Targets | ||||||
| 10% Return Target | 12% Return Target | 15% Return Target | ||||
| P/E Level | 5 Year | 10 Year | 5 Year | 10 Year | 5 Year | 10 Year |
| 35 | $653 | $530 | $599 | $448 | $529 | $350 |
| 30 | $563 | $461 | $517 | $390 | $456 | $305 |
| 25 | $473 | $391 | $434 | $331 | $384 | $260 |
| 20 | $383 | $322 | $352 | $273 | $311 | $215 |
| 17.5 | $337 | $287 | $310 | $244 | $275 | $193 |
| 15 | $292 | $252 | $269 | $215 | $238 | $170 |
Source: Author
Conclusion
Pool is a fantastic business and one that is increasingly interesting in the midst of a 40%+ pullback. Pool has shown steady growth both through organic pricing and volume efforts as well as through acquiring other businesses.
While Pool doesn’t carry the strongest of margins, they have generally been trending higher over time which is a plus. What Pool lacks for in margins they make up for with pretty strong asset and inventory turnover.
POOL Turnover (POOL SEC filings)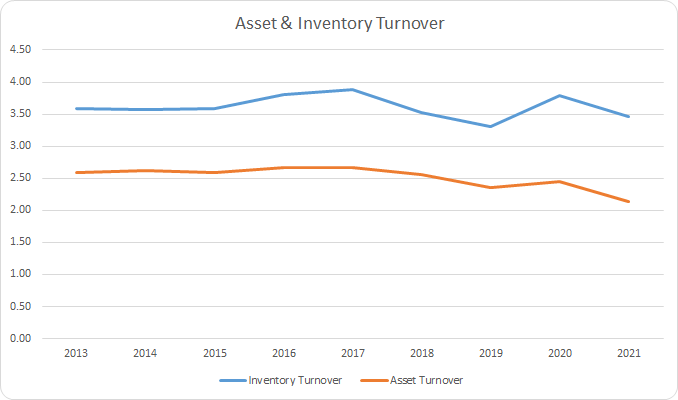
That’s led to Pool maintaining strong FCF ROA around 13% and FCF ROIC of 20%.
Dividend yield theory suggests that Pool is undervalued at the moment. The fair value range for Pool comes between $379 to $463.
However, the reverse DCF model suggests that Pool is likely quite expensive as the required revenue growth to support the 10% cost of equity and dividend capitalization-based models is quite high. Although the 8% cost of equity scenario suggests modest required revenue growth to hit that mark.
Of course if margin improvement comes in faster than forecast that would reduce the required revenue growth. The reverse DCF also does not account for share repurchases which should roughly reduce the required revenue growth rate on a 1 for 1 basis.
Based on a 10% IRR target 5 years out and a terminal multiple between 17.5x and 22.5x Pool’s fair value range is $337 to $428. With a 12% IRR target and the same terminal multiple the fair value falls to $310 to $393.
Out of the 3 valuation models there’s 2 that suggest Pool is currently undervalued and 1 that suggests it’s likely on the upper end of fair value.
I think it’s pretty clear that market participants over extrapolated Pool’s results during 2020 and 2021. Pool saw a sizable increase in new pool builds during 2020 and 2021 compared to the trend coming out of the housing crisis from the late 2000’s. As such, Pool’s share price got bid up to pretty lofty levels.
POOL installed base (Pool Deutsche Bank Industrials Conference Presentation Nov 2022)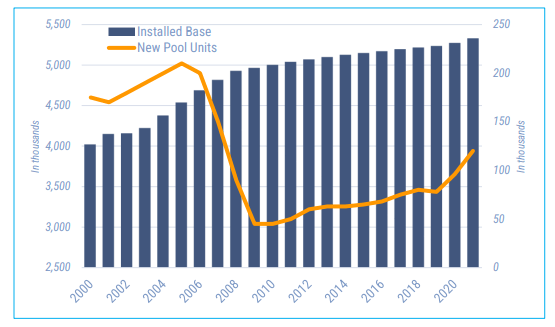
From data compiled regarding insider activity we see just 4 purchases over the last 2 years amounting to $669k with 87 sales totaling $106.1 M. However, almost all of those sales came during 2021 and over the last year there’s 2 buys with $311k total and 1 sell off $960k.
Pool has a dominant position in their niche as the #1 distributor of pool-related products. Pool should also benefit from higher margin / value product switches as older pools are remodeled/upgraded. Management estimates that 70% of existing pools have no automation and that the average age of a pool is over 22 years old.
If the housing market remains challenged that could lead to more existing homeowners seeking out opportunities to improve their current outdoor setups as a lower cost alternative to purchasing a house and moving.
While Pool does benefit from new builds, the majority of their revenues come from repair and maintenance as well as replacement & refurbishment. So it’s more about the installed base of pools rather that drives the recurring and non-discretionary sales. Which as we saw above the installed base continues to climb even if the pace has slowed.
POOL Sales Profile (Pool Deutsche Bank Industrials Conference Presentation Nov 2022)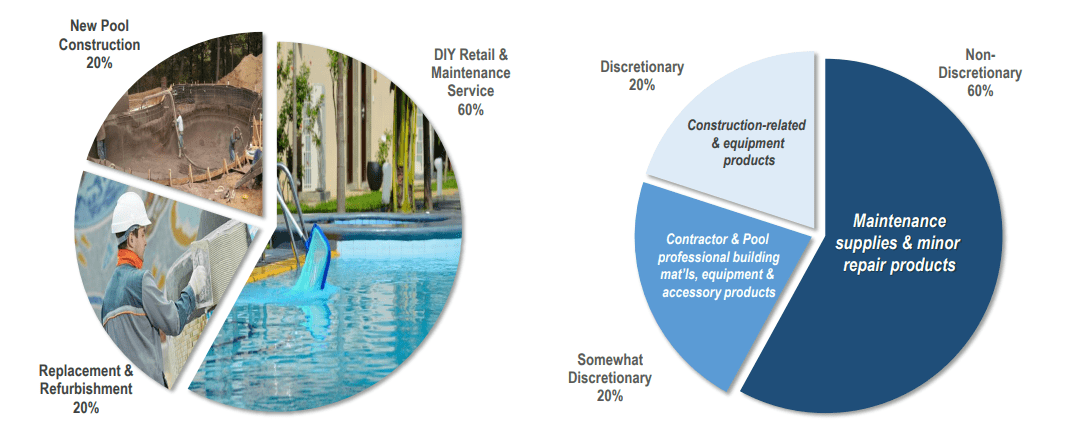
In my opinion Pool looks attractively valued for investors with an intermediate term investment horizon. I plan to initiate a position in Pool over the coming week around current levels. While there could be continued headwinds over the short term due to a continued cooling of the housing market as well as a potential recession, I would consider those opportunities to add to an existing position.
Be the first to comment