

Wavebreak/E+ via Getty Images
Thesis
There are good reasons to be attracted to the PIMCO Dynamic Income Fund (NYSE:PDI) and the PIMCO Corporate & Income Opportunity Fund (NYSE:PTY). As you can see from the following chart, both funds are yielding about 12% now, quite attractive in both absolute and relative terms. Such yields are not only far higher than risk-free interest rates (around 3.5%), but also higher than their own historical records. To wit, PDI is yielding 12.78%, about 10.3% above its historical average of 11.56%. And PTY is yielding 11.18%, about 11.1% above its historical average of 10.01%.
Source: Seeking Alpha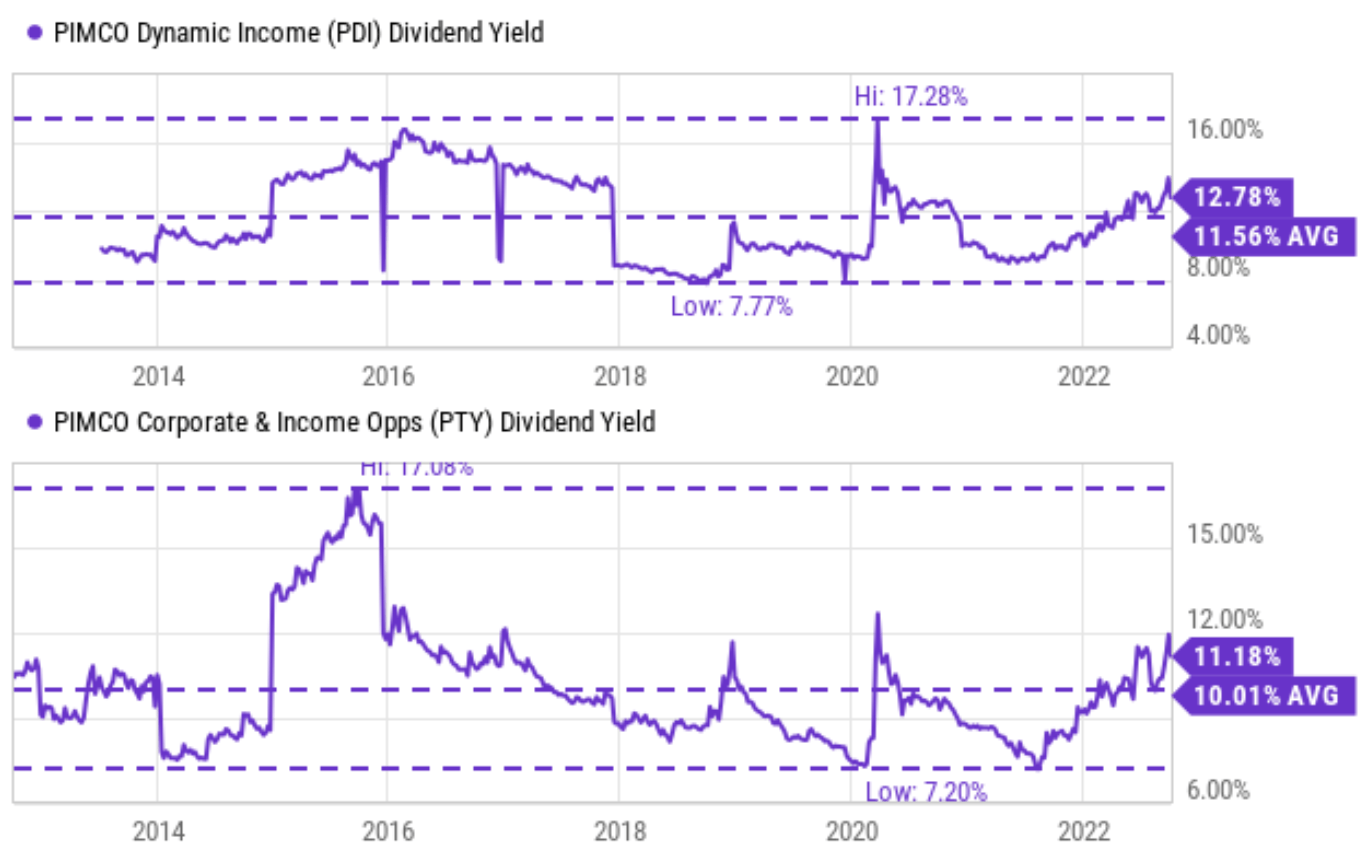
However, I see the following dilemma for both funds (which follow similar strategies as to be detailed in the next section).
- For income generation, their yields are not high enough to compensate for the current risks. The current macroeconomic conditions are not emitting favorable signals for the types of assets held in either fund. As we will elaborate on later, the yield curve inversion continues and would be very likely to further deepen. And at the same time, the yield spread between BAA Corporate Bond and 10-Year Treasury Constant Maturity bonds are towards the lower end historically, signaling high risk premium for high-yield bonds in general.
- And for capital appreciation, their allocation strategies are very likely to continue lagging behind the overall market. Both funds invest primarily in fix-income securities (high-yield corporate bonds, emerging markets sovereign bonds, et al), whose upward potential is capped. Both funds have lagged behind the overall market in the past in total returns. And I foresee the lag to continue given the macroscopic risks mentioned above and also the higher leveraging cost going forward.
PDI vs. PTY: basic information
Both funds are popular funds from PIMCO. For readers new to these funds, the following chart summarizes their basic information. PDI is a larger fund and has more AUM ($4.39B vs. PTY’s $1.38B). PDI also has a longer history than PTY. PDI was launched about 10 years ahead of PTY. Note that PDI also uses slightly higher leverage (48.17%) than PTY (41.24%). And finally, PDI also charges a much higher expense ratio (2.01%) than PDI (0.8%).
Source: www.cefconnect.com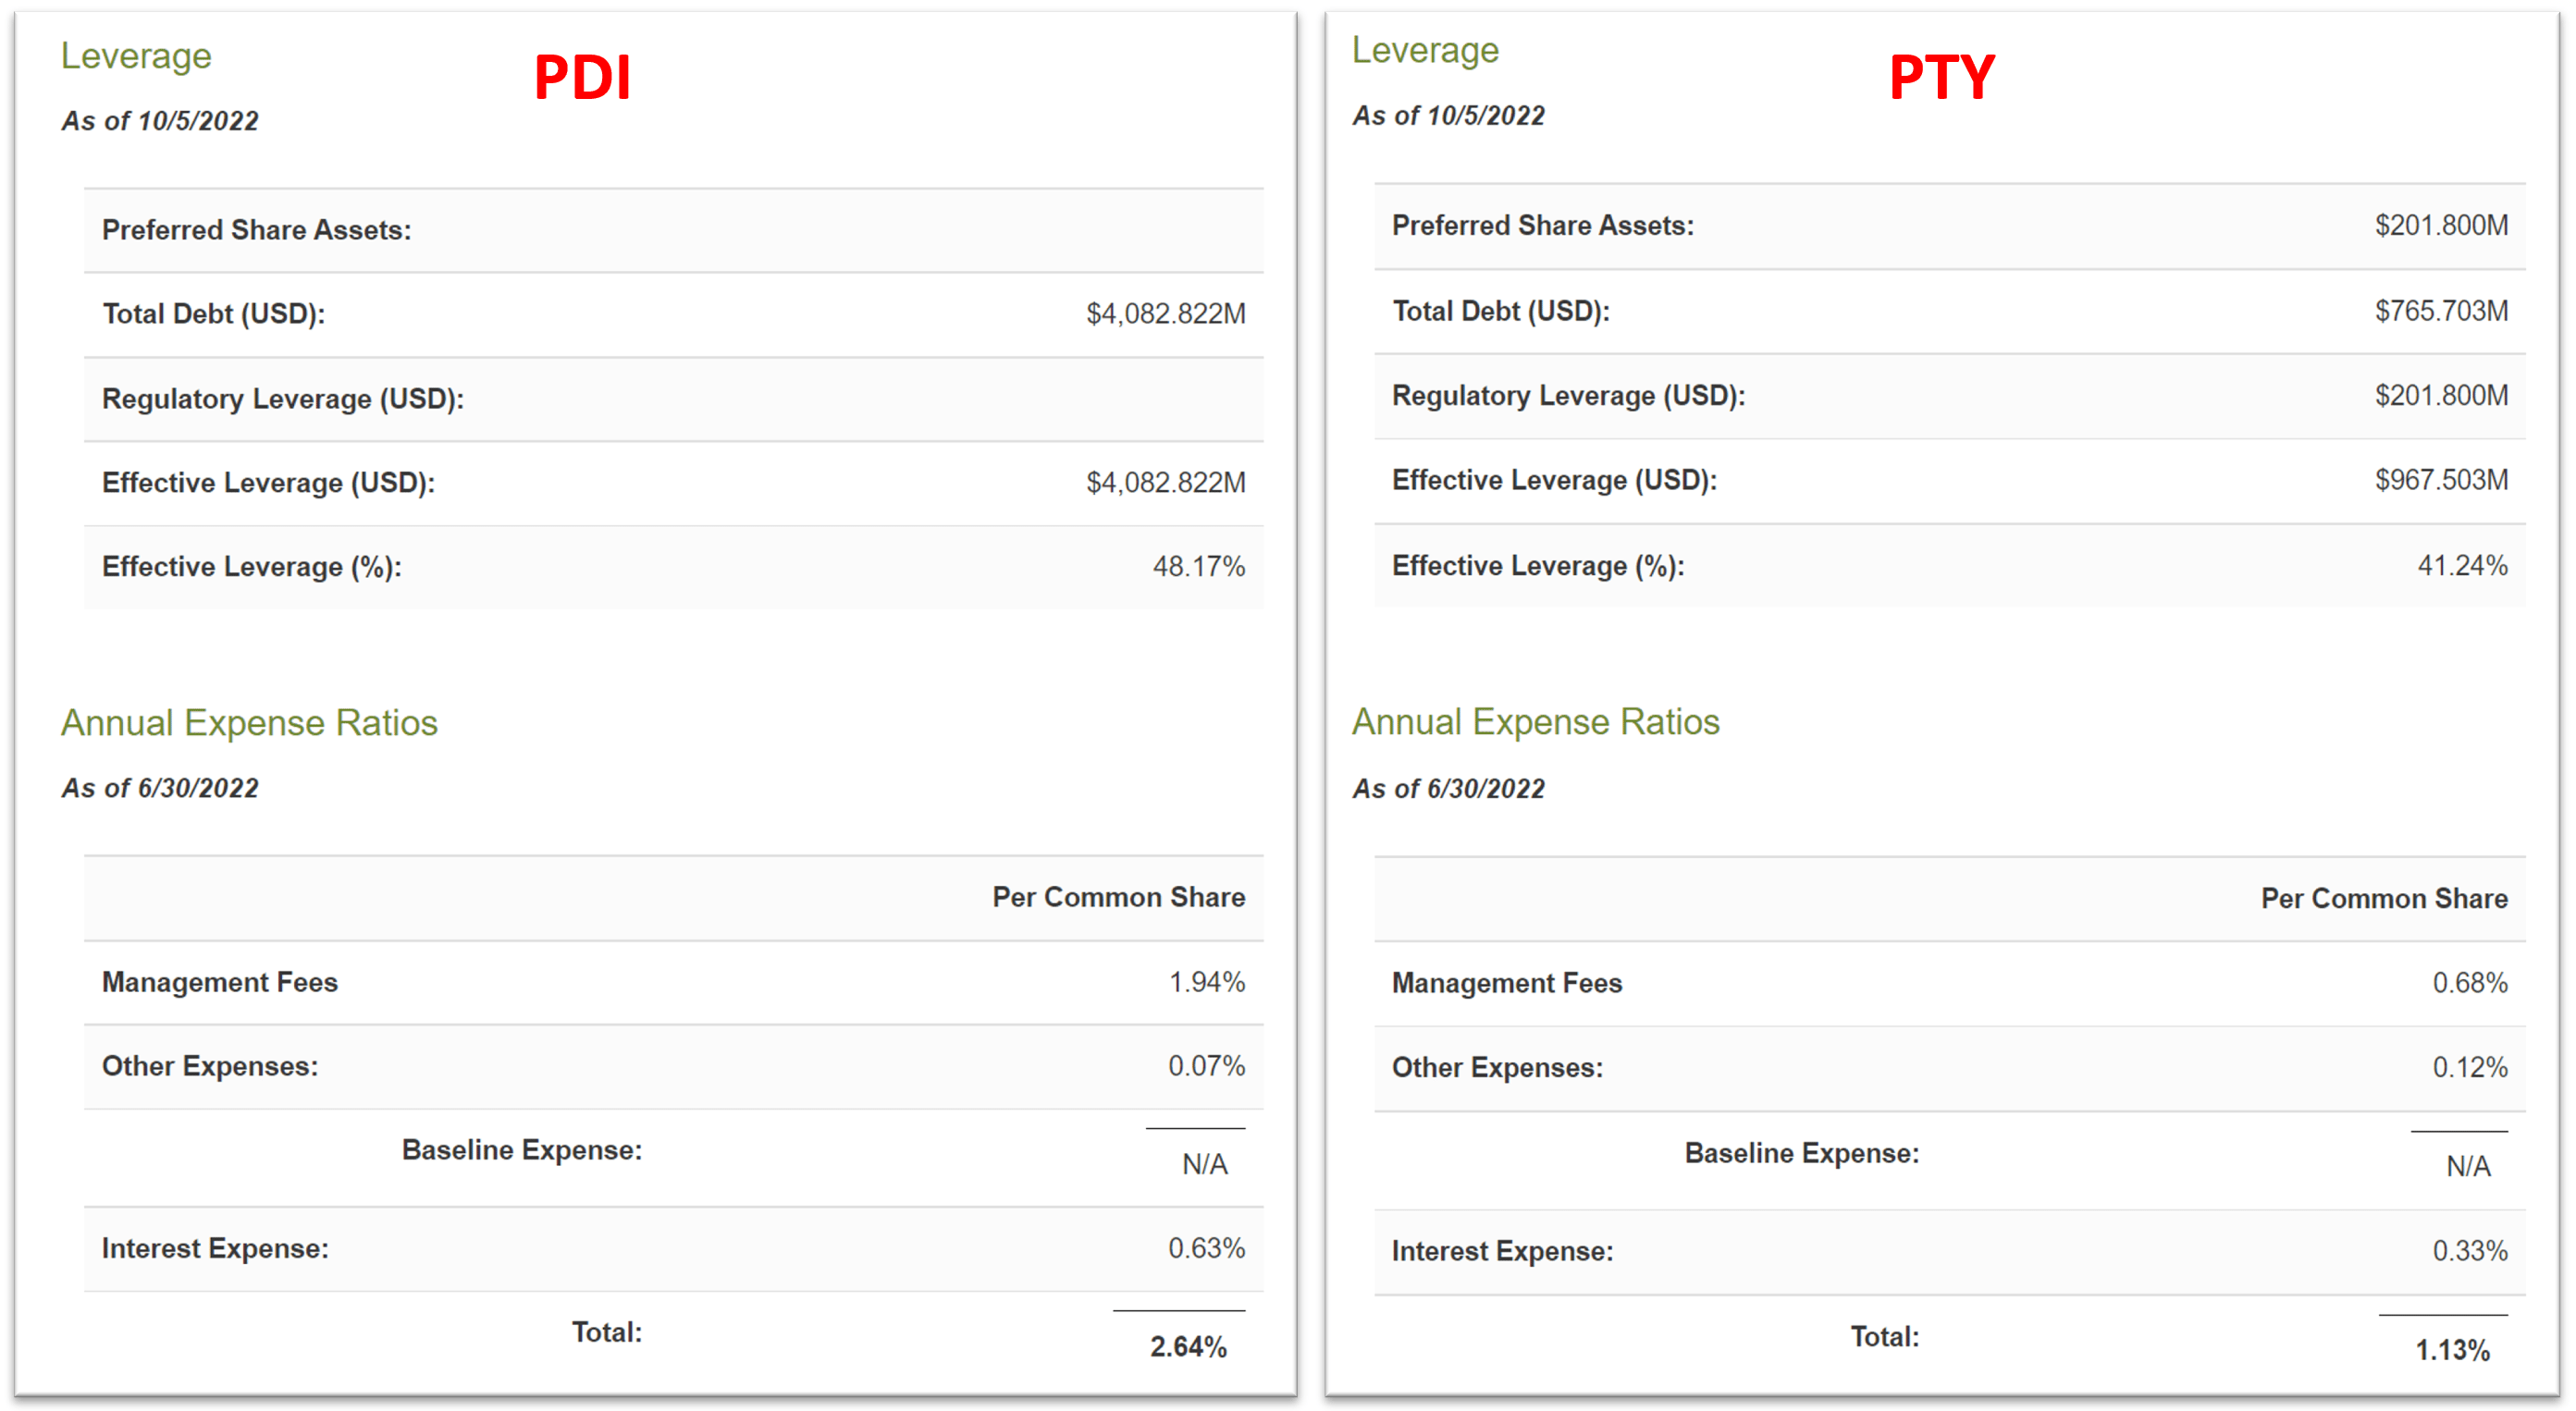
Despite the above differences, both funds invest in similar strategies as stated in their fund descriptions below. The emphases were added by me.
PDI seeks to achieve its investment objectives by utilizing a dynamic asset allocation strategy among multiple fixed income sectors in the global credit markets, including corporate debt, mortgage-related and other asset-backed securities, government and sovereign debt, taxable municipal bonds and other fixed-, variable- and floating-rate income-producing securities of U.S. and foreign issuers, including emerging market issuers.
PTY seeks maximum total return through a combination of current income and capital appreciation. The Fund seeks to achieve its investment objective by utilizing a dynamic asset allocation strategy among multiple fixed income sectors in the global credit markets, including corporate debt, mortgage-related and other asset-backed securities, government and sovereign debt, taxable municipal bonds and other fixed-, variable- and floating-rate income-producing securities of U.S. and foreign issuers, including emerging market issuers.
And next, you will see why I am cautious about these assets under the current macro ionic conditions.
Not the best mega signals for high-yield bonds
In a nutshell, I see the current signals from our macroeconomic environments as very troubling for fixed-income securities, especially high-yield corporate bonds. And here I will focus on two such signals: the inverted yield curve and the BAA-treasury rate spread.
First, the yield curve remains inverted. In my last article, I argued that:
… to fight the ongoing inflation, the short-term interest rates will need to rise to somewhere near 4% and long-term rates won’t rise too higher above that either. Because ultimately, long-term treasury rates cannot rise above either long-term GDP growth rates or long-term inflation rates. As a result, the yield curve is very likely to become inverted and remain inverted.
And indeed, the yield curve remains inverted since my last writing. And the inversion has actually deepened since then as you can see from the chart below. As of this writing, the 10-Year Treasury Constant Maturity is 0.39% below the 2-Year Treasury Constant Maturity.
Source: FRED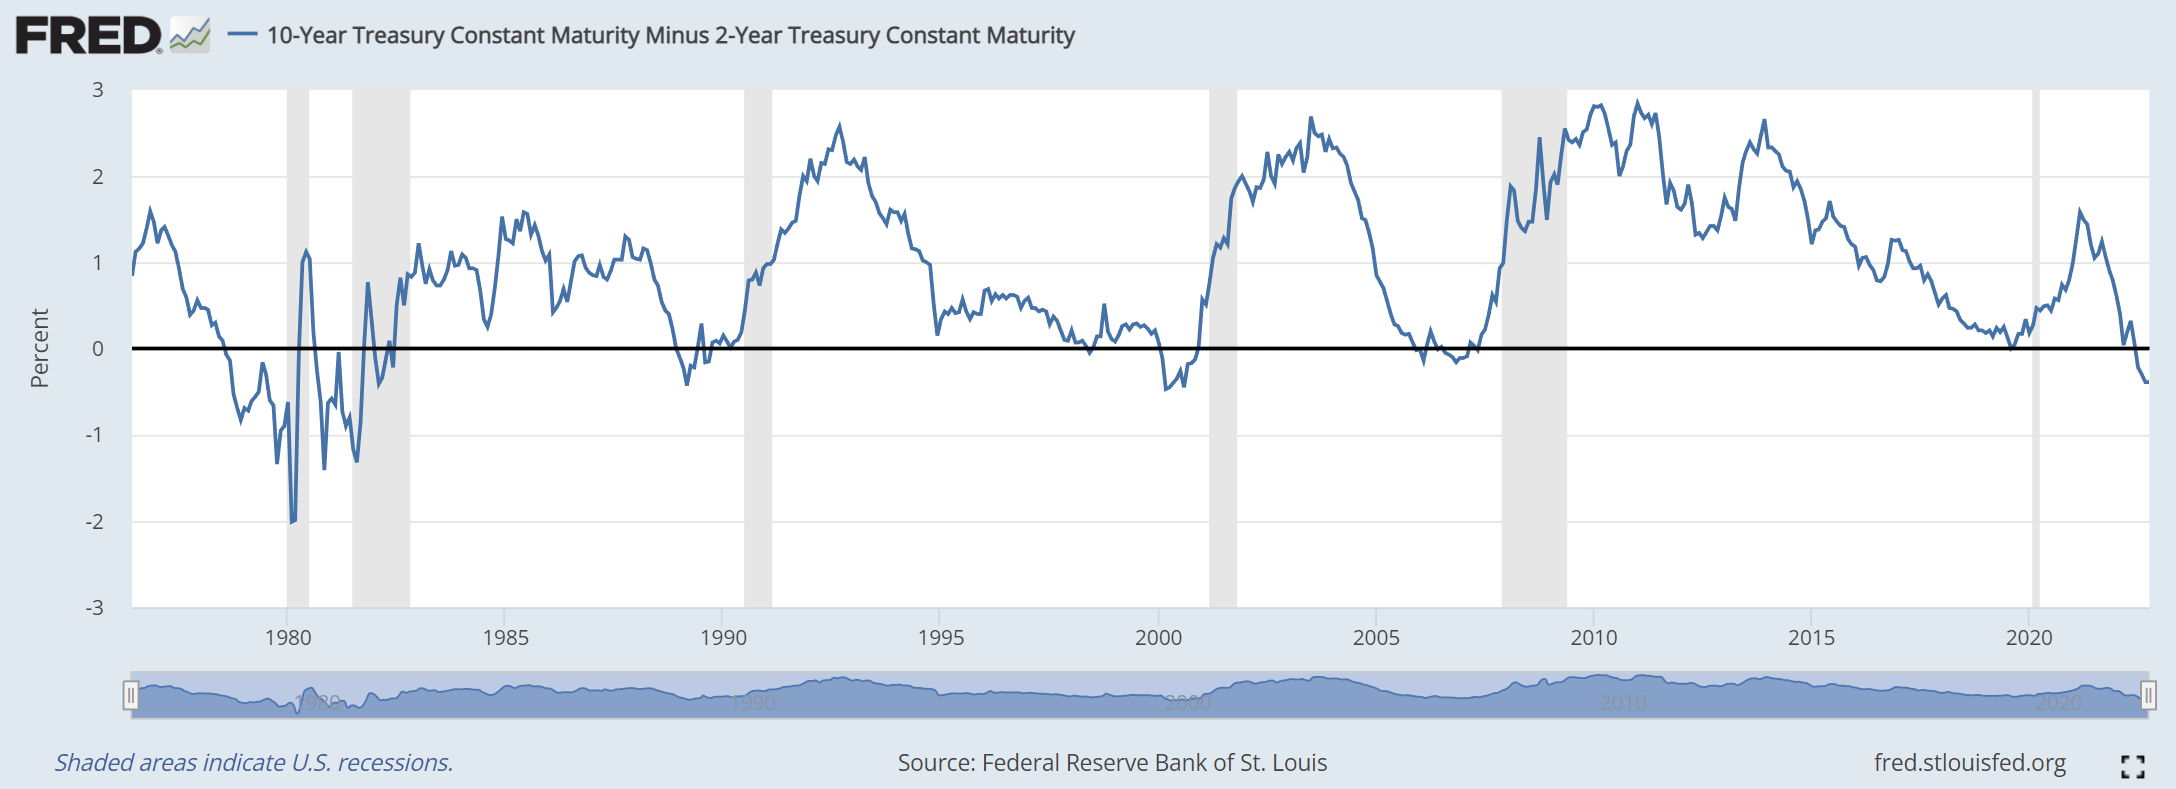
Second, the yield spread between BAA bonds and risk-free interest rates is quite narrow now. The chart below shows Moody’s Seasoned Baa Corporate Bond Yield Relative to Yield on 10-Year Treasury Constant Maturity. As seen, the yield spread peaked around ~ 4% in the past since the 1980s. However, currently, the BAA-treasury yield spread is only at 2.27%, closest to the thinnest end in about 4 decades.
To me, these two signals above show that the risk premium for high-yield fixed-income securities is quite high now. These funds would be hurt twice by such high-risk premiums. First, most of PDI and PTY’s exposures are sensitive to interest rates, and these assets will be under tremendous pressure as the yield curve remain inverted. Secondly, rising interest rates will also increase their borrowing costs (and both funds do use pretty high leverage as aforementioned).
Source: FRED and author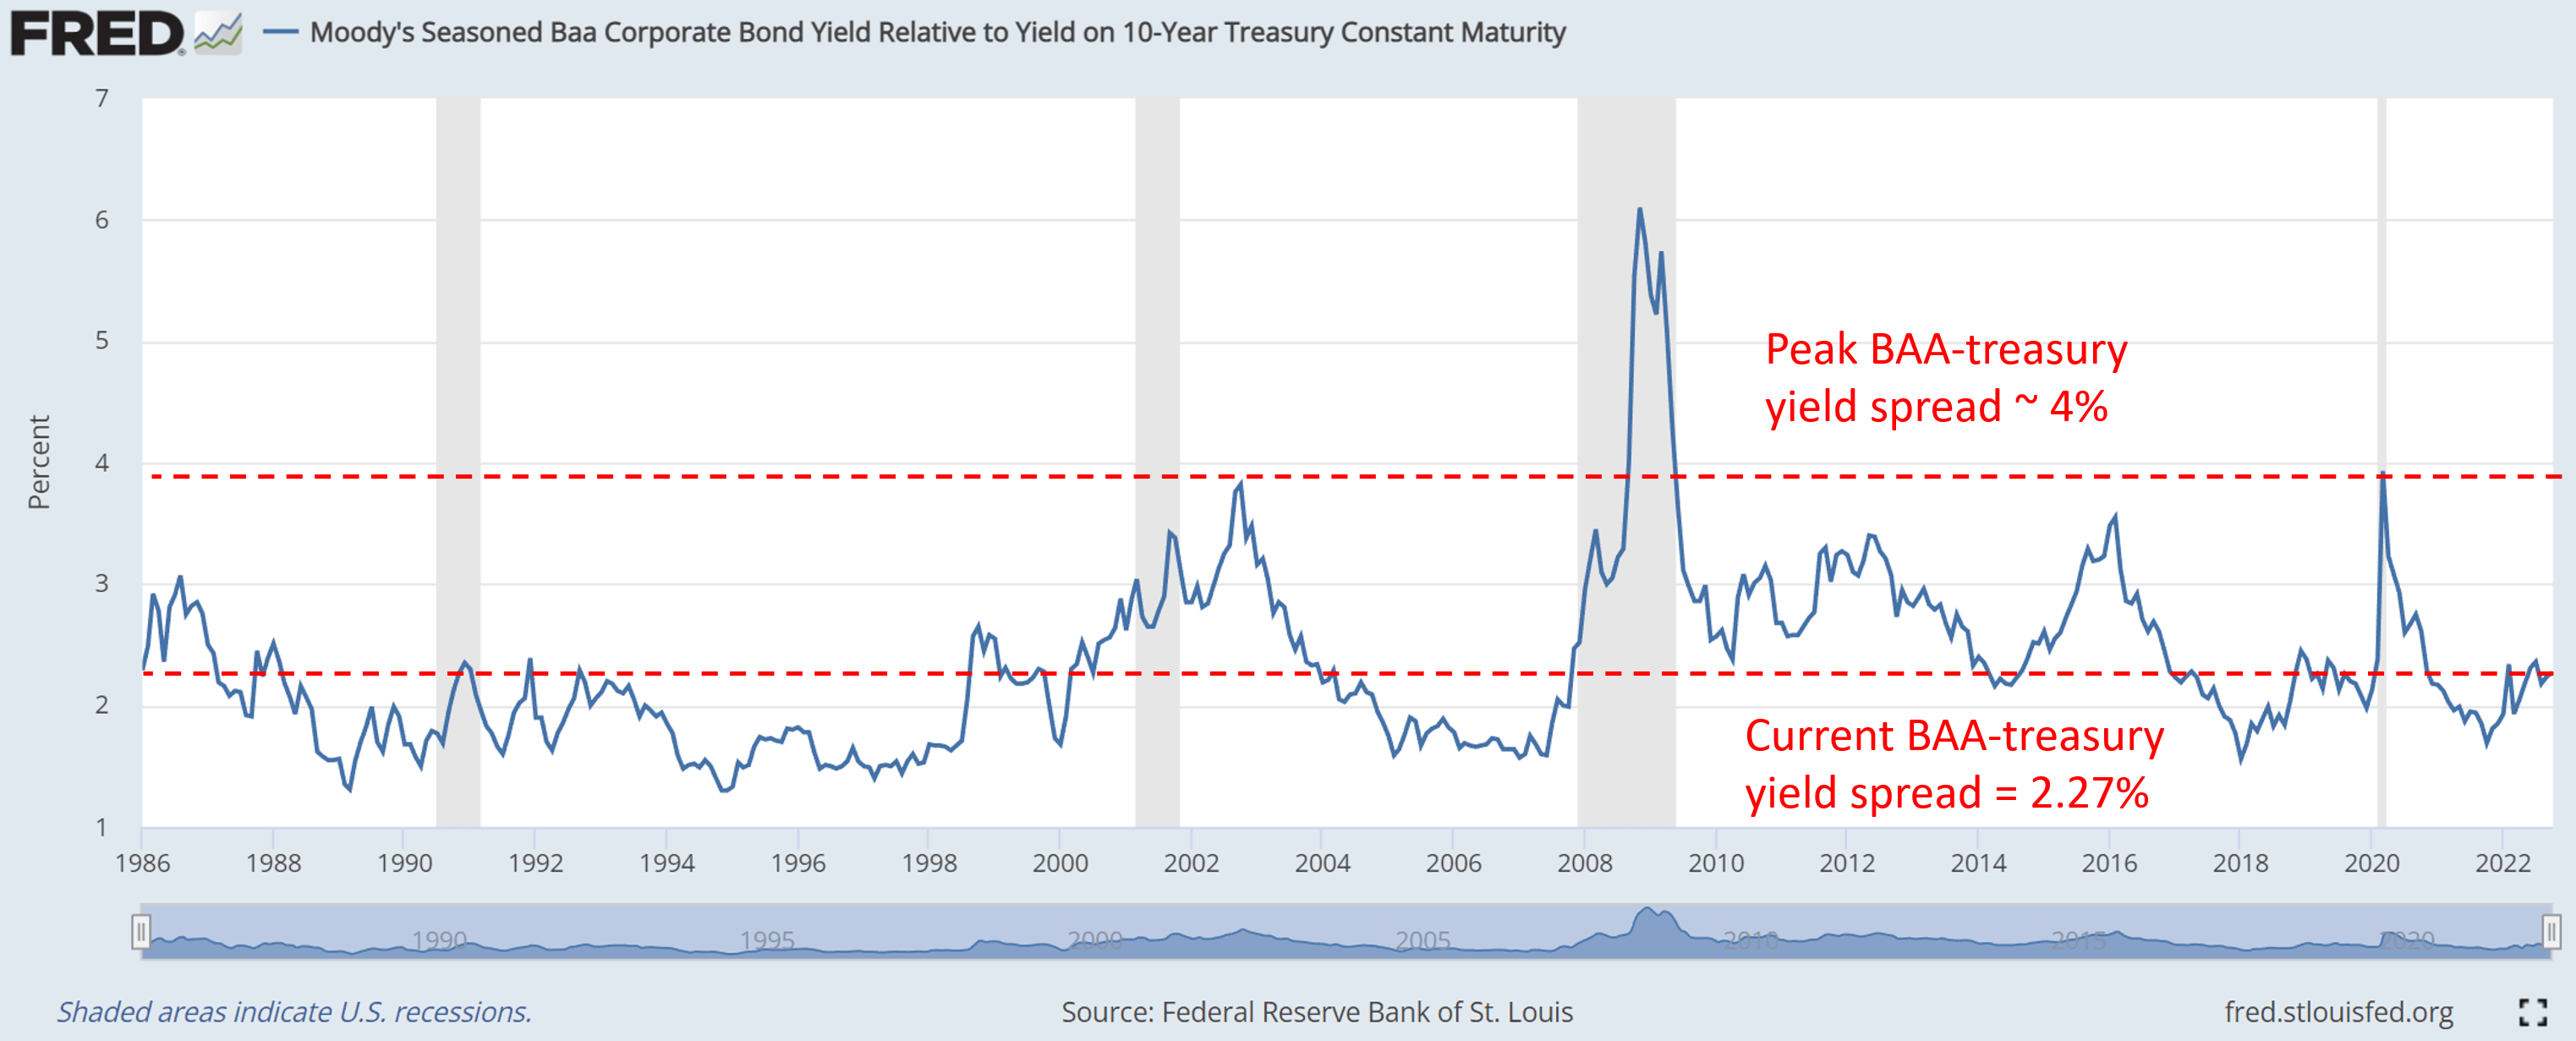
PDI and PTY: not the place to look for price appreciation
Unfortunately, PDI and PTY are not the places to look for price appreciation either (even though PTY’s goal statement says it “seeks maximum total return through a combination of current income and capital appreciation). Fixed-income instruments have a built-in cap on their upward potential as you can see from their past performance below.
Both PDI and PTY have delivered healthy total returns in the past (since PTY’s inception in 2012). As seen, PDI delivered a total return of 7.73% CAGR and PTY 5.91% (again, despite PTY’s goal to maximize total return via both income generation and capital appreciation). But both funds have lagged behind the overall market represented by the Vanguard 500 Index Investor fund as seen. The overall market delivered a CAGR of 11.91% during the same period, outperforming PDI by 420 basis points per annum and PTY by 600 basis points (in other words, more than double PTY’s return).
And remember, the above outperformance was achieved despite the fact that both PDI and PTY use substantial leverages. As a result of the leverage, both PDI and PTY have suffered higher volatility risks too. In terms of standard deviation, PDI’s volatility has been on average 14.8% and PTY 18.5%, both higher than the overall market’s 14.5%. In terms of maximum drawdowns, PDI’s 32% drawdown and PTY’s 36% are also substantially worse than the overall market’s 24% by a wide margin.
Going forward, I foresee the above trend (i.e., lower total return and higher volatility risks) to persist because of the fundamental reasons analyzed so far.
Source: Portfolio Visualizer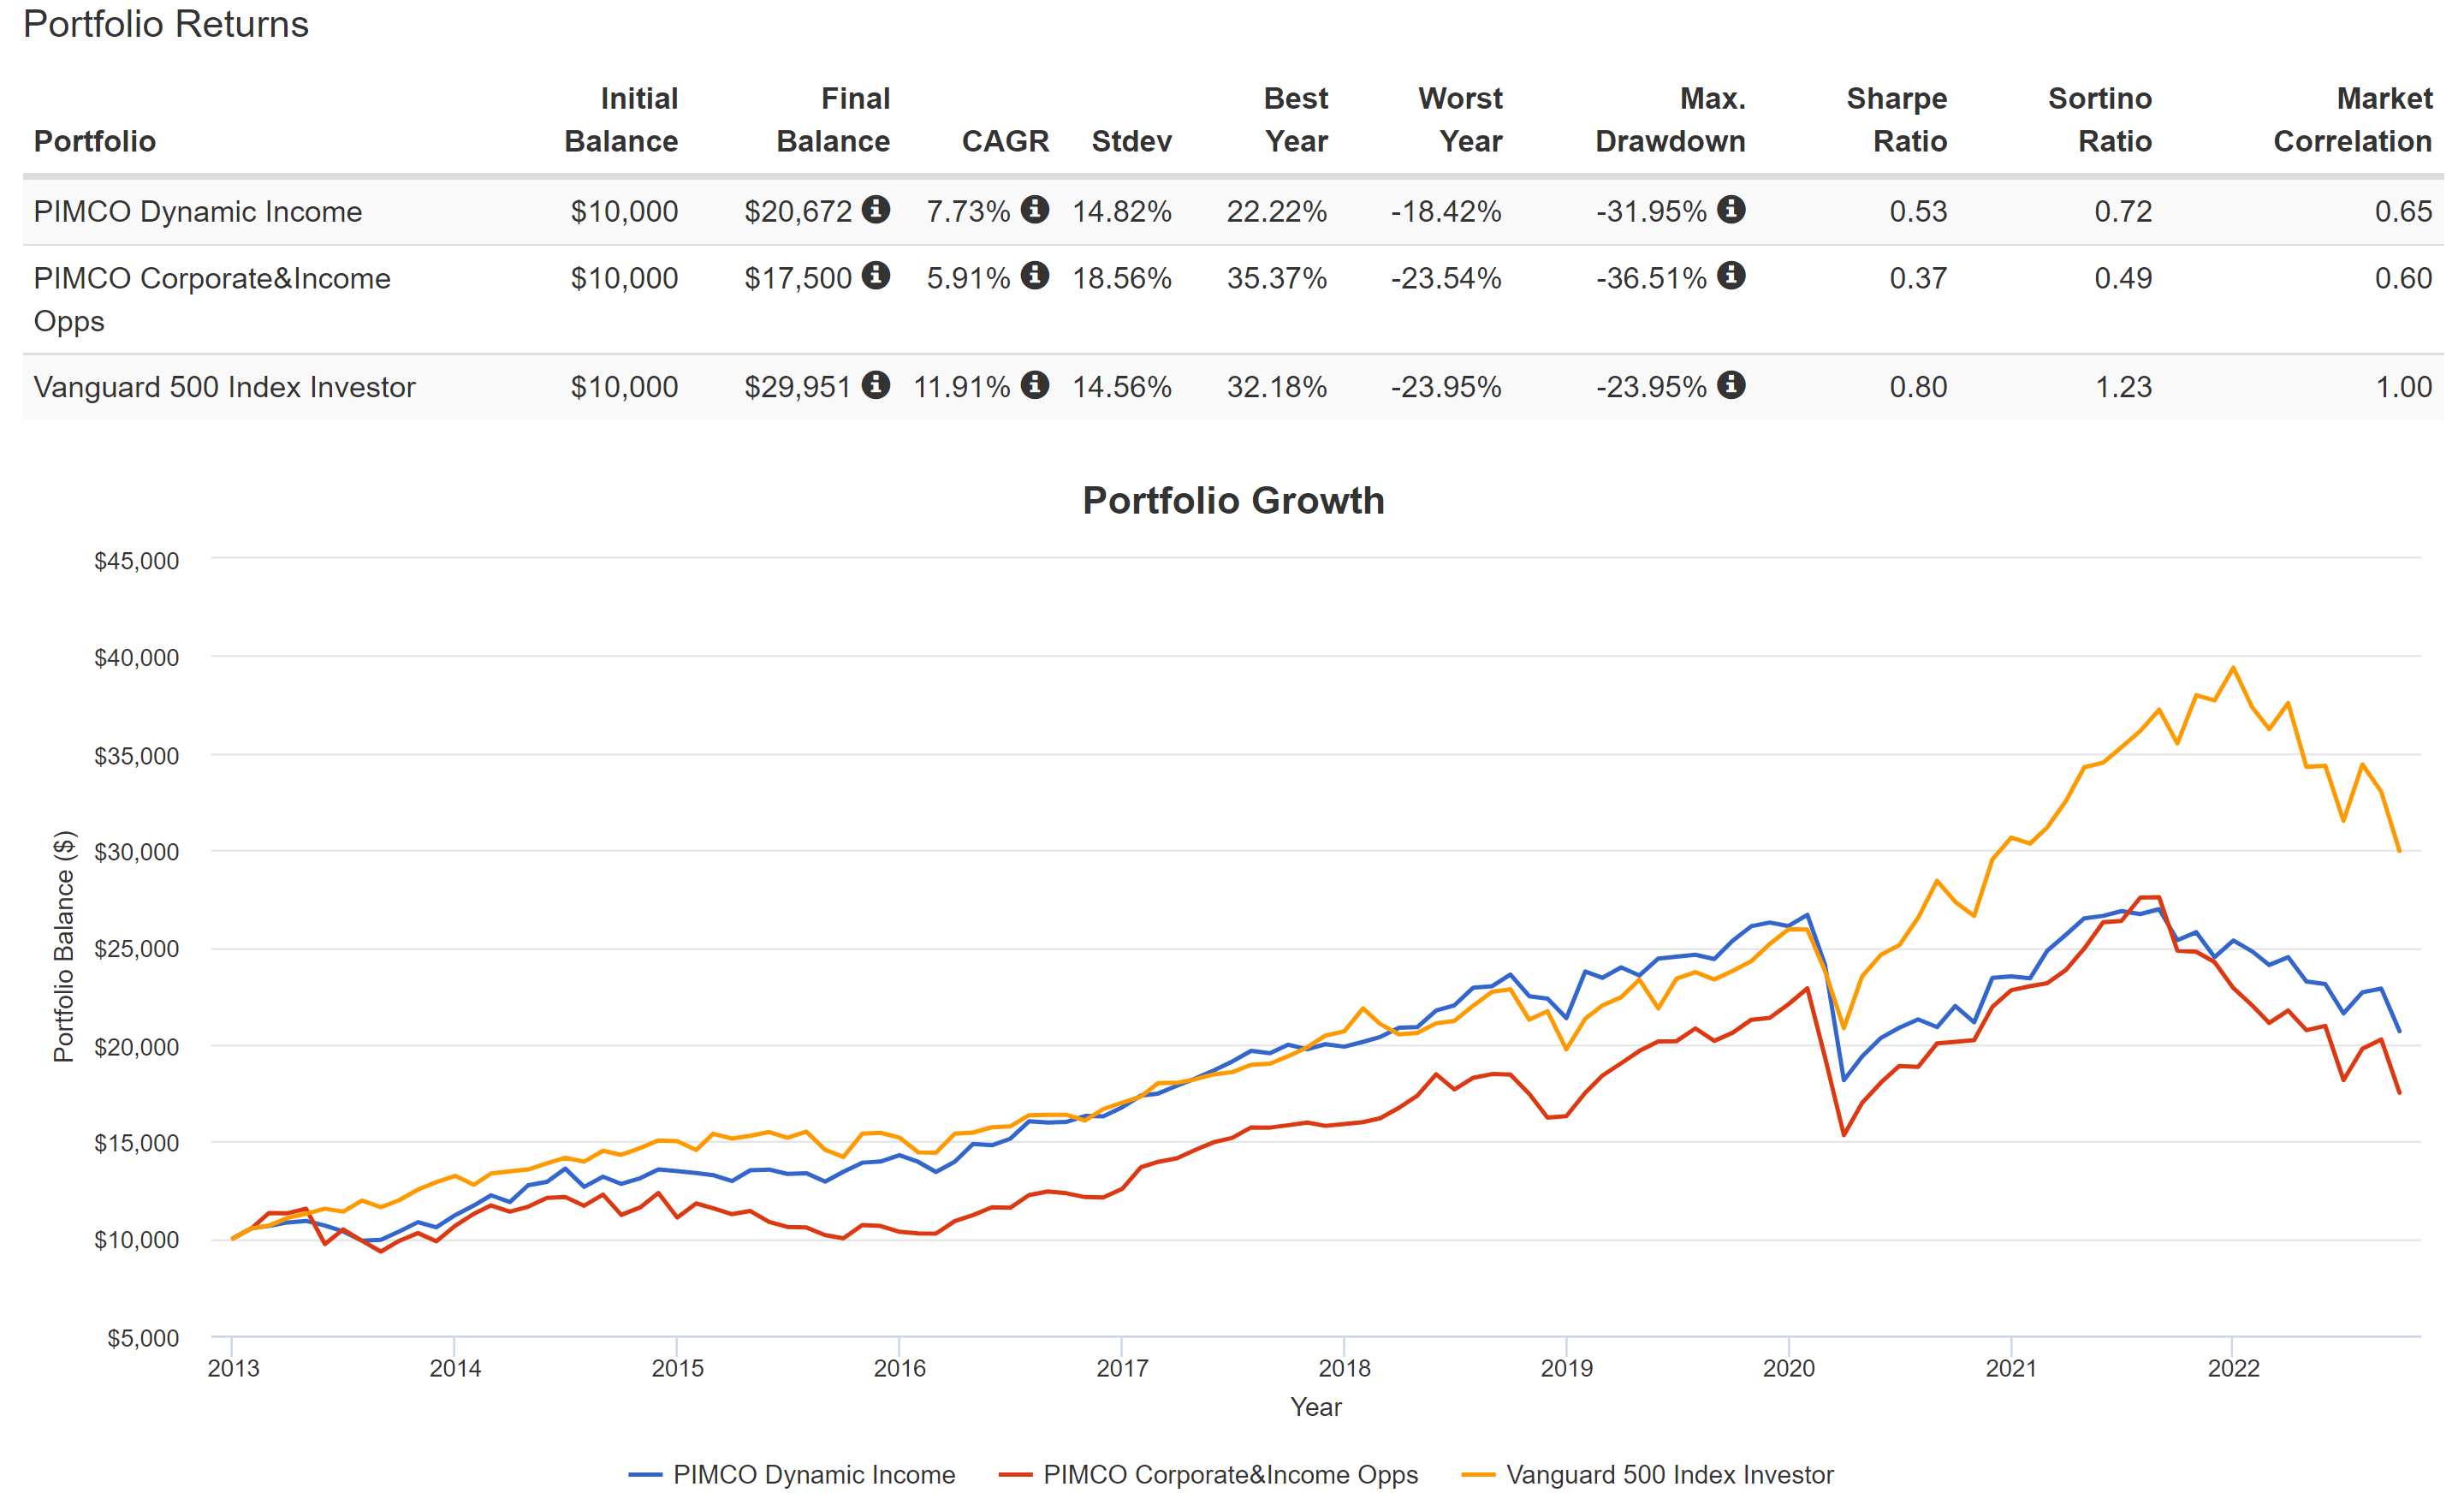
Other risks and final thoughts
To conclude, I see both PDI and PTY in a dilemma. For income generation, their yields are only about 10% above their historical average and are not high enough to compensate for the current risks. BAA bonds as a whole category bear too much risk premium in my view, considering that the BAA-treasury yield spread is only 2.27%, closest to the thinnest end in about 4 decades.
And for capital appreciation, their allocation strategies are very likely to continue lagging behind the overall market for several reasons. To recap, these reasons include the built-in cap for the upward appreciation of their assets, the sensitivity of their asset prices to rising interest rates, and also the use of substantial leverages amid rising interest rates
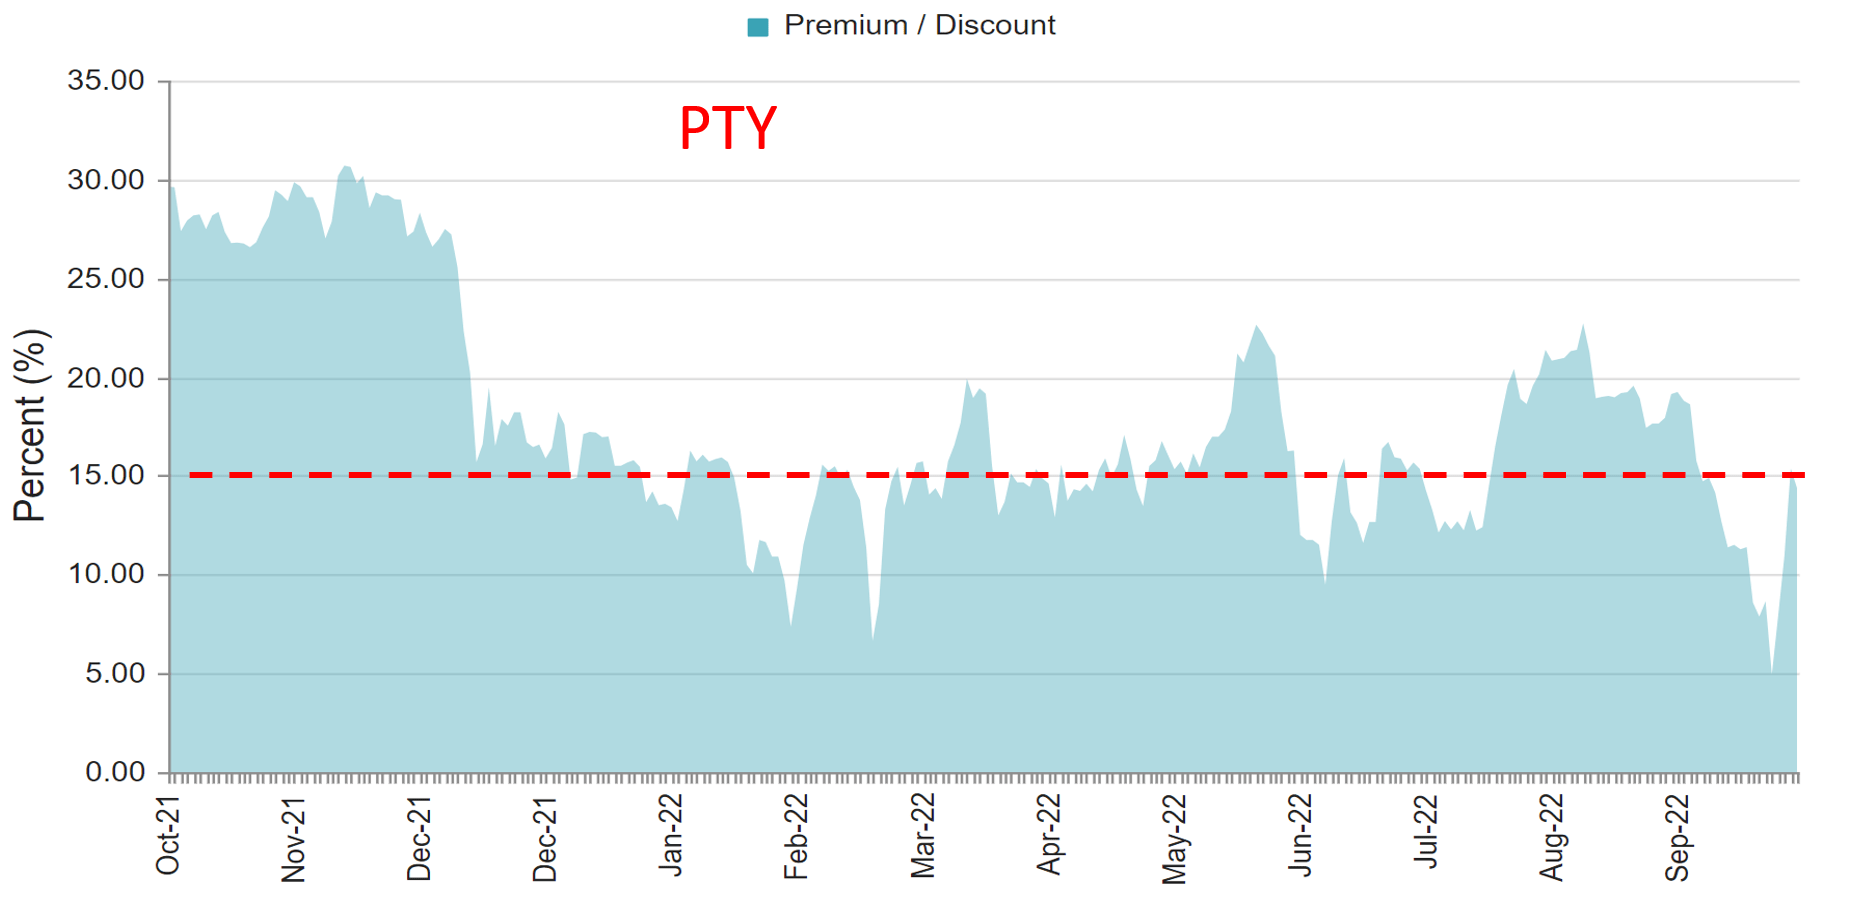
And as a final thought, these funds are also not cheap at the current prices. Both funds are selling above their NAV: PDI by 9.6% as of this writing and PTY by 15.4%. And as you can see from the following two charts, such levels of premium are among the highest level in the past year.
Source: www.cefconnect.com Source: www.cefconnect.com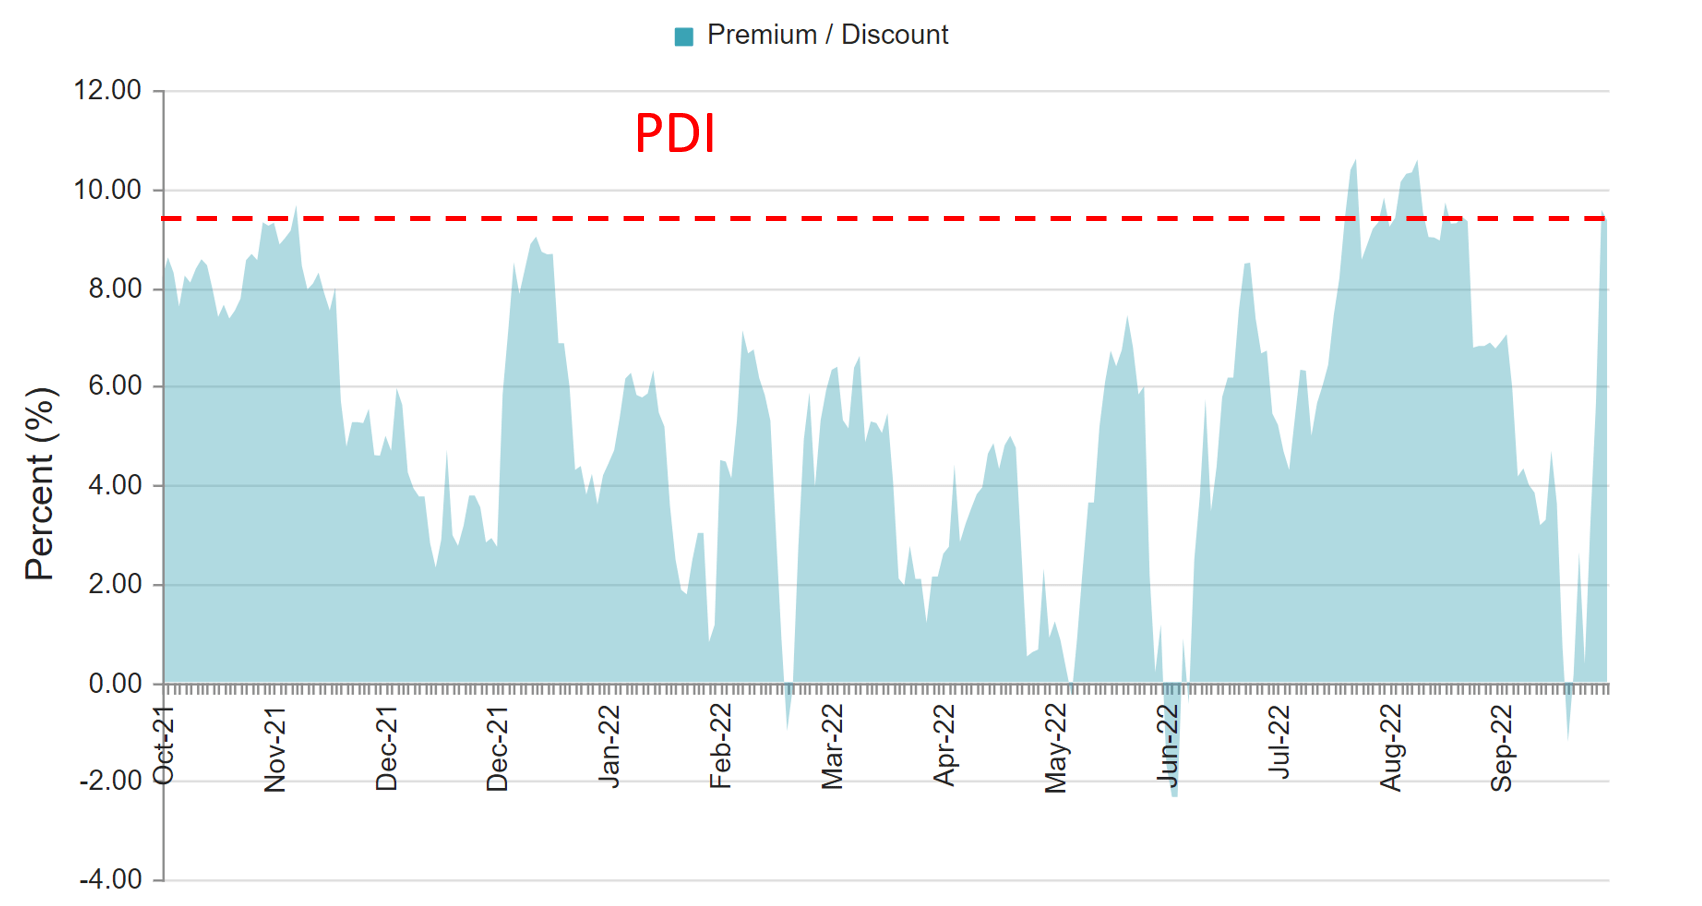
Be the first to comment