

Darren415
This article was first released to Systematic Income subscribers and free trials on Sep. 19.
In this article, we provide an update on the PIMCO CEF suite. Specifically, we discuss the changes in leverage and coverage for the month of August. In this article we highlight the recent large (PAXS) dividend hike, something we suggested was very likely in the July update. We also discuss how the interest rate swaps held by the taxable funds impact the level of income in a period of rising rates such as we are seeing now.
Leverage Update
After four months of steady decreases in taxable fund aggregate borrowings, they were not much changed in July. While most funds increased borrowings – the reason aggregate borrowings were roughly flat was that PDI is a much larger fund and it cut borrowings in August.
Systematic Income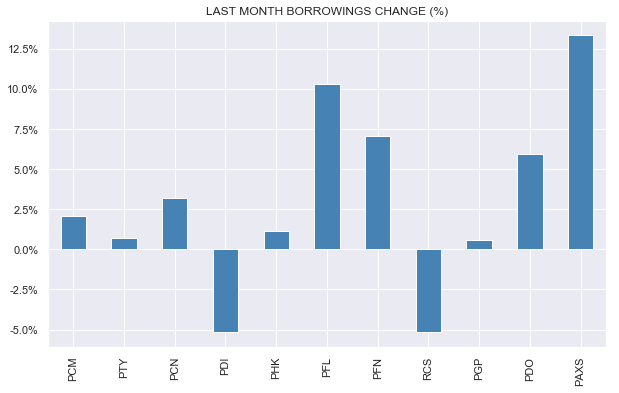
A big part of the reason for new borrowings stability was that fund NAVs held up reasonably well – the average taxable fund NAV fell less than 1%. Although that doesn’t seem very exciting it actually means August was the second best month of the year for the suite after July where the average NAV rose by over 2%.
Systematic Income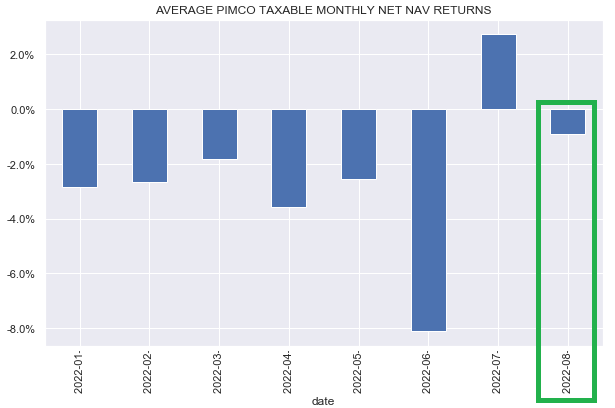
Despite the recent stability in borrowings, changes in borrowings over the past 12 months are quite sizable across the taxable suite. We exclude PDI as it merged over this period.
Systematic Income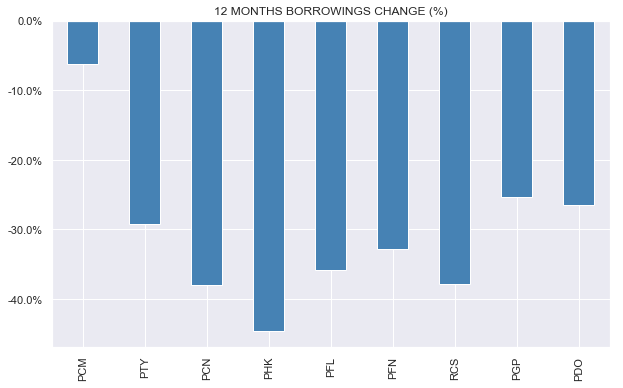
The combination of lower NAVs and an increase in borrowings for the average fund means that the average level of leverage also increased slightly in August.
Systematic Income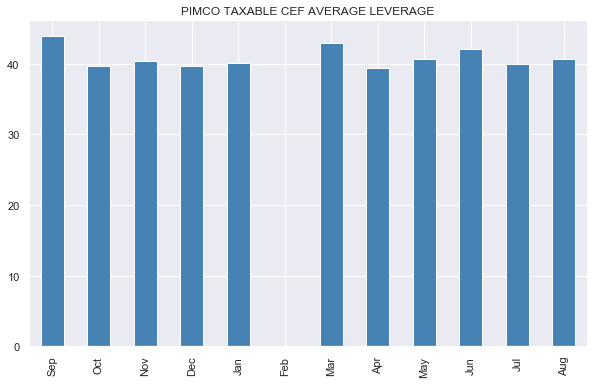
PCM and PDO remain as the highest-leveraged funds.
Systematic Income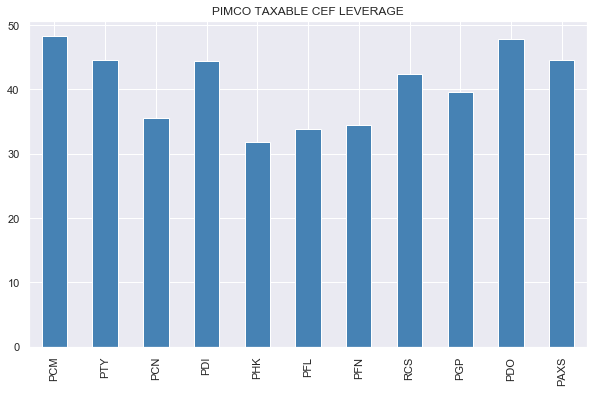
In the Muni suite, after a sizable cut in borrowings in July, there was not much action in August.
Systematic Income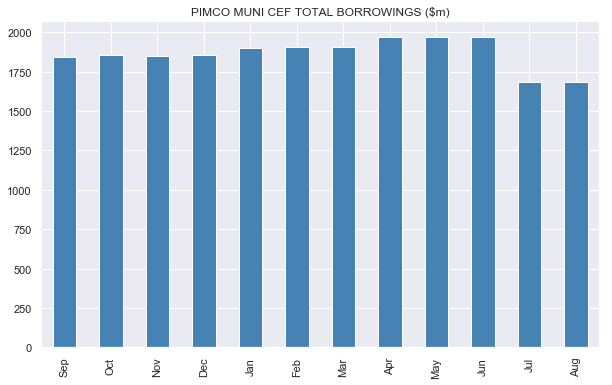
Coverage Update
August marked a good distribution coverage month for the taxable suite with all funds seeing a rise in the 6-month rolling figure. August was also the first month for PAXS to register its own 6-month rolling distribution coverage which came in at 146% – the third highest in the suite despite the recent distribution hike.
Systematic Income CEF Tool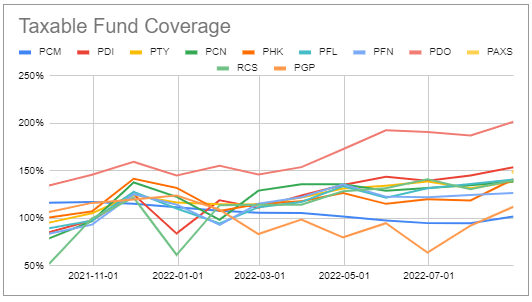
UNII levels were also positive for all taxable funds with PDO significantly ahead of the other funds. The chart shows normalized rather than absolute UNII figures according to the current distribution figure i.e. a UNII figure of 2 in the chart means the level of UNII is equivalent to 2 monthly distributions.
Systematic Income CEF Tool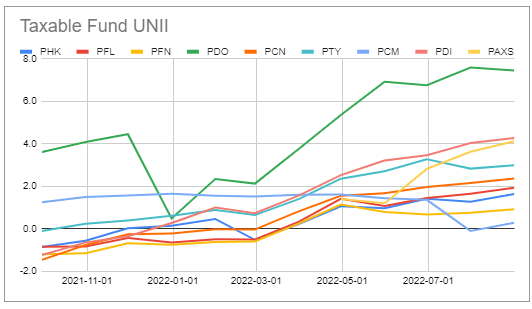
Muni coverage levels continued to fall on the back of higher leverage costs and the recent deleveraging across the suite. Unlike their taxable counterparts, Muni funds have primarily fixed-rate assets and so they are not able to offset the rise in their liabilities.
Systematic Income CEF Tool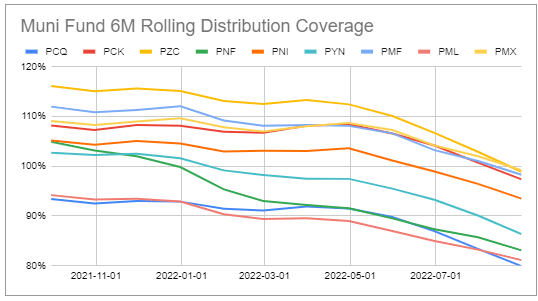
This chart shows the monthly leverage cost of the large Nuveen Quality Municipal Income Fund (NAD). This sharp increase in leverage costs remains a drag on Muni fund income levels.
Systematic Income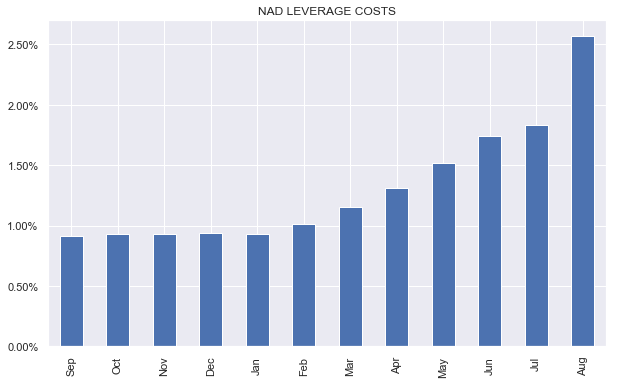
PAXS Hikes Big
In September PIMCO hiked the distribution of PAXS by a chunky 28%. In this section we highlight some of the reasons why we highlighted this as a very likely possibility in our last few PIMCO monthly reports.
First, as discussed earlier, the level of the NAV current yield goes a long way in explaining the relative distribution moves in the taxable suite. Specifically, funds with outsized NAV distribution rates (i.e. NAV current yields) tend to cut their distributions and vice-versa. As the table from our CEF Tool below shows PAXS had by far the lowest NAV current yield in the suite prior to the raise.
Systematic Income CEF Tool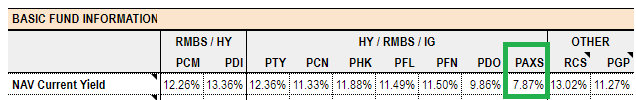
Secondly, PAXS has been busy lifting its leverage since its IPO. Needless to say, a rise in leverage will also lead to an increase in fund income, all else equal.
Systematic Income CEF Tool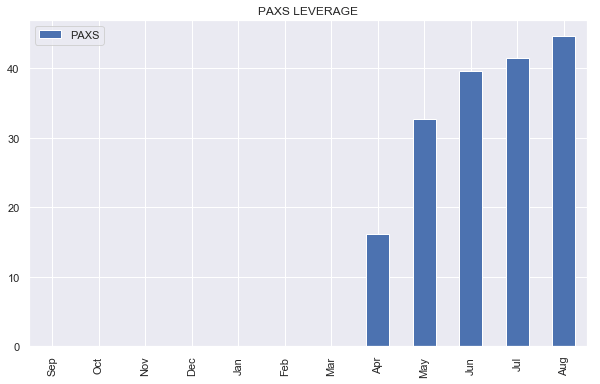
Three, prior to the hike, PAXS had the second highest three-month and fiscal-year distribution coverage. This is despite a relatively low level of leverage over this period.
PIMCO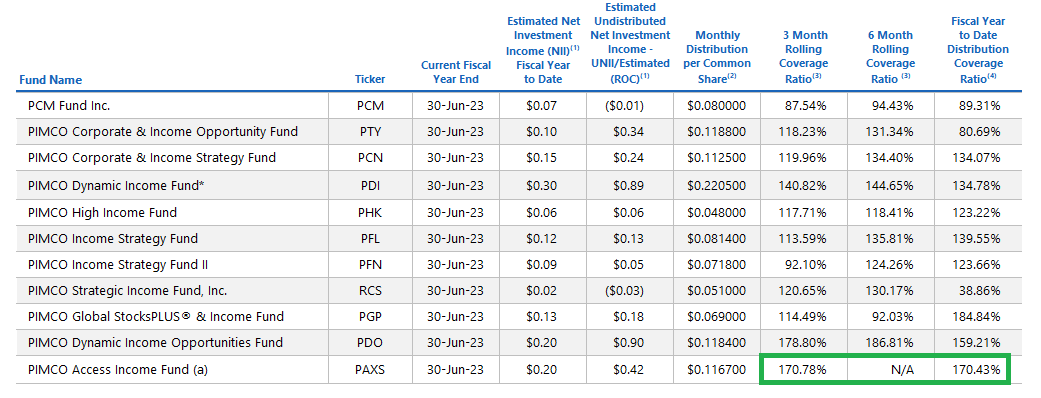
Finally, PIMCO UNII level jumped out very quickly to an unusually high level (equivalent to almost 4 monthly distributions prior to the hike) which suggested that the fund was very likely to declare a large special distribution and/or raise its distribution.
Systematic Income CEF Tool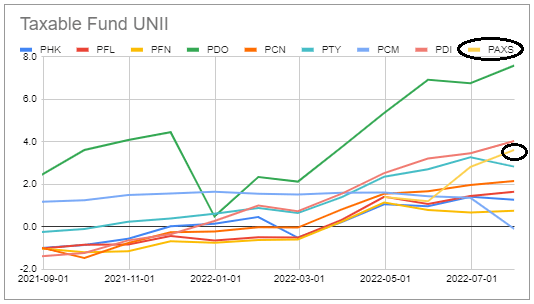
The pattern that is very common in the CEF space and that many investors are familiar with is that funds with lower distribution rates tend to trade at wider discounts and vice-versa. This is because many investors use fund distribution rates as a proxy for their level of income-generating capacity. However, because the two are not the same some investors can take advantage of this dynamic by allocating to funds that are underdistributing. This allows them to also enjoy potential capital gains when a given fund raises its distribution rate. This is because a fund that raises its distribution is typically rewarded with a tightening in its discount.
For example, this is how the discount of PAXS behaved relative to the average PIMCO taxable fund. The red line in the chart below marks the timing of the PAXS dividend hike. We see that the fund’s discount tightens relative to the PIMCO average.
Systematic Income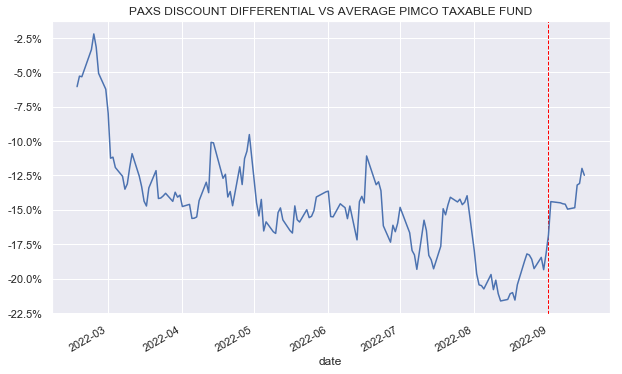
We saw something similar for PDO when its discount tightened relative to the PIMCO average after its own dividend hike a few months ago.
Systematic Income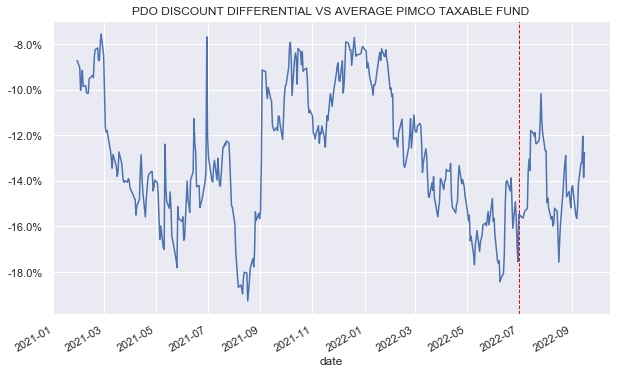
We took advantage of this dynamic twice in the last few months, by first focusing on PDO and then, after PDO hiked its distribution, reallocating in part to PAXS. This allowed us to capture two stages of outperformance in the taxable suite, first by PDO and then by PAXS.
We allocated to PAXS in late July when its discount diverged from that of PDO. It has since tightened past that of PDO and is somewhat expensive in our view given its slightly higher management fee.
Systematic Income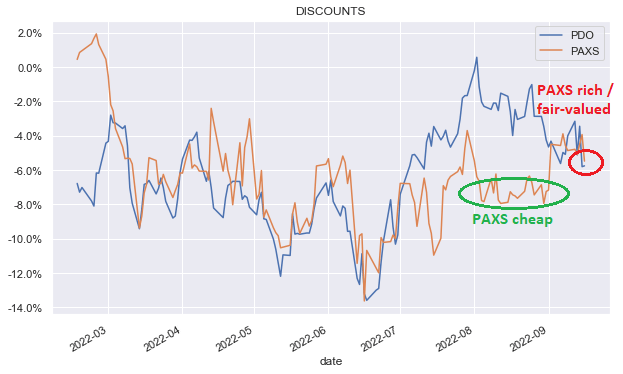
We have recently moved our PAXS allocation back to PDO as we see it offering somewhat better value at present.
Be the first to comment