


Edwin Tan/E+ via Getty Images
At the beginning of this year, I expected Healthcare REITs to slightly underperform the REIT average. Instead, they have slightly outperformed, as this chart from Hoya Capital Income Builder shows.
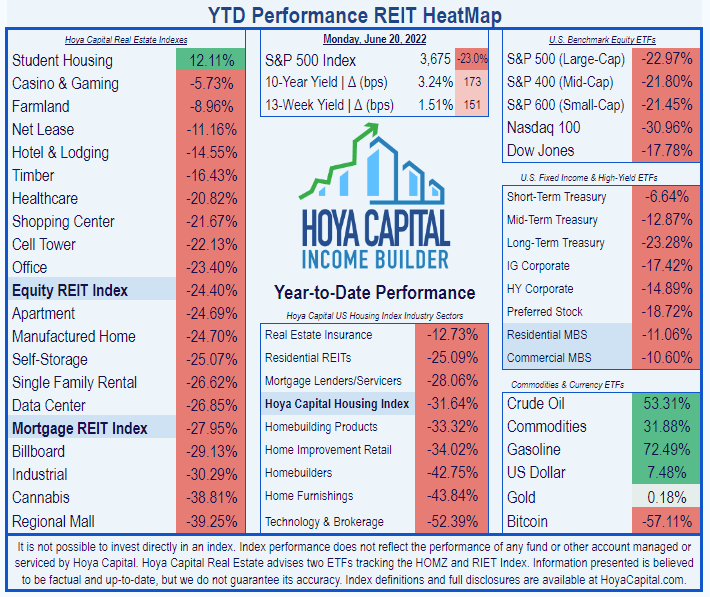
Hoya Capital Income Builder
Meanwhile, Physicians Realty (NYSE:DOC) has outperformed the Healthcare REIT average thus far in 2022, with a share price decline YTD of just (-8.74%).
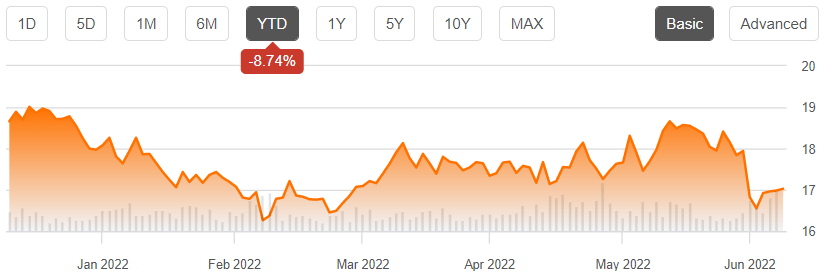
Seeking Alpha Premium
Which way is this company headed now?
Meet the company

Physicians Realty Trust
Headquartered in Milwaukee, this REIT began operations in 2013. DOC currently owns a portfolio of 291 properties spread across 41 U.S. states, sporting a 95% occupancy rate and a weighted average lease term of 6.2 years. According to the company’s June investor presentation, 98% of their Net Operating Income (NOI) comes from medical office buildings (MOBs). Nearly all of the portfolio (95%) is absolute-net or triple-net leased. The company’s market cap is $3.83 billion, right on the lower cusp of the Sweet Spot.
Company website
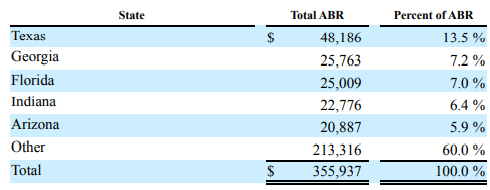
As the company’s name implies, the firm’s strategy is to focus on the doctor and his/her needs in serving the patient, so as to acquire and build medical office buildings that improve health care and lower real estate costs for the provider. It’s a win-win approach that keeps the investor firmly in mind. DOC specializes in outpatient facilities leased to leading healthcare systems. A full 65% of their tenants have investment-grade balance sheets and are spread across numerous specialties, with the greatest concentration in oncology, at just 13%. The top 10 tenants account for only 29.6% of DOC’s ABR (annual base rent).
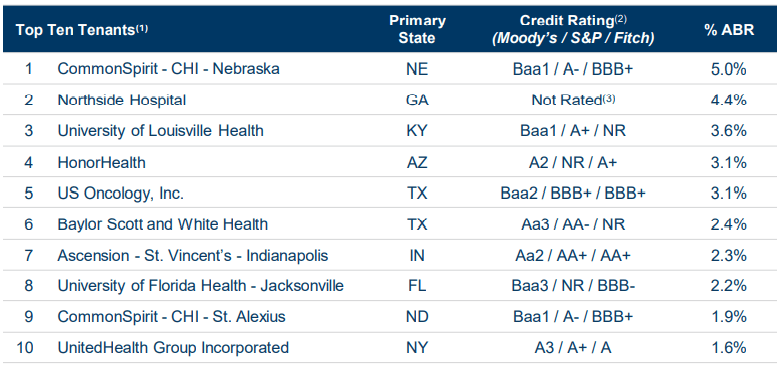
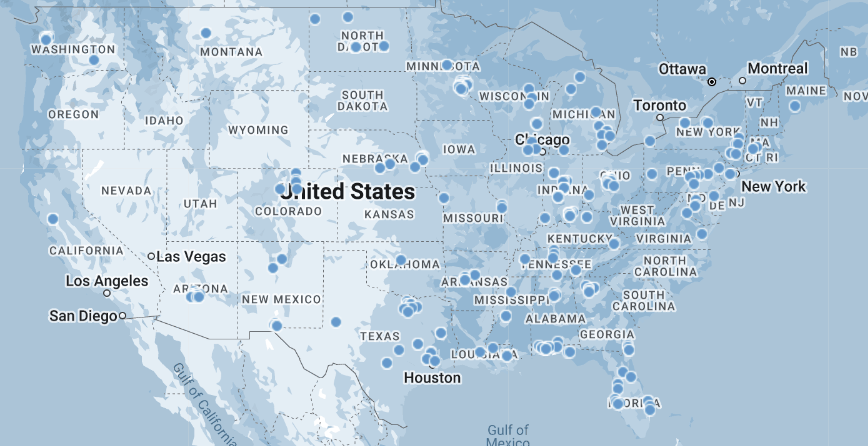
Company investor presentation
Although the majority of DOC properties are in the Eastern half of the U.S., the largest single state concentration for ABR (annual base rent) is in Texas at 13.5%, and Arizona is 5th largest at 5.9%.
Company 10-Q
Interestingly, the Institute of Real Estate Management (IREM) named DOC the 2021 Accredited Management Organization of the Year. That organization has been awarding that distinction for 75 years.
First quarter results
Here are the highlights from Q1 2022, according to the earnings call and company 10-Q:
- Renewal leasing spreads of just 2.1%, expected to rise to high-single digits in the second half of this year
- Revenues of $130.4 million, up 15% YoY (year over year)
- Expenses of $116.1 million, up 22% YoY
- Net income of $13.9 million, down 22% YoY
- Net income per share of $.06, down from $.08 YoY
- Cash from operations of $54.5 million, up 3% YoY
- FFO per share of $0.27, unchanged YoY
- Same-store cash NOI of $69.7 million, up 1.9% YoY
- Total NOI of $98.9 million, up 11.4% YoY
- EBITDAre of $81.6 million, up 11.8% YoY
- Disposed of one property for $2 million, at a 10% net loss on sale
- Issued 259,977 common shares using their ATM program at a weighted average price of $18.93, resulting in net proceeds of $4.9 million and share dilution of less than 1%.
- Only $22.9 million in acquisitions, at a year one cash NOI yield of 5.2%. If the company kept this pace for the entire year, it would be the slowest year of acquisitions in the company’s history. However, management is guiding for at least $160 million in investments, at first-year cash yields of 5.25% to 6.00%
CEO John Thomas had this to say about acquisitions:
Despite the interest rates that have accelerated in an unprecedented pace, seller expectations on cap rates have barely budged if at all limiting quarterly investments to $23 million as we maintain discipline in deploying capital in this volatile capital market.
According to the 10-Q for Q1 2022, the 22% increase in expenses was largely due to the following:
- Depreciation and amortization increased $10.6 million for properties purchased in 2021.
- Operating expenses rose $7.8 million, in part due to $1.0 million in increased utilities costs.
- Interest expenses went up $3.1 million. The issuance of the 2031 Senior Notes accounted for $3.4 million, and the issuance of new mortgage debt on acquisitions resulted another $0.9 million. This was partially offset by retirement of term loans on their credit agreement.
Growth metrics
Here are the 3-year growth figures for FFO (funds from operations), TCFO (total cash from operations), and market cap.
| Metric | 2018 | 2019 | 2020 | 2021 | 3-year CAGR |
| FFO (millions) | $202.6 | $190.6 | $221.7 | $228.4 | — |
| FFO Growth % | — | (-6.0) | 16.3 | 3.0 | 4.08 |
| FFO per share | $1.08 | $0.99 | $1.05 | $1.04 | — |
| FFO per share growth % | — | (-8.3) | 6.1 | (-1.0) | (-1.25) |
| TCFO (millions) | $208.7 | $201.2 | $233.3 | $247.6 | — |
| TCFO Growth % | — | (-3.6) | 16.0 | 6.1 | 5.86 |
| Market Cap (billions) | $2.92 | $3.59 | $3.70 | $4.14 | — |
| Market Cap Growth % | — | 22.9 | 3.1 | 11.9 | 12.34 |
Source: TD Ameritrade, CompaniesMarketCap.com, and author calculations
Market cap closed 2021 at $4.14 billion, just barely in the sweet spot, but has since slid to $3.83 billion.
DOC was scuffling a little in 2019, but really shone during the 2020 pandemic. FFO and TCFO have grown at plodding mid-single-digit CAGRs of 4.08% and 5.86%, respectively over the past 3 years, while FFO per share has been essentially flat.
Meanwhile, here is how the stock price has done over the past 3 twelve-month periods.
| Metric | 2019 | 2020 | 2021 | 2022 | 3-yr CAGR |
| DOC share price June 17 | $18.37 | $18.25 | $19.08 | $16.98 | — |
| DOC share price Gain % | — | (-0.7) | 4.5 | (-11.0) | (-2.59) |
| VNQ share price June 17 | $90.66 | $82.17 | $103.55 | $87.70 | — |
| VNQ share price Gain % | — | (-9.4) | 26.0 | (-15.3) | (-1.10) |
Source: MarketWatch.com and author calculations
Compared to the Vanguard Real Estate ETF (VNQ), the 3-year share price Gain for DOC has been just slightly lower. Even in blazing hot 2021, DOC shares gained only modestly. On the other hand, in the down years of 2020 and 2022, DOC’s losses were considerably smaller than the VNQ.
Balance sheet metrics
DOC’s balance sheet is investment grade at Baa2/BBB, and maintains a sturdy liquidity ratio of 2.37, well above both the Healthcare REIT average and the overall REIT average. The debt ratio and Debt/EBITDA are quite average.
| Company | Liquidity Ratio | Debt Ratio | Debt/EBITDA | Bond Rating |
| DOC | 2.37 | 32% | 6.7 | Baa2/BBB |
Source: Hoya Capital Income Builder, TD Ameritrade, and author calculations
As of March 31, the company reports $2.7 million in cash and cash equivalents, against total debt of $1.89 billion.
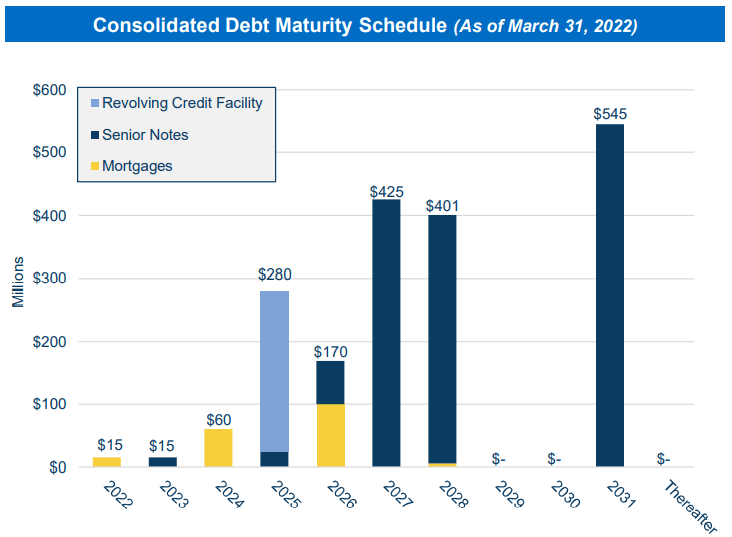
Company investor presentation
Near-term maturities are very favorable, with only $90 million due through 2024. In 2025 and thereafter, those numbers jump considerably.
Future minimum rental payments on non-cancelable leases average over $305 million, as shown in the table below.
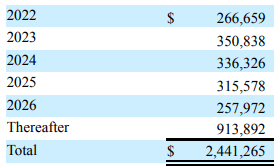
Company 10-Q
Dividend metrics
Physicians Realty Trust is a daring, above-average payer, but has not grown the dividend at all over the past three years. On the other hand, they neither cut nor delayed their dividend during pandemic-stricken 2020, as many Medical REITs did. Seeking Alpha rates the dividend a slightly risky D+, but that is about where it has hovered for quite a while, with no adverse effects.
| Company | Div. Yield | Div. Growth | Div. Score | Payout Ratio | Div. Safety |
| DOC | 5.42% | 0.0% | 5.42 | 90% | D+ |
Source: Hoya Capital Income Builder, TD Ameritrade, Seeking Alpha Premium
Dividend Score projects the Yield three years from now, on shares bought today, assuming the Dividend Growth rate remains unchanged.
Valuation metrics
Judged by Price/FFO and discount to NAV, DOC is slightly cheaper than the average Healthcare REIT and the average REIT overall, and pays a substantially better dividend. From a value investor’s perspective, it is a minor bargain.
| Company | Div. Score | Price/FFO | Premium to NAV |
| DOC | 5.42 | 16.3 | (-12.9)% |
Source: Hoya Capital Income Builder, TD Ameritrade, and author calculations
Investor’s bottom line
Physicians Realty is solid, stable, and unspectacular. It is just a sturdy, steady 5% yield. I rate this company a Hold, as do 11 of the 18 Wall Street analysts that cover DOC. Six of the other seven rate it a Buy or Strong Buy, and one rates it a Sell. The average price target is $19.43, implying 14.4% upside.
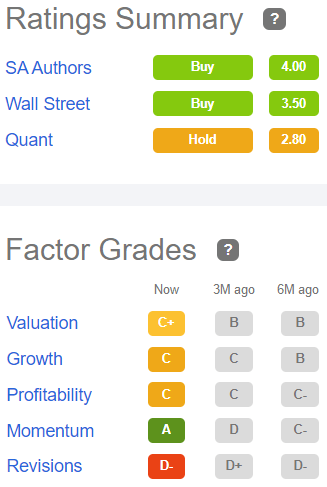
Seeking Alpha Premium
The Street and Hoya Capital Income Builder rank DOC a Buy, TipRanks is Neutral, and Ford Equity Research says Sell, as does revisions-sensitive Zacks.
Be the first to comment