

Khaosai Wongnatthakan
Thesis
During turbulent markets like the one that has been unfolding since the beginning of 2022, investors tend to explore alternative asset classes in order to diversify, reduce risk and perhaps even improve their return performance. iShares Preferred and Income Securities ETF (NASDAQ:PFF) offers investors exposure to an often underlooked part of a company’s capital structure, preferred shares. In this analysis, after an overview of the ETF is provided, its risk and return profile are more thoroughly examined.
Preferred Shares Investing
Preferred shares often slip investors’ attention when it comes to diversifying across different asset classes. While technically it could be argued that preferred shares fall in the equities asset class, in reality, their unique characteristics render them a special classification.
Preferred shares are widely considered hybrid securities, incorporating bond and equity characteristics. While they pay fixed dividends in perpetuity, they remain lower in payment priority than bonds and other debt instruments, being more senior in the capital structure only to common shares. Even though they are perceived to be less risky than common stock, both corporate and treasury bonds are safer investments. While uncommon, preferred dividend payments might be missed or delayed, unlike coupon payments of a bond (except in cases of default).
Fund Overview & Characteristics
iShares Preferred and Income Securities ETF offers investors exposure to this specific, hybrid tier of capital structure and is by far the most popular fund in the space with $16B of Assets Under Management. PFF offers an attractive alternative to high-yield bonds, with a TTM income yield of 4.64%, considerably higher than the average market dividend yield and treasury yields as well. Income distributions occur monthly.
On the other hand, the ETF charges a considerably high 0.46% expense ratio, while most bond and equities ETFs charge less than 0.10%. A higher expense ratio will decrease overall returns, leading to significant losses, especially over prolonged periods of time, as the compounding effect gets to work.
Currently, the fund maintains 494 holdings and is heavily weighted towards the financial sector (64% exposure), industrials (22%) and utilities (13%). All other sectors combined account for less than 3% of total weighting. Some of the ETF’s largest holdings include Wells Fargo (WFC), JPMorgan Chase (JPM), Bank of America (BAC), NextEra Energy (NEE) and Broadcom (AVGO).
Historical Performance & Risk Profile
Employing the tools offered by Portfolio Visualizer, in this segment, I attempt an in-depth look into the find’s historical performance and comparative attractiveness. Annual rebalancing and dividend reinvesting are assumed in the simulation.
Since 2007, when PFF was incepted, a CAGR of 3.90% has been recorded compared to the 9.325 for the S&P 500. PFF also carried a 16.59% standard deviation (15.76% for the S&P 500) and had a maximum drawdown of -56,62% (-50.80% for the S&P).
While these metrics may be negatively skewed since PFF is heavily weighted toward financials and the reference period includes the 2008 financial crash, still, they indicate that the fund has performed poorly overall, during a period (2010- 2021) where the stock markets enjoyed tremendous gains. A $10,000 initial investment in PFF would have yielded almost $18,000 at the end of the 13+ years period, while an S&P 500 ETF would have returned around $39,000.
Portfolio Visualizer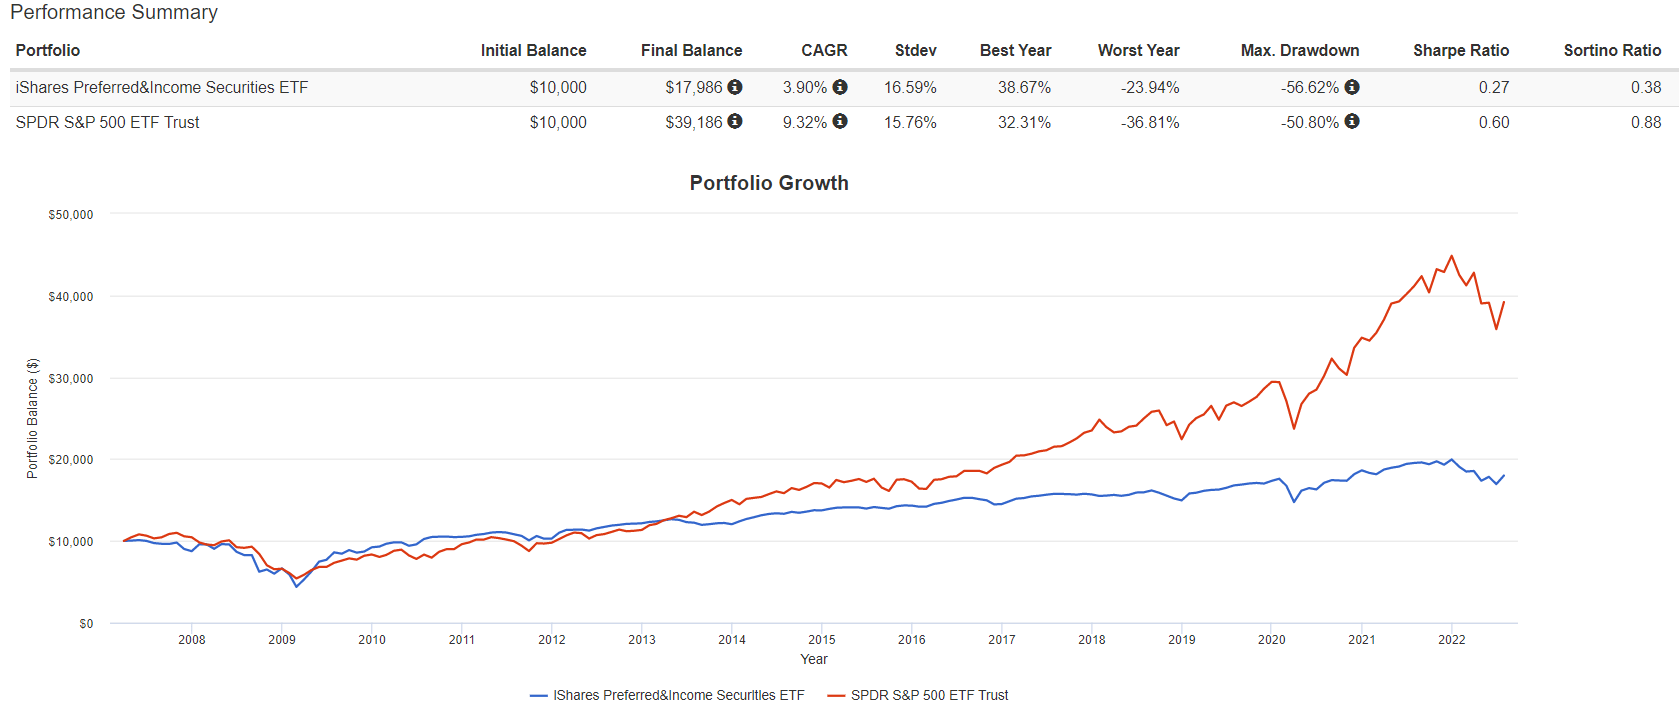
In order to further explore the fund’s relative attractiveness, I compare and contrast risk and return profiles across a handful of ETFs ranging from iShares Core US Aggregate Bond ETF (AGG) to SPDR’s High Yield Bond ETF (JNK). The fund selected represent alternative choices for investors looking to diversify away from common equity investing and offer different risk profiles. Here, the simulation and therefore the data extracted date back to 2010.
In terms of average annualized returns, PFF actually places 2nd in the group (1st if we exclude the S&P 500 ETF), with a 5.91% CAGR. For reference, AGG records a 2.49% CAGR for the same time period, while the high yield JNK reaches 5.12% and is the only one approaching the return levels that PFF offers.
With greater returns, however, comes more risk, as PFF displays higher volatility (8.50% standard deviation) compared to all bond ETFs. It has also recorded the worst maximum drawdown (16.20%). Despite its elevated risk levels, risk-adjusted returns metrics like the Sharpe and the Sortino ratios once again place PFF at the top of the list. PFF carries a 0.66 Sharpe and 1.01 Sortino ratios, while the second highest ratios (with the exception of SPY) are recorded by JNK (0.58 and 0.86).
Portfolio Visualizer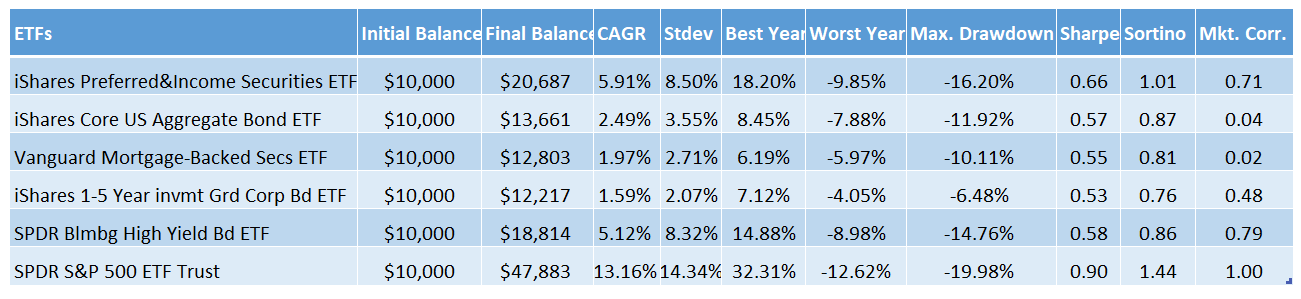
What this 12-year simulation shows is that while PFF cannot compare in terms of performance with equity ETFs, it actually appears superior to bond funds. Of course, it could be argued that bond ETFs carry less risk overall, but even the more risky, high-yield JNK ETF, falls a bit short in the comparison. Another thing to note, however, is the fact that PFF carries a higher expense ratio than all the ETFs included in the comparison.
Final Thoughts
After all things are considered, investing in Preferred equity through an ETF like PFF seems to result in underwhelming performance compared to common equity ETFs. Where preferred shares appear to maintain a competitive edge compared to bond ETFs, even high-yield ones. With that view in mind, and mostly for more mature portfolios, set-up for income generation, PFF carries some attractive qualities.
Be the first to comment