


metamorworks/iStock via Getty Images
Quick Introduction to Business Development Companies (“BDCs”)
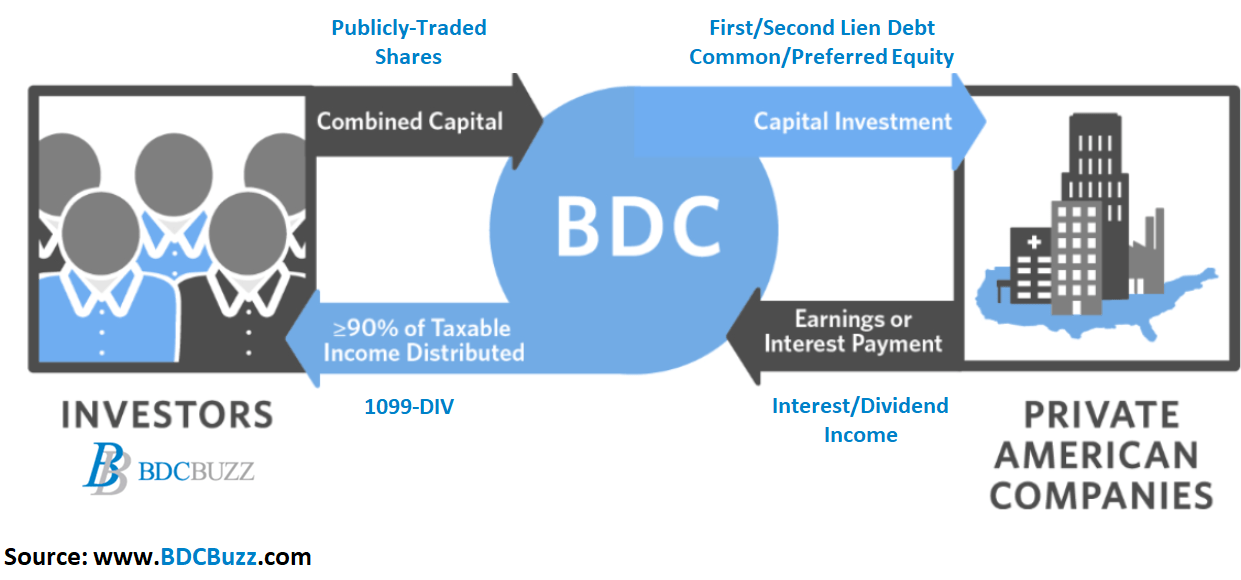
Business development companies (“BDCs”) invest shareholder capital in privately owned, small- and medium-sized U.S. companies. BDCs aim to generate income and capital gains when the companies they invest in are sold, much like venture capital or private equity funds. Anyone can invest in BDCs as they are public companies traded on major stock exchanges.
BDC Buzz
Similar to Real Estate Investment Trusts (“REITs”), Business Development Companies are regulated investment companies (“RICs”) required to pay at least 90% of their annual taxable income to shareholders, avoiding corporate income taxes before distributing to shareholders. This structure prioritizes income to shareholders (over capital appreciation), driving higher annual dividend yields that mostly range from around 6% to 11%. I firmly believe that higher-yield investments will become even more attractive in an inflationary and rising interest rate environment (as shown below), especially as investors are seeking additional income from invested capital.
This article discusses PennantPark Investment (NYSE:PNNT) which I purchased in November 2020 at $4.06 (currently $7.85) per share as discussed in a previous article:
The article was published Nov. 29, 2020, giving readers plenty of reasons to buy PNNT. Did you?
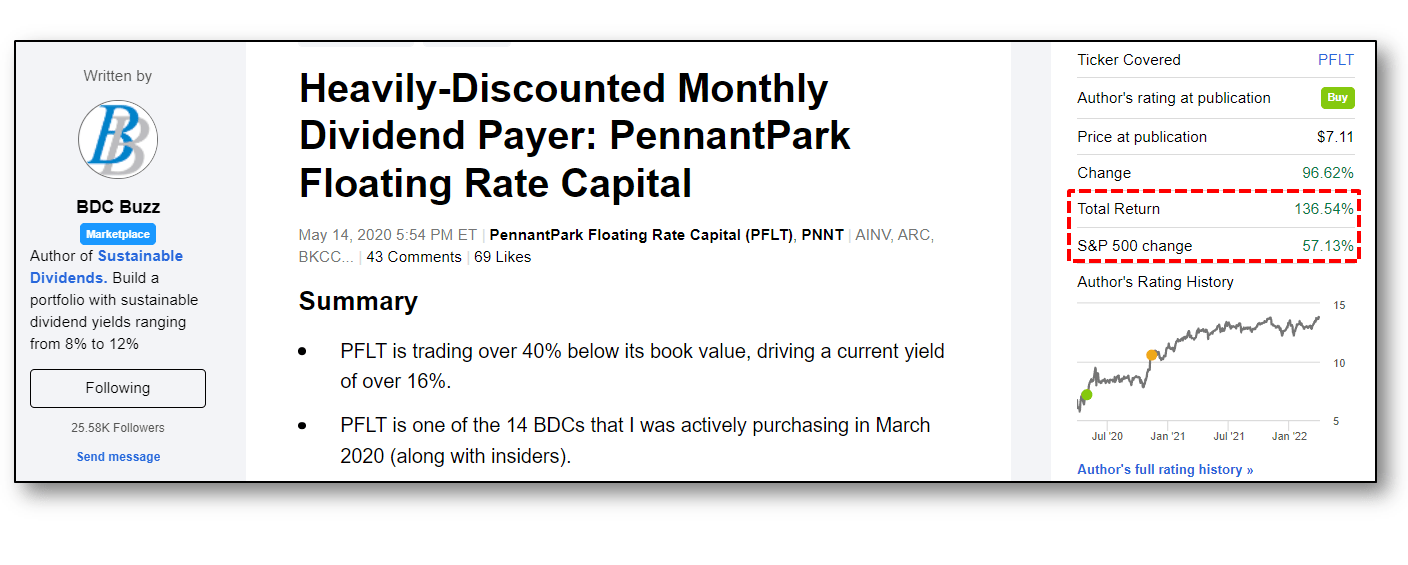
Also discussed is PennantPark Floating Rate Capital (NYSE:PFLT) which I suggested as a Buy in “Heavily Discounted Monthly Dividend Payer: PennantPark Floating Rate Capital” and easily beat the S&P 500 with total returns over 136%:
Seeking Alpha
Previous PNNT Article Follow-Up
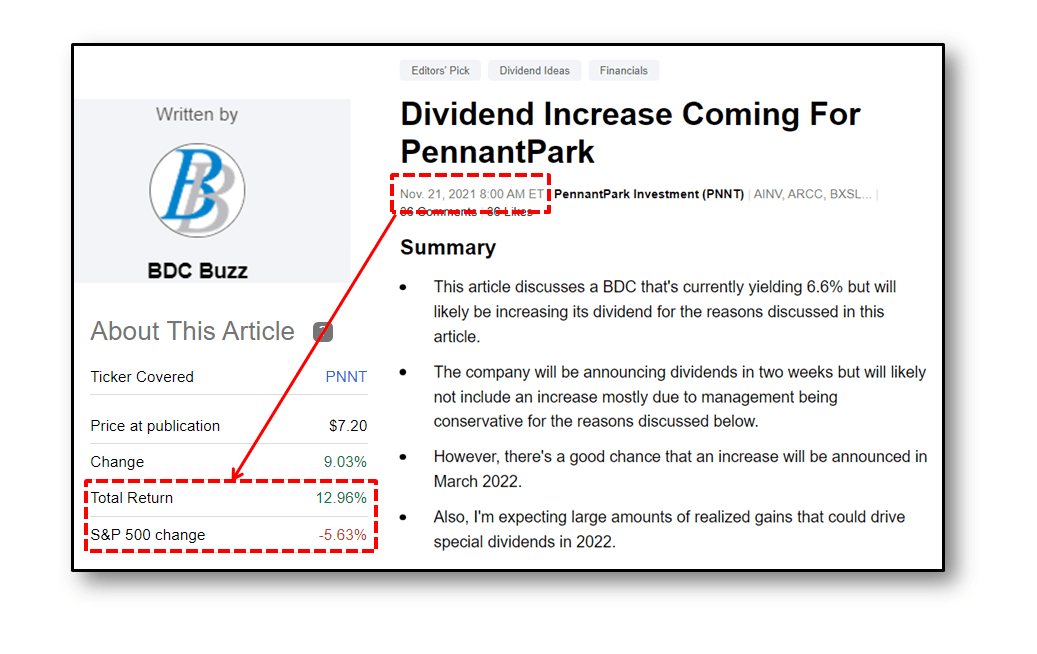
The following items were predicted five months ago in “Dividend Increase Coming For PennantPark“:
- The company will be announcing dividends in two weeks but will likely not include an increase mostly due to management being conservative for the reasons discussed below.
- However, there’s a good chance that an increase will be announced in March 2022.
- Also, I’m expecting large amounts of realized gains that could drive special dividends in 2022.
PNNT has returned 13% over the last 5 months compared to the S&P 500 down almost 6%:
Seeking Alpha
Comparing PNNT and PFLT
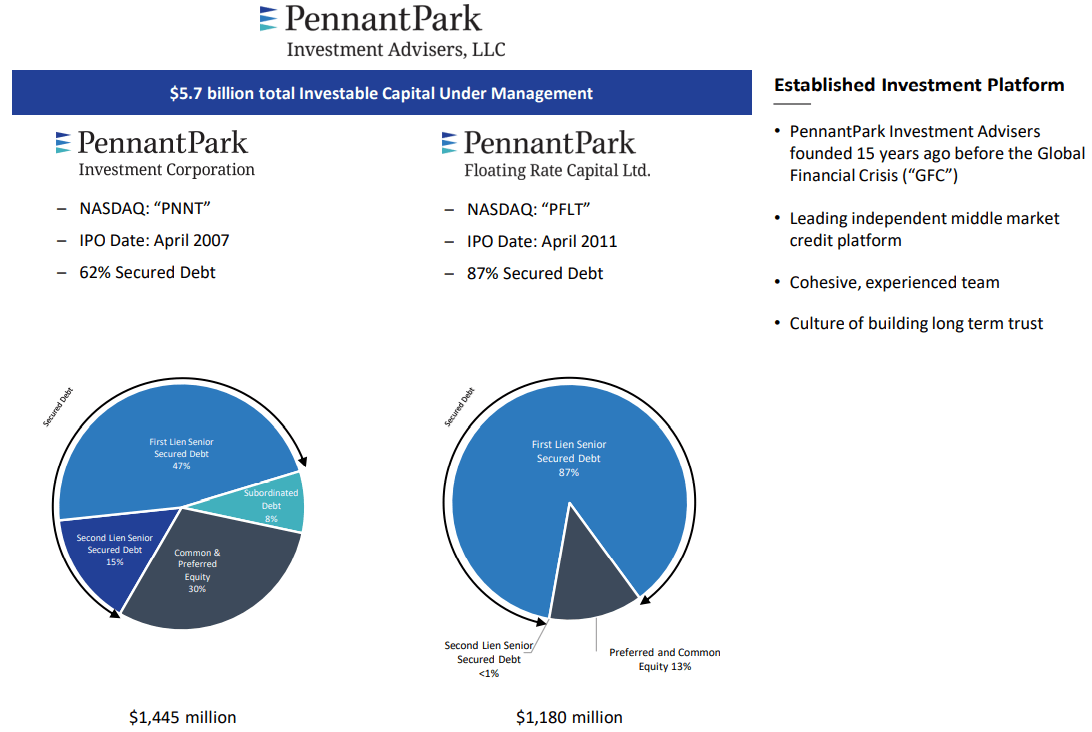
Also, this article also compares PennantPark Investment and PennantPark Floating Rate Capital both of which were founded by Art Penn who also co-founded Apollo Investment (AINV) in 2004.
PNNT
Portfolio Mix and Credit Quality
Author’s Note: The following information was provided to subscribers of Sustainable Dividends along with a constantly updated full risk profile and rankings for PNNT and PFLT.
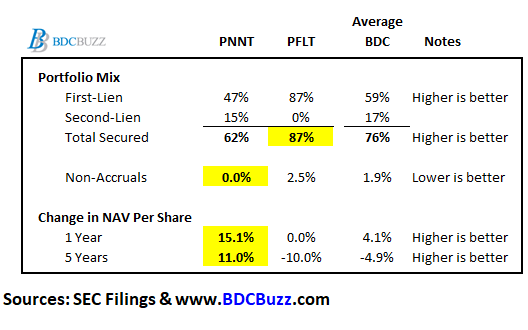
The following table shows a handful of the metrics used to compare BDCs, but please keep in mind that this information is oversimplified and needs discussion. For example, not all “first-lien” is the same credit quality. I would feel much safer with second-lien in a higher quality BDC than first-lien in a lower quality one. Many of the BDCs that were the worst performers had plenty of first-lien only to have huge declines in book values or net asset values (“NAV”) in the following quarters. Also, non-accruals are investments that a BDC is currently not accruing income due to credit issues. Some BDCs will exit or restructure these investments just before the quarter-end, taking a realized loss but avoiding being listed as a credit issue when reporting results. It’s better to look at historical realized losses which clearly identify recent/previous credit issues, as discussed in previous articles.
BDC Buzz
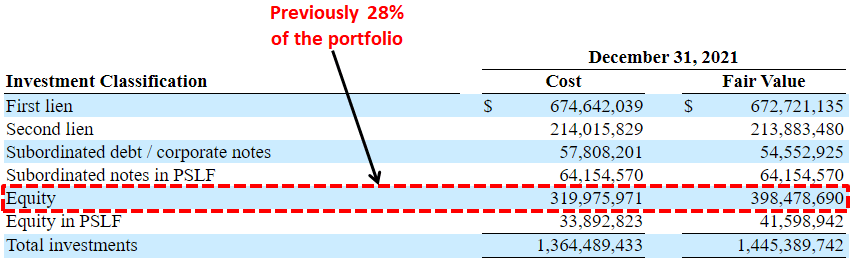
PNNT’s management continues to make progress in reducing the amount of equity positions closer to its target of 10% of the overall portfolio:
At its peak, equity was 36% of the portfolio on March 31, 2021. Pro forma for the exit of Pivot, the percentage of our portfolio that will be equity will be down to 20%. Our long-term target continues to be 10%. The exits are a combination of investments from our successful equity co-investment program such as Wheel Pros, Walker Edison, DecoPac, WBD Summit and Jupiter as well as the successful outcomes of restructuring such as Pivot. Including the $116 million from the Pivot exit, equity proceeds since the peak on March 31, 2021 will equal approximately $225 million.”
Source: PNNT Earnings Call
SEC Filing
As mentioned in the previous PNNT article, I am “expecting large amounts of realized gains” in 2022. In February 2022, Athletico Physical Therapy announced that it had acquired PT Network (Pivot Health Solutions) which was PNNT’s largest investment accounting for over 15% of the portfolio. I’m expecting around $2.05 per share of realized gains, which is significant relative to its current $0.14 per share of quarterly dividends.
A good portion of this investment was non-income producing and will be partially reinvested into income-producing assets. Also, management will be using $25 million of the proceeds to repurchase shares:
We anticipate using up to $25 million of the proceeds from the exit of Pivot to engage in the stock buyback program over the next 12 months.”
Source: PNNT Earnings Call
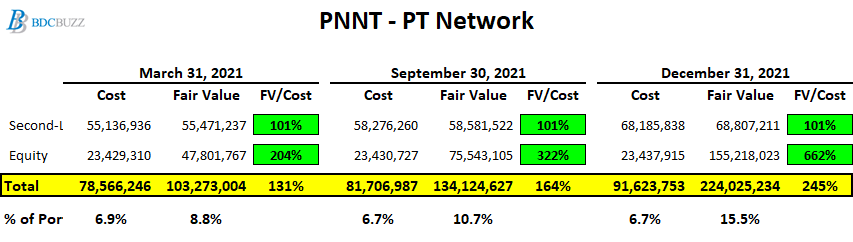
As shown in the following table, its equity positions in PT Network have been continually marked up in 2021, driving meaningful NAV growth:
As part of the filing of our 10-Q, you will see a substantial increase in the value of our investment in Pivot Physical Therapy, or PT Network. It’s been in the press that Pivot is being sold to Athletico Physical Therapy. This transaction is expected to close in the next few weeks. We will generate approximately $160 million of cash proceeds on our $18 million common and preferred stock investments in Pivot. We will also receive $73 million from the redemption of our second-lien investment. We believe in the combination and we’ll invest $10 million of equity in the company.”
Source: PNNT Earnings Call
BDC Buzz
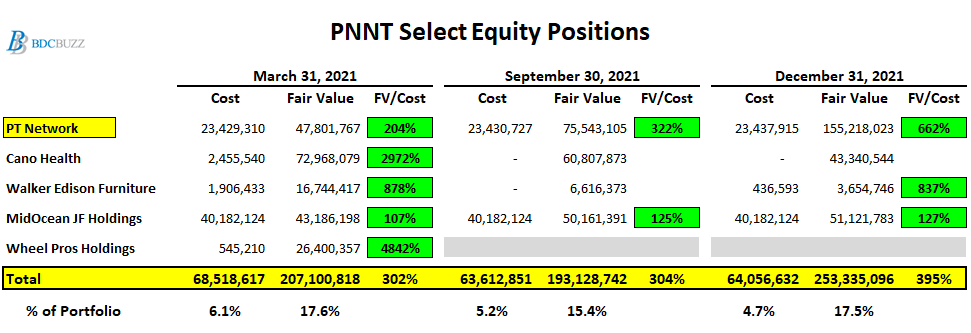
There’s a good chance that PNNT will sell its equity positions in Cano Health, Inc. and Walker Edison Furniture at some point as well:
BDC Buzz
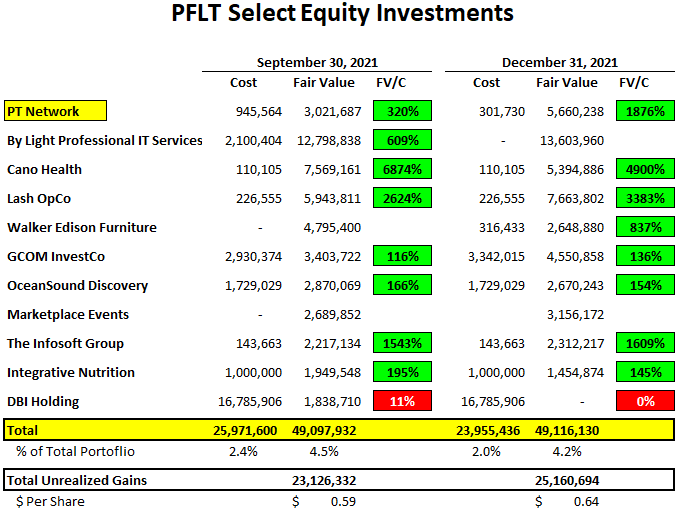
PFLT has a smaller position in PT Network, which will likely drive around $5.4 million or $0.14 per share of realized gains in Q1 2022. Also, there’s a good chance that PFLT will be selling its equity positions in By Light Professional IT Services, Cano Health, Inc. (CANO), Lash OpCo, Walker Edison Furniture, and the other equity investments listed below. These investments account for $49 million or 4.2% of the portfolio and the proceeds will probably be reinvested into income-producing assets.
These investments are marked well above cost and could result in meaningful realized gains over the coming quarters. However, PFLT has offsetting realized losses from previous years and likely from DBI Holding in 2022 with its equity portions currently marked down to 0% as shown below.
BDC Buzz
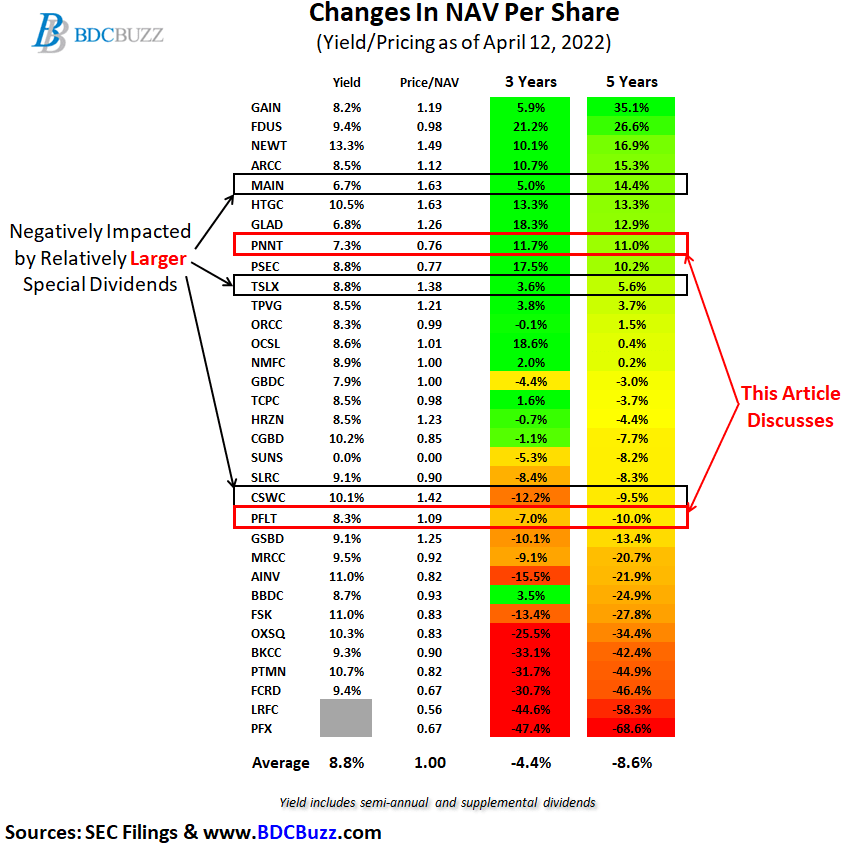
As shown below, PNNT has above-average performance for changes in NAV per share, partially due to its equity positions (similar to other top performers) but also due to paying a lower dividend relative to its NAV per share discussed at the end.
BDC Buzz
Expense Ratios, Fee Agreements, and Dividend Coverage Comparisons
Author’s Note: The following information was provided to subscribers of Sustainable Dividends along with three quarters of financial projections using base, best, and worst-case assumptions to test the sustainability and potential growth of the current dividends for PNNT and PFLT.
As a part of assessing BDCs, it’s important to consider expense ratios. BDCs with lower operating expenses can pay higher amounts to shareholders without investing in riskier assets.
“Operating Cost as a Percentage of Available Income” is one of the many measures that I use which takes into account operating, management, and incentive fees compared to available income. “Available Income” is total income less interest expense from borrowings and is the amount of income that is available to pay operating expenses and shareholder distributions.
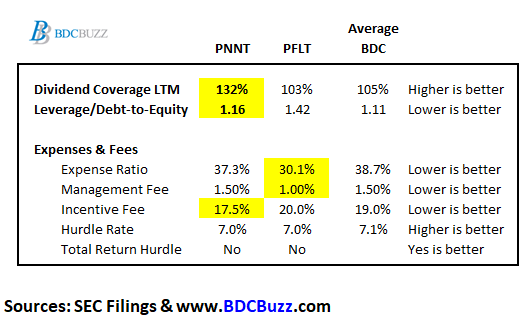
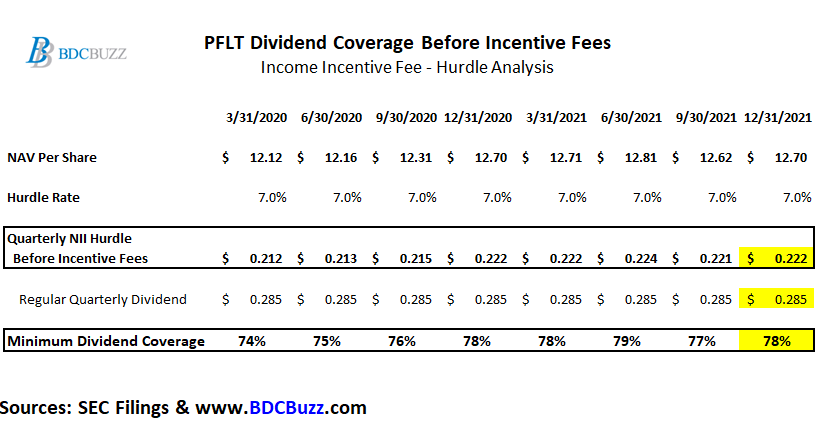
PFLT has a lower base management fee of 1.00% compared to PNNT at 1.50% which is the average for sector. More importantly, is the 7.0% hurdle, which is critical for dividend coverage during lower-performing quarters. As a reminder, the “hurdle rate” is the amount of required net earnings before the manager begins to receive an income incentive fee.
The expense ratio for PFLT is lower mostly due to the lower base management fee and both are below the BDC average.
The “dividend coverage LTM” shows the average dividend coverage over the last 12 months (four quarters). It’s interesting to note PNNT has much higher-than-average coverage currently around 132% but partially due to paying a lower dividend relative to its NAV per share and its hurdle rate discussed next.
BDC Buzz
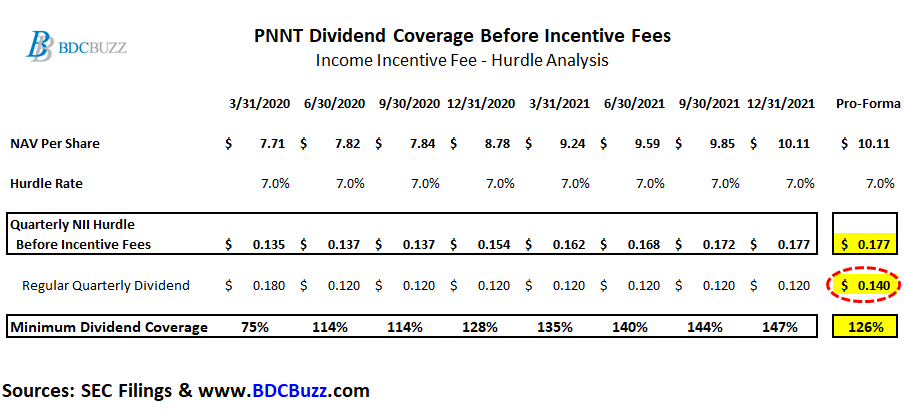
PNNT’s incentive fee “hurdle rate” of 7.0% is applied to “net assets” to determine “pre-incentive fee net investment income” per share before management earns its income incentive fees. As shown in the following table, over the coming quarters the company will probably earn around $0.17 to $0.18 per share each quarter before paying management incentive fees covering around 126% (of the current $0.14 dividend) which is ‘math’ driven by an annual hurdle rate of 7% on equity. It’s important to note that PNNT could earn less, but management would not be paid an incentive fee.
BDC Buzz
PFLT will probably earn around $0.22 per share each quarter before paying management incentive fees covering around 78% of its dividend before incentive fees. However, PFLT pays a higher dividend relative to its NAV, which is the reason for the meaningful difference.
BDC Buzz
As mentioned in the previous PNNT article, I was expecting dividend increases as the company continues to make progress monetizing some of its equity positions as well as portfolio growth using increased leverage and higher returns from its PSLF. In February 2022, PNNT increased its regular quarterly dividend from $0.12 per share to $0.14 per share for Q1 2022, as predicted in my previous best-case projections.
Due to this performance and the successful execution of our equity rotation program, we are pleased to announce the three-part plan to increase long-term shareholder value: Number one, an increase in our quarterly dividend by 17% to $0.14 per share per quarter, up from $0.12 starting this quarter ended March 31. We anticipate using up to $25 million of the proceeds from the exit of Pivot to engage in the stock buyback program over the next 12 months; and number three, an increase in our investment in our PSLF JV with Pantheon, which will enhance NII over time. We feel very comfortable going to the $0.14. We think it’s, almost in any scenario you run, comfortably covered with NII and we’ll see where we go. We’ll see how – what the earnings power of PNNT and then the JV is. We’ll see about the equity rotation. We’ll see the LIBOR going up and what kind of impact that’s going to have on the NII. So lots of different things going on, but for us this was the first move and hopefully not the last move over time as we hopefully continue to grow NII.”
Source: PNNT Earnings Call
Rising Interest Rates and Portfolio Yields
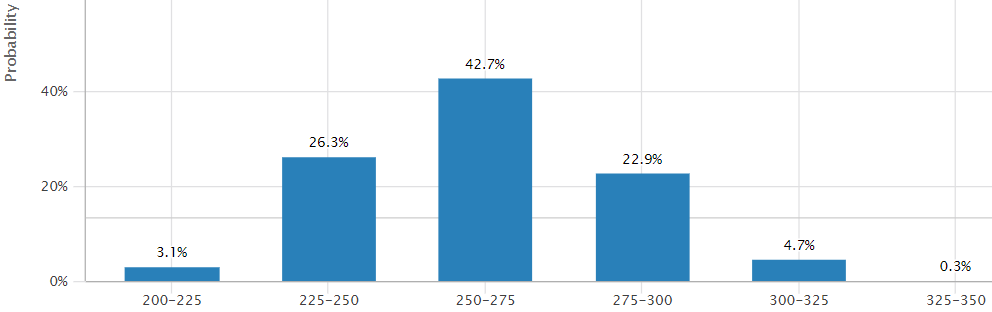
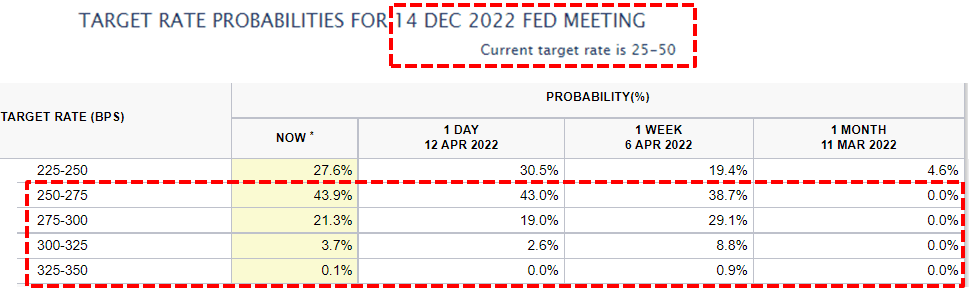
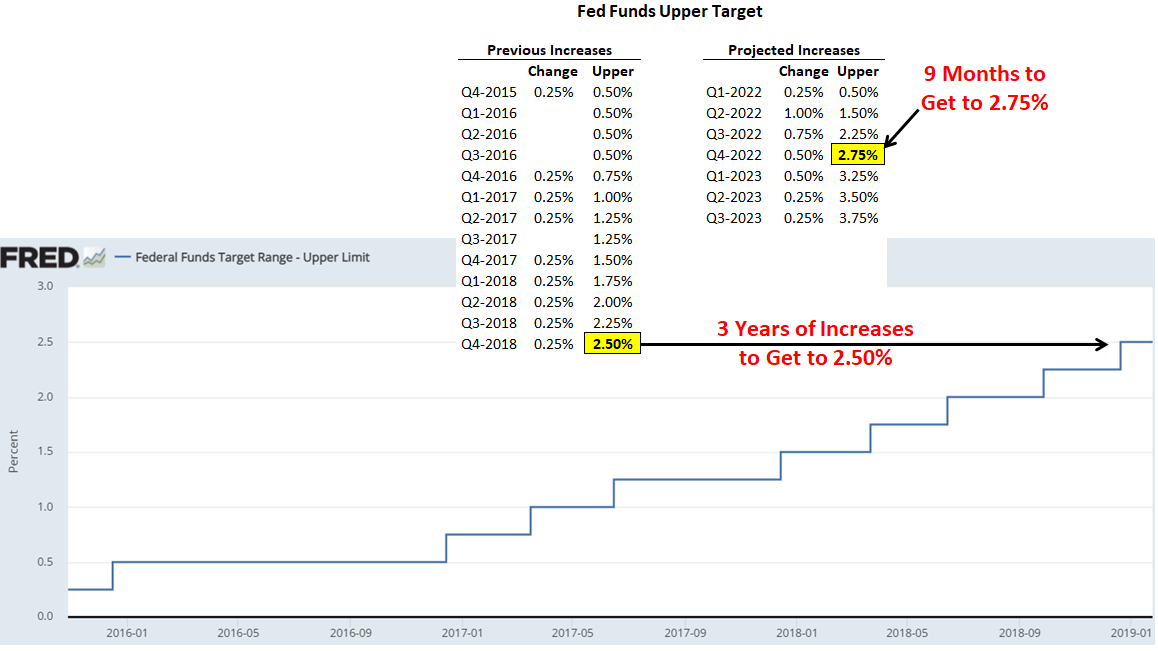
Interest rate sensitivity refers to the change in earnings that may result from changes in interest rates. There’s now an 69% chance (up from 0% last month) of the fed funds upper target rate increasing to 2.75% or higher over the next eight months. This is important because the last time the Fed increased rates started in late 2015 took three full years before reaching 2.50% as shown below. Please note that the current fed funds upper target rate is 0.50% implying an increase of at least 225 basis points or 2.25% over the next eight months. Most BDCs benefit after the first 1.00% of rate increases, including PFLT.
FRED
FRED
FRED
During 2013 and 2014, many BDCs experienced declining portfolio yields driven by competition for “true” first-lien and higher-quality assets. This was followed by a period of rate hikes as mentioned earlier, which resulted in higher portfolio yields for most BDCs, including PFLT increasing 140 basis points or 1.40% (from 7.8% to 9.2%) as shown below:
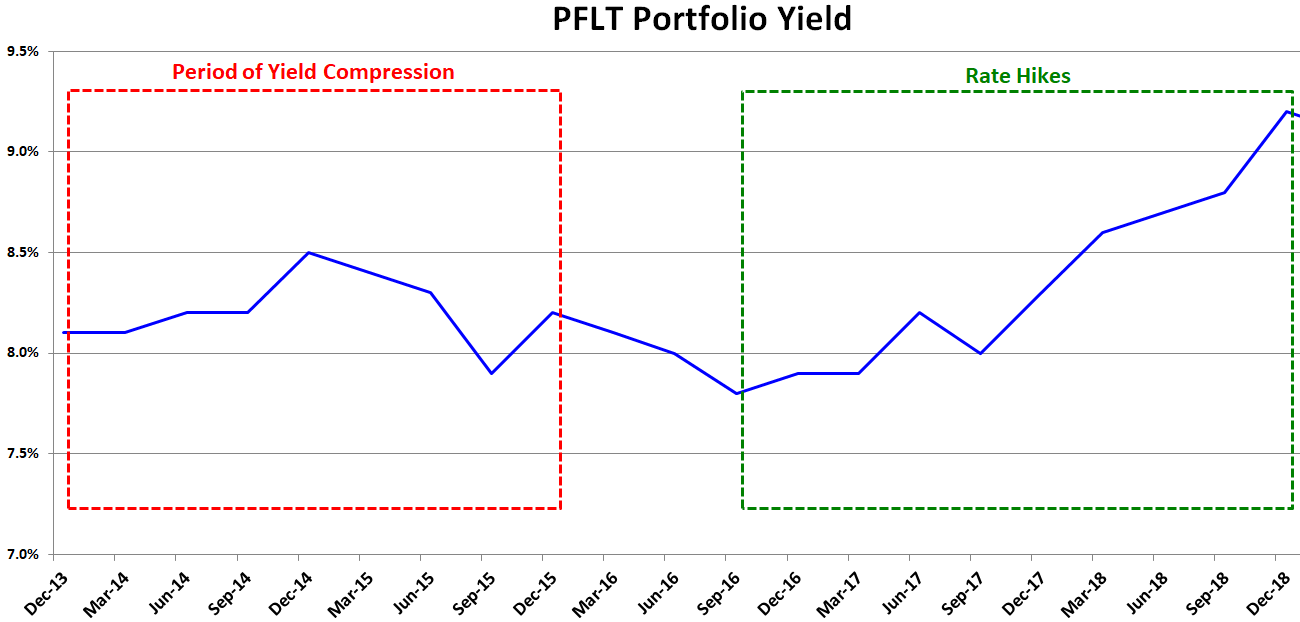
BDC Buzz
Similar to other BDCs, PFLT’s stock price was increasing just before its portfolio yield started to rise:
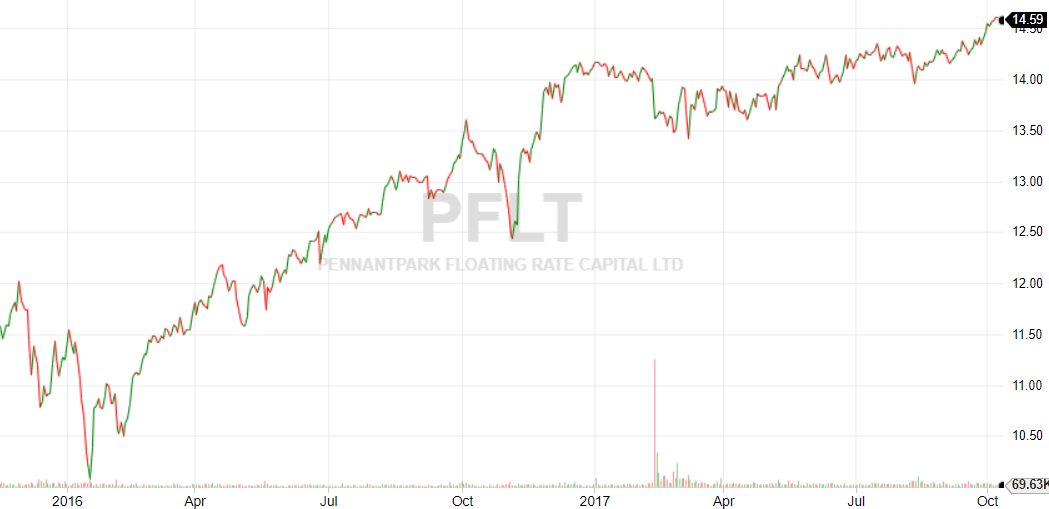
Fidelity
Pricing BDCs and Recommendations
Author’s Note: The following information was provided to subscribers of Sustainable Dividends along with a constantly updated target prices and suggested limit orders (for making purchases) for PNNT and PFLT.
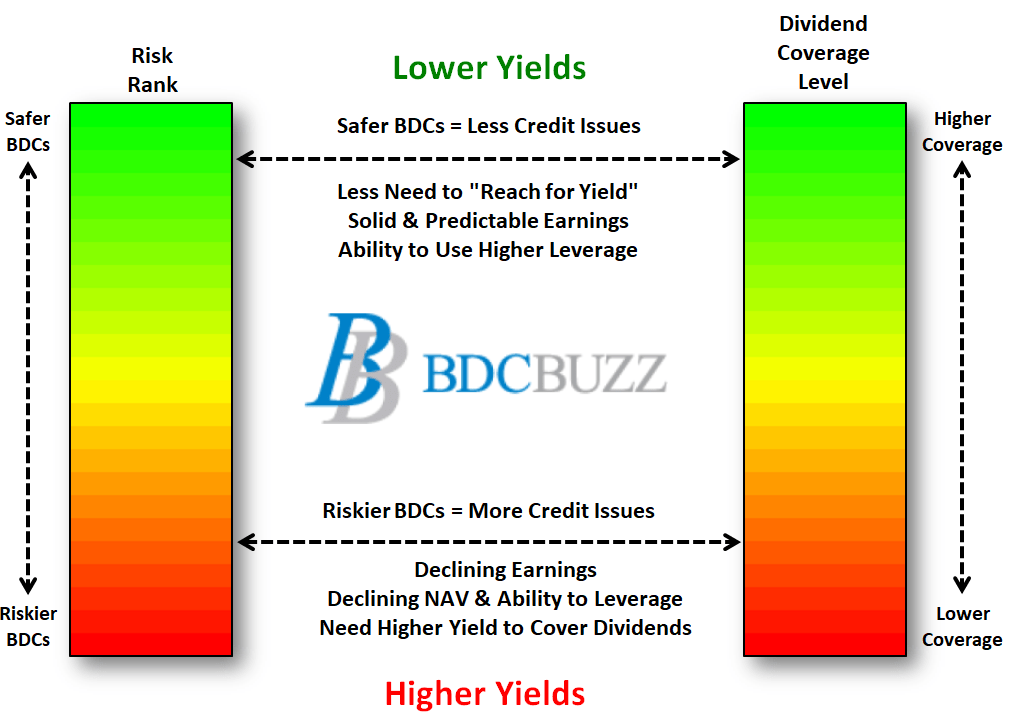
There are very specific reasons for the prices that BDCs trade driving higher and lower yields mostly related to portfolio credit quality and dividend coverage potential (not necessarily historical coverage).
- BDCs with higher quality credit platforms and management typically have higher quality portfolios and investors pay higher prices. This drives higher multiples to NAV and lower yields.
- BDCs with lower expenses and higher potential dividend coverage typically have stable to growing dividends and investors pay higher prices. This drives higher multiples to NAV and lower yields.
BDC Buzz
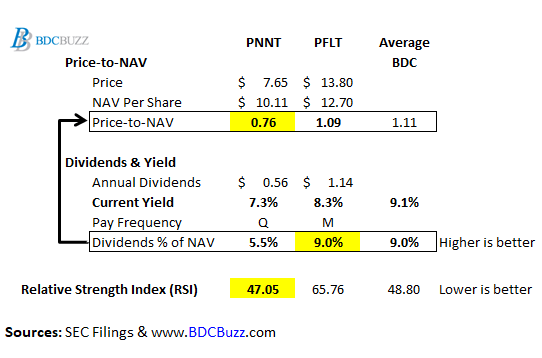
Also, and this is very important, the price-to-book/NAV is highly dependent on the amount of dividends that a BDC is paying as a percentage of NAV (but also taking into account risk profile and projected dividends).
For example, PFLT is currently paying a regular monthly dividend of $0.095 per share, which is $1.14 annually and 9.0% of its current NAV per share ($1.14/$12.70).
As mentioned earlier, PNNT recently increased its regular quarterly dividend by almost 17% from $0.12 to $0.14, which is $0.56 annually and 5.5% of its current NAV per share ($0.56/$10.11). This is well below the BDC average, partially due to the recent NAV increases discussed earlier. However, there’s a very good chance that PNNT will continue to increase its regular dividend with the potential for a meaningful supplemental/special dividend later in 2022.
Please note that PFLT is trading near the average price-to-NAV of 1.11 mostly because it’s paying an average amount of dividends at 9.0% of NAV. This is not a coincidence, this is how BDCs are priced.
As PNNT continues to increase the amount of dividends paid, its stock price will follow higher, which is why I would recommend buying at these levels. Also, PNNT currently has a lower Relative Strength Index or RSI, which is an indicator that I use only after I already know which BDC I would like to purchase but waiting for a good entry point. I consider target prices to be much more important when adding to current positions.
BDC Buzz
Be the first to comment