

structuresxx
At Portfolio Income Solutions we are always scouring the REIT investment universe for mispricing. Usually this means a stock that is mispriced relative to its peers, but occasionally there is a particularly intriguing situation in which there is mispricing within a company’s own capital stack.
Pebblebrook Hotel Trust (NYSE:PEB) is a hotel REIT with about $7 billion worth of high-end hotels in coastal gateway markets. For a hotel REIT, this is quite large and within this enterprise runs the full gambit of a traditional capital stack
- ~$2.8B debt
- $740 million preferred equity
- ~$3.5B common equity at NAV
I think an argument could be made for investing in PEB, but the main point of interest for me is the series G preferred which I think is clearly mispriced relative to the rest of the capital stack. With a 9.2% current yield and a 44% discount to liquidation value, it provides an unusually high return potential relative to its senior position in the capital stack above $3.5B of common.
Successful investment in a preferred requires the NAV to protect liquidation value and it requires cashflows to fund the dividend payments. Let me begin by digging into hotel fundamentals so as to get a sense for how well covered the preferred is.
Hotel fundamentals in a post-pandemic world
There is no denying that Covid clobbered the hotel industry. Revenue fell off a cliff, but operating expenses largely remained in place.
The poorly capitalized hotel REITs had to undergo highly dilutive emergency measures to stay alive and I doubt their earnings will return to 2019 levels on a per share basis for a very long time.
Pebblebrook, however, has consistently been among the better capitalized hotel REITs so its situation did not get nearly as dire. In fact, PEB is on track to almost fully recover its $2.63 2019 FFO/share by 2024 as per the consensus estimates below.
S&P Global Market Intelligence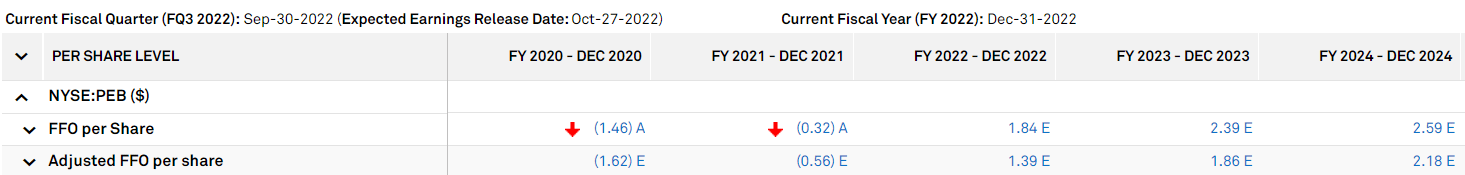
As hotels more fully reopened in 2022, Pebblebrook has seen a rapid recovery in key operating metrics like occupancy ADR (average daily rate) and RevPAR (revenue per available room).
PEB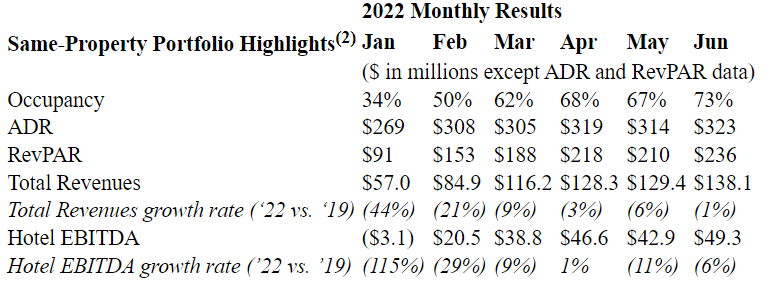
June ADR hit $323 per room night with a very healthy 73% occupancy.
Since hotels are a significantly different sort of sector, there are 2 pieces of information to keep in mind when digesting this data.
- Occupancy never really hits 80s and 90s on a sustained basis like other sectors because it consists of a blend of surge nights and off nights. Surge nights are of course capped at 100%, so 73% occupancy is more or less full occupancy.
- Hotels are cyclical with 2Q and 3Q being the better quarters. June is supposed to be a good month and I would anticipate slightly lower numbers as we head into the 4th quarter.
At a broader level, the industry is recovering with nominal RevPAR anticipated to pass 2019 levels already in 2022 and inflation adjusted RevPAR targeted to surpass 2019 levels in 2024.
Smith Travel Research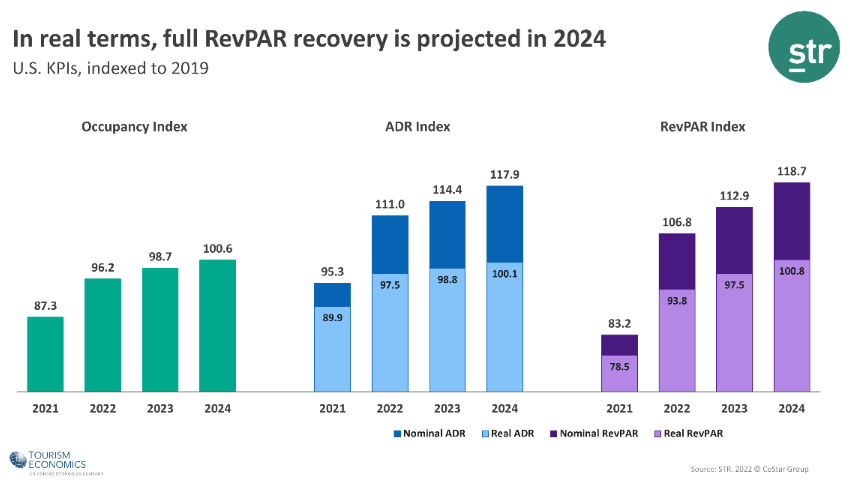
PEB’s portfolio is almost exclusively gateway city.
S&P Global Market Intelligence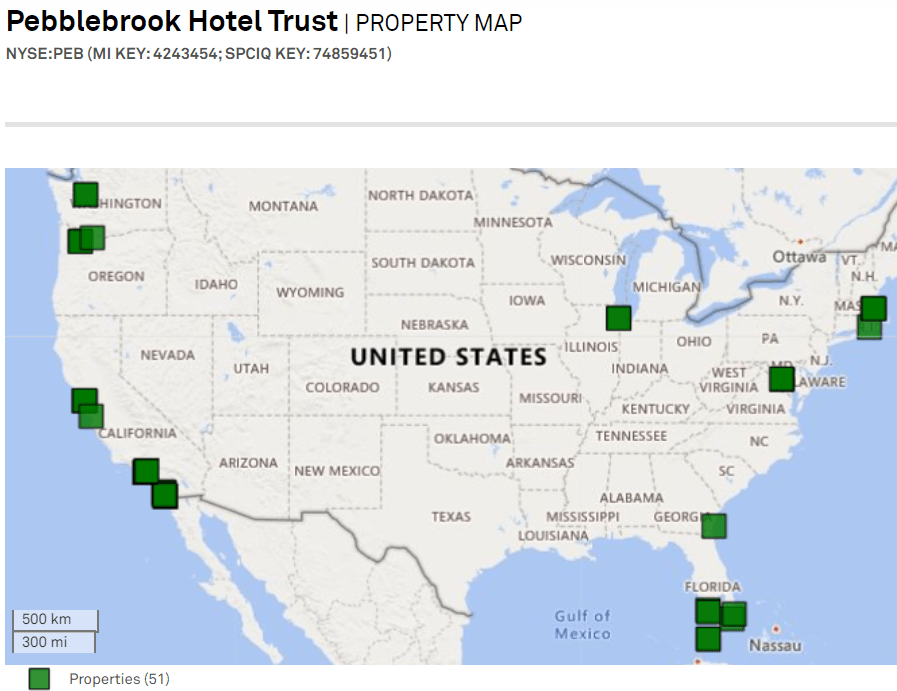
In recent quarters, its west coast performance has lagged its east coast performance with Georgia being a major standout to the upside.
On a longer term forward outlook I think these markets are generally fine. The bigger markets tend to be more stable. Perhaps not as explosive to the upside, but there are more consistent demand drivers.
NAV coverage of preferred liquidation preference
Recall that because of the way the waterfall works, the preferreds will get their full liquidation preference before the common gets any. Thus, any asset value in excess of debt counts as coverage for the preferreds.
PEB has roughly $7B of assets at cost.
S&P Global Market Intelligence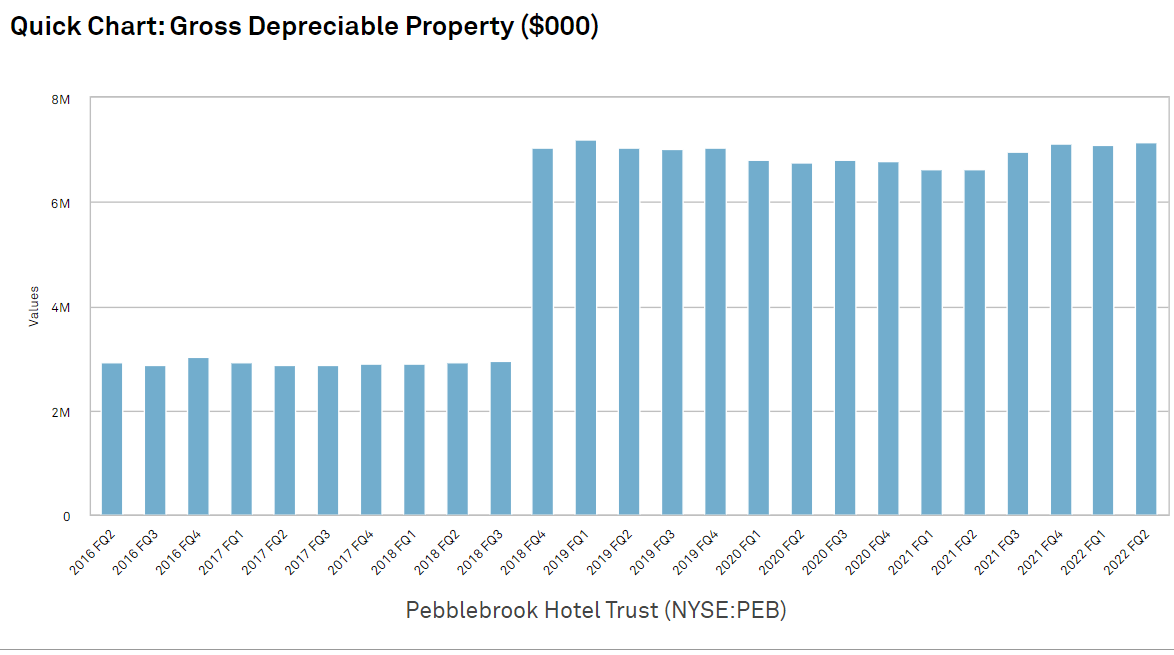
Today, these assets are worth slightly more than what PEB paid for them based on general real estate value trends and consensus NAV estimates.
PEB has about $2.8B in debt.
S&P Global Market Intelligence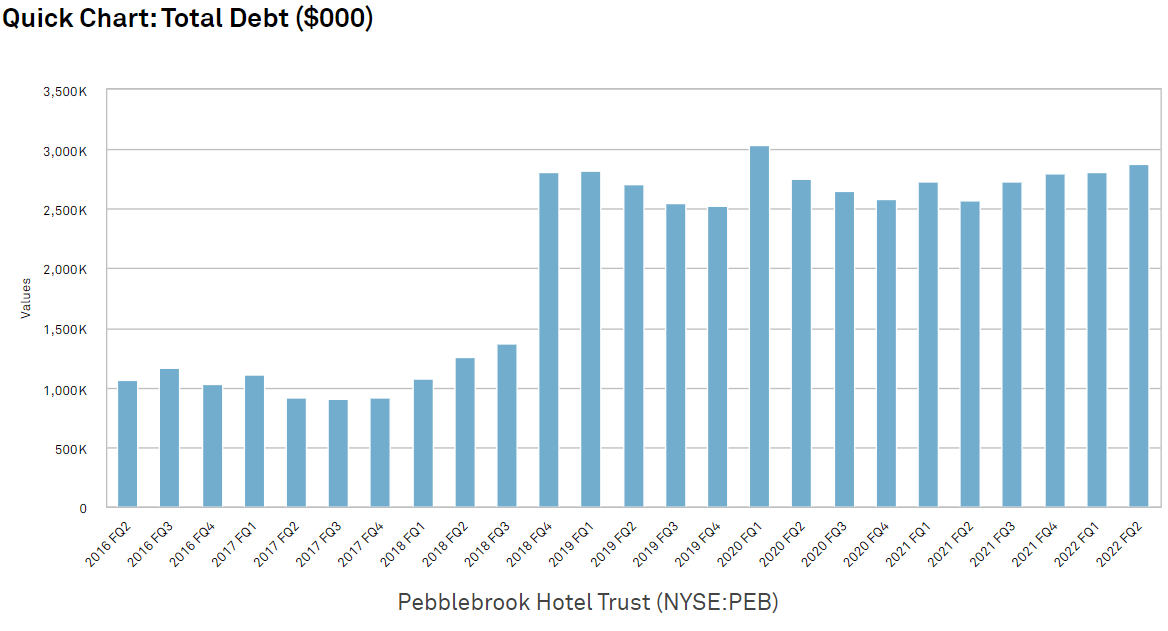
This leaves over $4B of asset value to cover the $740 million of pari-passu preferreds shown below.
Portfolio Income Solutions
That to me feels like an ample level of asset coverage. In the depths of the financial crisis, commercial real estate was priced at about 70% of the December 2006 level. 70% of PEB’s asset value would still cover the debt and preferred. Thus, I am not particularly worried about this angle. It seems to be the cashflow side that tends to be more of a threat for hotels.
Cashflow coverage of preferred dividend
Let me begin with a bit of prerequisite information as to how FFO accounting works.
REIT FFO is net of interest expense and preferred dividends. Thus, an FFO of $0 per share fully covers the preferred dividends.
That of course would not be ample coverage, but it would technically be enough to pay preferred dividends.
With the exception to the pandemic, PEB has consistently generated strongly positive FFO.
S&P Global Market Intelligence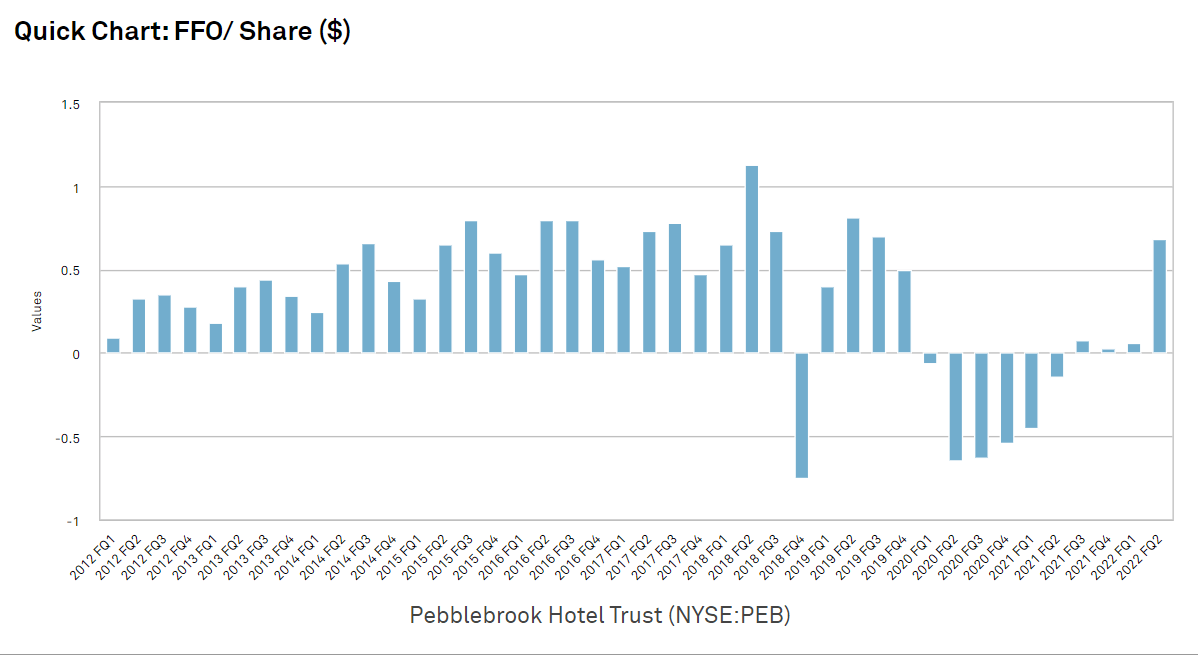
Hotels are a cyclical industry, so while the pandemic was a unique situation that is unlikely to repeat, there will be recessions. PEB’s FFO/share did dip negative in 2009 during the GFC.
Preferred dividends are cumulative, so briefly not covering does not reduce the dividends to which shareholders are entitled.
I think the positive FFO of PEB during normal times far outweighs the brief periods of negative FFO during the 2 hardest challenges for the industry in modern history. I would feel less comfortable with the preferreds of other hotel REIT issuers, but PEB is consistently one of the best operators and among the best capitalized. It also has a beautiful slate of assets which I think will hold their value nicely.
As such, I view Pebblebrook preferreds as a reliable source of dividend income.
Mispricing within the preferred stack
Each of the PEB preferreds is pari-passu with one another meaning they sit at the same level in the waterfall and PEB cannot pay dividends on one without also paying dividends on the others.
As such, the risk level is almost identical with slight exception to differing liquidity due to some issues being larger than others.
Portfolio Income Solutions
PEB-H is likely to be the most liquid with $250 million outstanding, but the G series is close with $230 million.
I don’t necessarily view lower liquidity as a negative. For a patient trader that buys and sells with limit orders it can be a positive in that one can get the better end of the bid/ask spread on both the way in and the way out.
There are 2 factors that cause a preferred to be higher return
- Discount to par
- Bigger face coupon
The G series is the best of both worlds trading at $17.25 against a $25 par value and having a 6.38% coupon which is tied for highest with the E series. This causes PEB-G to have a 9.24% current yield while the other issues are in the 8s.
Further, PEB-G has a 44.9% upside to par in the event it is ever redeemed or the company is sold/liquidated. The H series is close to as good due to having the largest discount to par, but since I view liquidation as an unlikely scenario I would rather have the higher carrying yield.
Series E and F are not even close to as good. Either they are overpriced, or the G is underpriced, and I think it is the latter.
Pebblebrook is a solid company that I have respected for a long time. Getting a 9.24% going in yield on a preferred with significant capital appreciation potential on top feels like a great deal from this issuer.
What about the common
PEB’s valuation is attractive right now. It has usually traded as the premium multiple hotel REIT, but now it is in the middle of the pack.
S&P Global Market Intelligence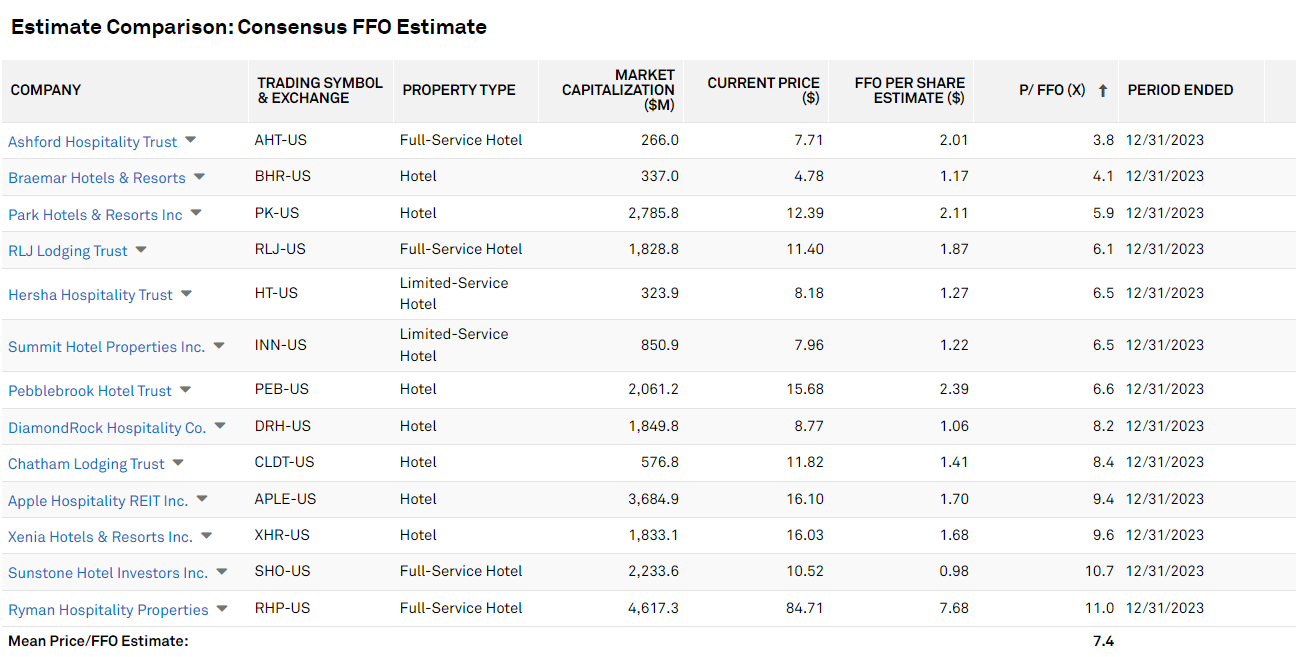
6.6X forward FFO is quite a low multiple, but I do think the hotel sector should trade at a substantially lower multiple than other REIT sectors.
PEB also looks rather cheap on a NAV basis with its 41% discount being bigger than that of hotel peers and REITs in general.
S&P Global Market Intelligence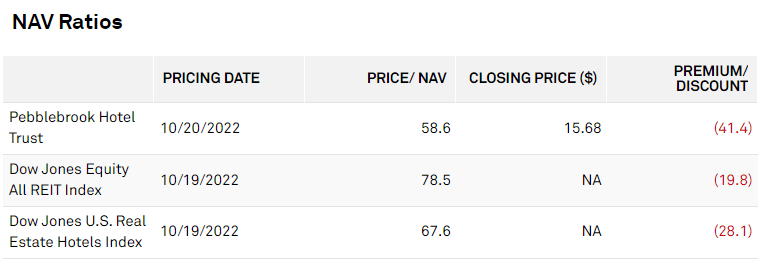
I think PEB common is a decent buy if one wants exposure to the hotel REIT sector. That said, I am still hesitant. The strategic positioning has not been fixed with brands and online travel agencies still getting the better end of the deal compared to hotel owners.
Additionally, it is unclear to what extent the huge recovery in RevPAR is just a result of pent up travel demand as opposed to sustainable demand. Finally, Airbnb (ABNB) and its clones are an enduring threat to proper hotels.
Overall I view the preferred G as a reliable source of significant income and the common is more of a high risk high reward sort of proposition.
Be the first to comment