

Mongkol Onnuan
Article Thesis
Some of the PIMCO funds are well-liked among investors. This includes the large PIMCO Dynamic Income Fund (NYSE:PDI) and the smaller PIMCO Dynamic Income Opportunities Fund (NYSE:PDO). These two fixed-income funds offer high dividend yields, but there are some drawbacks that investors should consider as well. In this article, we’ll compare the pros and cons of PDI and PDO to evaluate which of these funds is more suitable for investment today.
Closed-End Funds For Income
Both PIMCO Dynamic Income Fund and PIMCO Dynamic Income Opportunities Fund are closed-end funds. Many CEFs offer high dividend yields, oftentimes much higher than the yield one can get by investing in the broad equity market, e.g. via an S&P 500-replicating ETF such as SPY (SPY), or by investing in treasuries (TLT). But these high yields come at a cost. First, CEFs oftentimes invest in riskier, less liquid assets in order to increase their returns. Second, CEFs oftentimes utilize leverage in order to juice returns. While that works in times when markets are orderly and when the underlying assets are performing reasonably well, leverage can become a problem during market sell-offs, as it may force liquidation of positions due to margin calls at exactly the wrong time — when prices are low, and when buying would be more opportune. On top of that, there’s the general problem of CEFs having pretty high expense ratios, which naturally hurts an investor’s total returns, all else equal. This also holds true for PDI and PDO as we will see later. Due to their high dividend yields, CEFs are still well-liked among some income investors that feel the high yield justifies the drawbacks, such as principal erosion, high expenses, and so on. Not surprisingly, both PDO and PDI are held by many retirees and other income investors.
PDI Versus PDO
In order to compare these two PIMCO-managed CEFs with each other, let’s look at a couple of different areas that could be relevant for investors.
Strategy
Both PDI and PDO are fixed-income closed-end funds, but there are some differences. Here’s what PIMCO says about PDI’s strategy:
PIMCO
Meanwhile, PDO’s strategy is described like this:
PIMCO
That reads relatively similarly — income is the prime objective, while capital appreciation is also pursued (that’s not working out so far, however). Delving deeper into the matter, PDO’s strategy puts more focus on credit markets and on an opportunistic approach that incorporates market conditions, valuations, market trends, etc. PDI puts less focus on these items but has a larger focus on non-agency MBS, in which it will invest at least 25% of funds at all times. PDI is allowed to put up to 40% of its assets in emerging market securities, while the cap for emerging market securities is 35% for PDO, according to the two CEFs’ fact sheets (here for PDI, here for PDO).
CEF Characteristics
Both CEFs are managed by PIMCO, thus it is not surprising to see that both have relatively similar expense ratios. Still, there are some differences. The management fee is 1.1% for PDI, versus 1.15% for PDO. The total expense ratio, which includes management fees but also other items such as interest expenses, is 2.64% for PDI and 2.79% for PDO. Overall, that’s a pretty high expense ratio for both funds, but PDI looks slightly better than PDO on that basis. Due to PDI’s larger size — the market capitalization is around three times as high as that of PDO — PDI can demand a lower expense ratio, as costs are distributed over a larger asset base. Nevertheless, with expense ratios of close to 3%, both CEFs are high-cost investments relative to what investors pay for some other CEFs, and especially compared to lower-cost investment vehicles such as ETFs.
With a market capitalization of $4.4 billion, PDI is a relatively large CEF, while PDO, with a market capitalization of $1.5 billion, is still far from small. Not surprisingly, PDI is the more liquid investment, with an average daily volume of more than 1 million shares. But PDO is still pretty liquid as well, with around 700,000 shares changing hands per day. Overall, due to lower expenses, a wider asset base, and better liquidity, PDI takes the lead here.
Dividends And Total Returns
Both CEFs are primarily held for their income generation potential, thus this is obviously an important point. PIMCO Dynamic Income Fund has a distribution rate of 14.3%, relative to its market value as of the end of 2022. Meanwhile, the distribution rate, relative to the end-of-year market value, was 12.0% for PIMCO Dynamic Income Opportunities Fund. PDI thus offers a higher dividend yield versus PDO on a trailing twelve months basis, which includes one-time dividend payments. When we look at dividends in a different way, by annualizing the most recent monthly distribution, we get a relatively similar result of PDI offering more income versus PDO:
PDI’s most recent monthly distribution was $0.2205 per share, which pencils out to $2.65 per year. With PDI trading at $20.00 today, that makes for a dividend yield of 13.3%, which is pretty high and thus attractive (without looking at other factors, at least). PDO has made a $0.1279 payment most recently, which pencils out to $1.53 per year. With PDO trading at $13.70 right now, that makes for a dividend yield of 11.2%. No matter whether we look at trailing twelve months distributions or at the most recent dividend payment, PDI thus offers a higher dividend yield than PDO, with a yield spread of around 200 base points. From a pure income perspective, PDI thus looks favorable versus its smaller peer, although PDO’s dividend yield is still pretty high, at more than 10% per year.
While dividends are important, they are not the only component of total returns. Price appreciation, or lack thereof, plays a role as well. In that regard, both CEFs have not managed to hit their secondary goal of offering capital appreciation to investors:
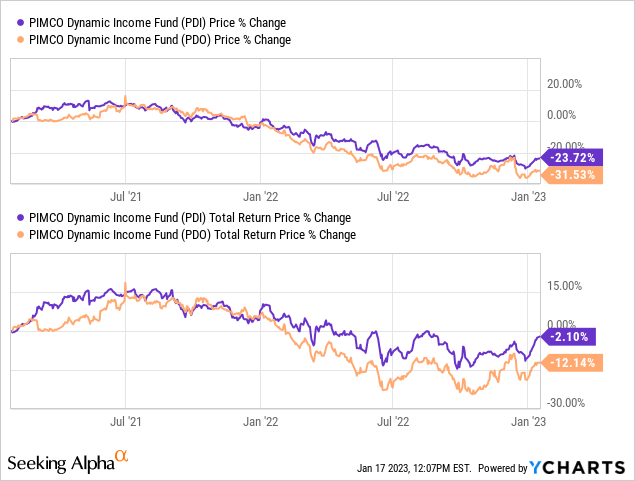
When we look at the time frame since PDO’s inception around two years ago, it’s pretty clear that neither CEF has been a very strong investment — far from it, actually. Still, there’s a notable difference between the performance of PDI and PDO. While PDO has seen its price drop by one-third, PDI has pulled back by a less pronounced 24% over the same time frame. With PDI also offering a higher dividend yield, its total return has been better on a relative basis, although far from good on an absolute basis. PDI has lost investors 2% of their wealth over the last ~2 years, including dividends, while PDO is down by double-digits over the same time frame. For reference, the S&P 500 has delivered a 7% return over that time frame, while the Dow Jones Index is up by 16% over those two years, including dividends. Both PDI and PDO have thus significantly underperformed equity markets, despite the fact that 2022 was a pretty bad year for global equity markets.
Looking at PDI’s longer-term total returns, we see that its average annual returns are pretty solid, at 10.5%, since inception, even though the last two years were far from great. For PDO, which does not have a similarly long track record, the annual returns since inception are pretty bad, at -6.6%. Even PDI, despite performing better than PDO, has lagged the broad equity market since its inception:
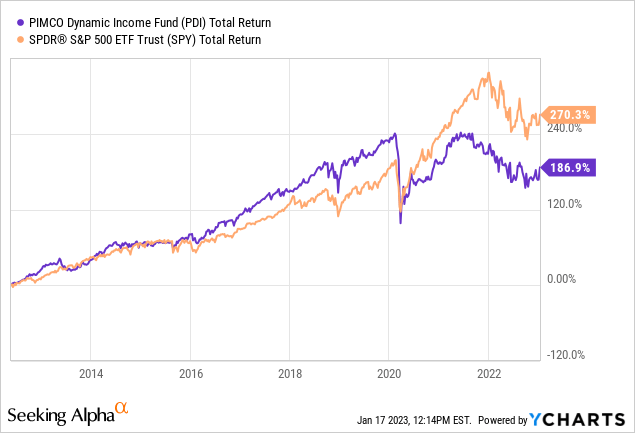
In a time when the SPY delivered a total return of 270%, PDI did generate around two-thirds of that, at 187%, including dividends. That’s not bad, but not great, either. Still, with PDI outperforming PDO since inception and with its longer-term track record being solid, I see PDI in a more favorable light versus PDO.
Takeaway
I’m not a huge fan of CEFs, primarily due to their high expense ratios that make many CEFs underperform lower-cost alternatives. PDI and PDO offer high dividend yields, however, which is why some income investors like them. Among these two, I see PIMCO Dynamic Income Fund, or PDI, in a more favorable light, due to lower costs, higher liquidity, a higher dividend yield, and due to a better track record.
For those thinking about buying into PDI, it may be important to note that PDI is currently trading ahead of net asset value:
PDI fact sheet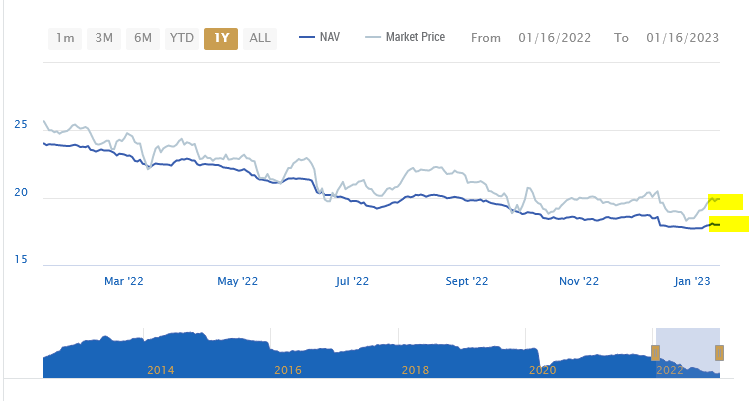
We see that PDI has traded slightly ahead of net asset value over the majority of the last year. At times, it traded at net asset value. Today, the premium to its net asset value is larger than it was, on average, over the last year. Waiting for this gap to narrow down could allow investors to enter PDI at a more favorable price. From a timing perspective, PDI is thus not especially attractive today.
Be the first to comment