

stocknshares/iStock via Getty Images
This ETF review series aims at evaluating products based on price history and current portfolio value and quality. As holdings and metrics change over time, I may update reviews, usually no more than once a year.
PCEF fast facts
The Invesco CEF Income Composite ETF (NYSEARCA:PCEF) is a fund of funds. It tracks the S-Network Composite Closed-End Fund Index. The distribution rate (7.29% as of writing) is very attractive. However, the cost of ownership is high: adding ETF management fees (0.50%) and holdings fees (1.47%), the total expense ratio is 1.97%.
PCEF has 125 holdings screened on several factors. In particular, management fee must be under 1.25% and premium must be under 20%. Weights are based on net asset value and adjusted to favor funds with a discount and penalize those with a premium. Weights are capped at 8%, currently they are all below 5%. The top 10 holdings, listed below, represent 26% of asset value.
|
Ticker |
Name |
Weight% |
|
PIMCO Dynamic Income Fund |
4.474 |
|
|
Eaton Vance Tax-Managed Global Diversified Equity Income Fund |
3.306 |
|
|
BlackRock Enhanced Equity Dividend Trust |
2.617 |
|
|
Nuveen Preferred & Income Securities Fund |
2.498 |
|
|
Virtus Dividend, Interest & Premium Strategy Fund |
2.36 |
|
|
DoubleLine Income Solutions Fund |
2.318 |
|
|
PIMCO Dynamic Income Opportunities Fund |
2.295 |
|
|
Nuveen S&P 500 Buy-Write Income Fund |
2.159 |
|
|
Eaton Vance Tax-Managed Diversified Equity Income Fund |
2.006 |
|
|
Eaton Vance Limited Duration Income Fund |
1.965 |
Source: Invesco
Performance
PCEF has underperformed the S&P 500 (SPY) in total return by a wide margin since inception (February 2010) with deeper drawdowns. It is not the most appropriate benchmark, but total returns matter. Money is money, should it come from dividends or capital gains.
|
Total Return |
Annual Return |
Drawdown |
Sharpe ratio |
Volatility |
|
|
PCEF |
119.25% |
6.70% |
-41.41% |
0.61 |
11.05% |
|
SPY |
409.81% |
14.40% |
-32.05% |
1.01 |
14.10% |
Data calculated with Portfolio123
This table raises a red flag: the annualized return reinvesting all distributions, without paying any tax on them, is a bit below the current distribution rate, and below the historical average (about 7.8%). PCEF pays a high yield and slowly dissolves the principal. The share price has lost 14.6% since inception:
PCEF share price history (TradingView on Seeking Alpha)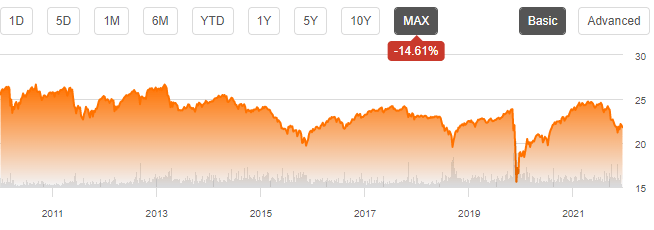
A perishable income stream
To get the full picture, we must also consider a slowly decreasing income stream in nominal value: the monthly distribution per share was about $0.18 in 2010; it is about $0.13 in 2022 (source: Invesco). It is a 28% decrease. In addition to that, inflation hurts both the invested capital and the income stream’s purchase power. It’s not pretty, and it may get worse. In a rising rate environment, closed-end funds would have increasing leveraging costs and probably decreasing share prices (like most high-yield financial instruments). It may accelerate the loss of capital and income stream in nominal value for PCEF shareholders, and even more in inflation-adjusted value.
Comparing PCEF with a simple benchmark
I wrote in a previous paragraph that SPY is not the best benchmark. Now I will show a good one. The next table compares PCEF since inception with a subset of the closed-end fund universe holding the same number of funds than PCEF: the 125 CEFs with higher yields among those with an average liquidity above $100,000 per day and a positive discount to NAV (net asset value). The subset is rebalanced quarterly in equal weights.
|
Total Return |
Annual Return |
Drawdown |
Sharpe ratio |
Volatility |
|
|
PCEF |
119.25% |
6.70% |
-41.41% |
0.61 |
11.05% |
|
Reference subset |
181.91% |
8.94% |
-47.23% |
0.64 |
14.36% |
Past performance is not a guarantee of future returns. Data Source: Portfolio123
This benchmark, much simpler than PCEF strategy, beats it by a significant margin, with a note of caution: ETF returns are real, the benchmark is hypothetical.
Scanning PCEF portfolio
I looked at two metrics in PCEF holdings:
- Discount to NAV (negative is bad).
- Relative discount = Discount to NAV minus its 12-month average (negative is bad).
The fund has 125 holdings, of which 25 have a bad point in these two metrics.
The aggregate discount of the portfolio is inferior to the capital-weighted discount of the full CEF universe (3.5% vs. 6.0%).
The aggregate relative discount is also inferior to the capital-weighted relative discount of the full CEF universe (2.7% vs. 3.1%).
These metrics point to a below-par portfolio value in the CEF universe.
A solution to get high yields without decay
Capital and income decay is a structural issue in many closed-end funds, like in most high-yield instruments. However, it is not inexorable if one knows how to trade CEFs instead of using them as buy-and-hold instruments. I designed a 5-factor ranking system statistically related to forward returns across the full CEF universe, and started publishing the 8 best ranked liquid CEFs in Quantitative Risk & Value (QRV) after the March 2020 market meltdown. The list is updated every week. Its average dividend yield varies around 7-8%. It is not a model portfolio: trading the list every week is too costly in spreads and slippage. Its purpose is finding funds with a good entry point. In the table and chart below I give the hypothetical example of starting a portfolio on 3/25/2020 with my initial “Best 8 Ranked CEFs” list and updating it every 3 months since then, ignoring intermediate updates. Returns are calculated with holdings initially in equal weights without rebalancing until the next 3-month update. Dividends are reinvested at the beginning of every 3-month period.
|
since 3/25/2020 |
Total Return |
Annual Return |
Drawdown |
Sharpe ratio |
Volatility |
|
Best 8 CEFs quarterly |
140.16% |
53.83% |
-9.84% |
2.68 |
15.70% |
|
PCEF |
60.42% |
26.16% |
-14.62% |
1.51 |
12.53% |
|
SPY |
87.71% |
36.28% |
-14.23% |
2.01 |
Best 8 CEFs list vs. SPY (Chart: author: data: Portfolio123)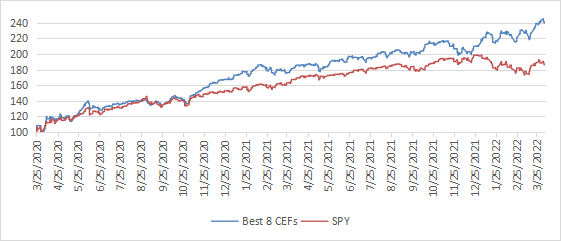
Past performance is not a guarantee of future return. Data calculated with Portfolio123. Dates and lists can be checked in QRV post history (trial is free).
I don’t expect the “Best 8” list to beat SPY like it did in the past 2 years, but a discount-driven rotational strategy in CEFs has a much better chance to protect both capital and income stream against erosion and inflation than any high-yield passive investment like PCEF.
Takeaway
PCEF selects closed-end funds using a sophisticated rule-based strategy. However, past performance, distribution history and valuation measured in aggregate discount are underwhelming. PCEF may be a useful instrument for tactical allocation, swing trading or capturing some market anomalies, but it doesn’t look like a good buy-and-hold investment for people needing a sustainable income and capital preservation.
Be the first to comment