

Ultima_Gaina/iStock via Getty Images
One category of REIT that has been particularly unpopular since the start of the COVID-19 pandemic is the office REIT. Due to social distancing, temporary remote work, and the prospect that remote work might become permanent for many companies, players in this niche were hit particularly hard. As a result, some of them are now trading at fundamentally attractive prices even as they generate strong cash flows. One of the cheaper players in this space is Paramount Group (NYSE:PGRE). But when evaluating the company, you should take into consideration the fact that the company’s track record for growth prior to the pandemic even was not all that fantastic. When you factor in this inability to grow, some discount compared to its peers is likely warranted. So as a result of that, I have decided to rate the enterprise a ‘hold’ at this time, with the view that it could become an attractive prospect if growth eventually develops.
A Big Player In Key Markets
Today, Paramount Group operates as an owner of high-quality Class A office properties that are located in key markets. Management has identified the central business district submarkets of New York City and San Francisco as the company’s playground. As of the end of the company’s latest quarter, it owned a portfolio of 13.9 million square feet. The company currently owns 8 properties (both wholly and partially owned) in New York, totaling 8.6 million square feet. 8.2 million square feet of this space is designated as office space, while the remaining 0.4 million is split between retail, theater, and amenity space. The company has a further 6 wholly and partially owned properties totaling 4.3 million square feet in San Francisco. 4.1 million square feet of this area is office space, with the rest being retail in nature. And finally, the company also has six managed properties totaling 1 million square feet that’s split between New York and Washington, DC.
Paramount Group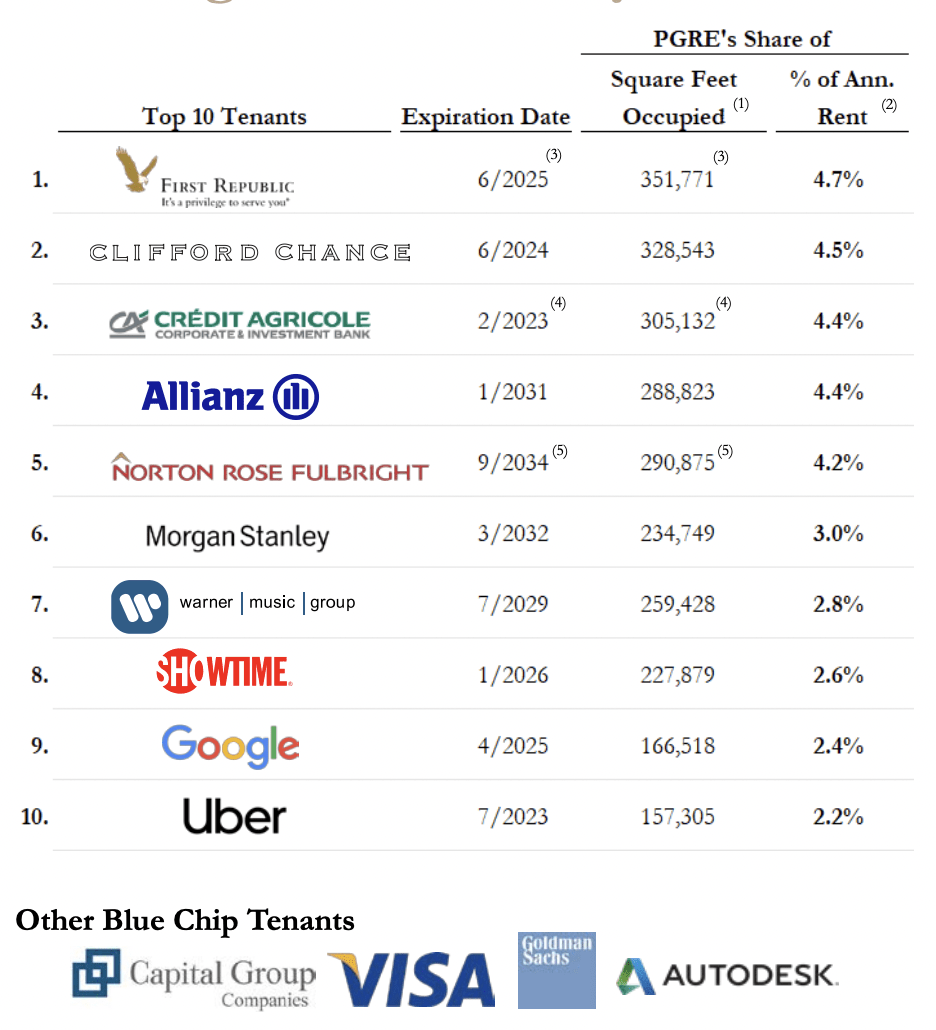
The company is not overly exposed to any one tenant. At present, its largest tenant, First Republic, accounts for just 4.7% of the company’s annualized rent. Its top five tenants make up 22.2% of annualized rent, while its top 10 account for 35.2%. In terms of industry exposure, the greatest concentration for the company is to the legal services space. 22.7% of the company’s annualized rent comes from operators in this market. 21.3% comes from technology and media firms, while financial services dedicated to the commercial and investment banking categories make up 17.8%. All other financial services make up 16.1% of the company’s annualized rent. Other big categories include insurance, travel and leisure, retail, consumer products, and other miscellaneous professional services.
Paramount Group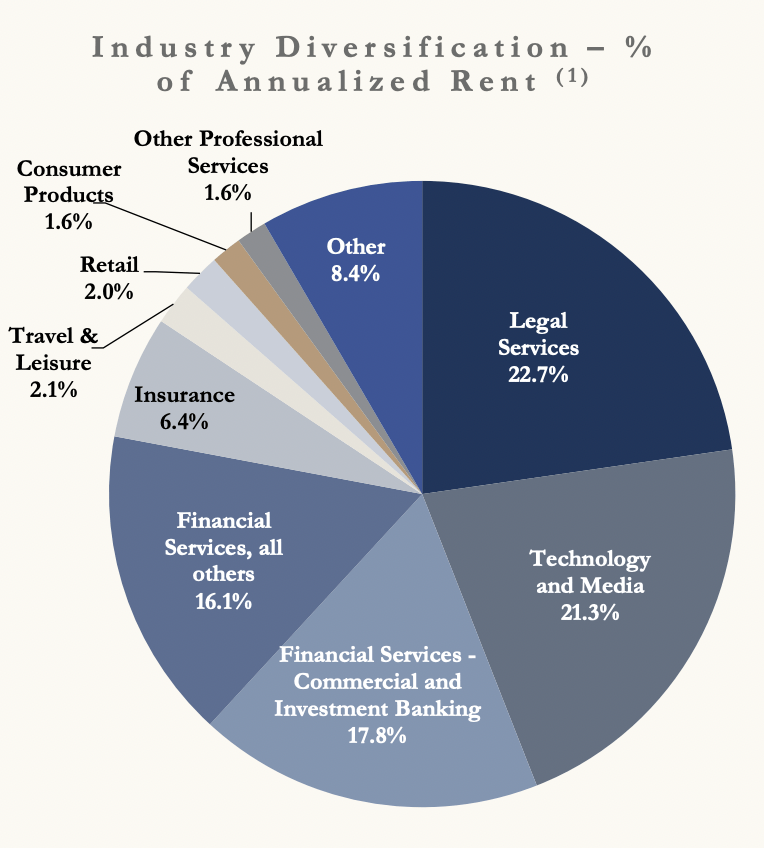
Another interesting thing about the company is the distribution of its leases based on expiration date. This year, leases representing just 2.6% of annualized rent are due to expire. From 2022 through 2026, this number increases to 43.3%. After that, however, the picture it does look far better. In fact, leases representing 32.8% of annualized rent don’t expire until after the year 2031. This should provide the company some stability if management is capable of renewing leases that are due to expire at favorable rates over the next few years.
Paramount Group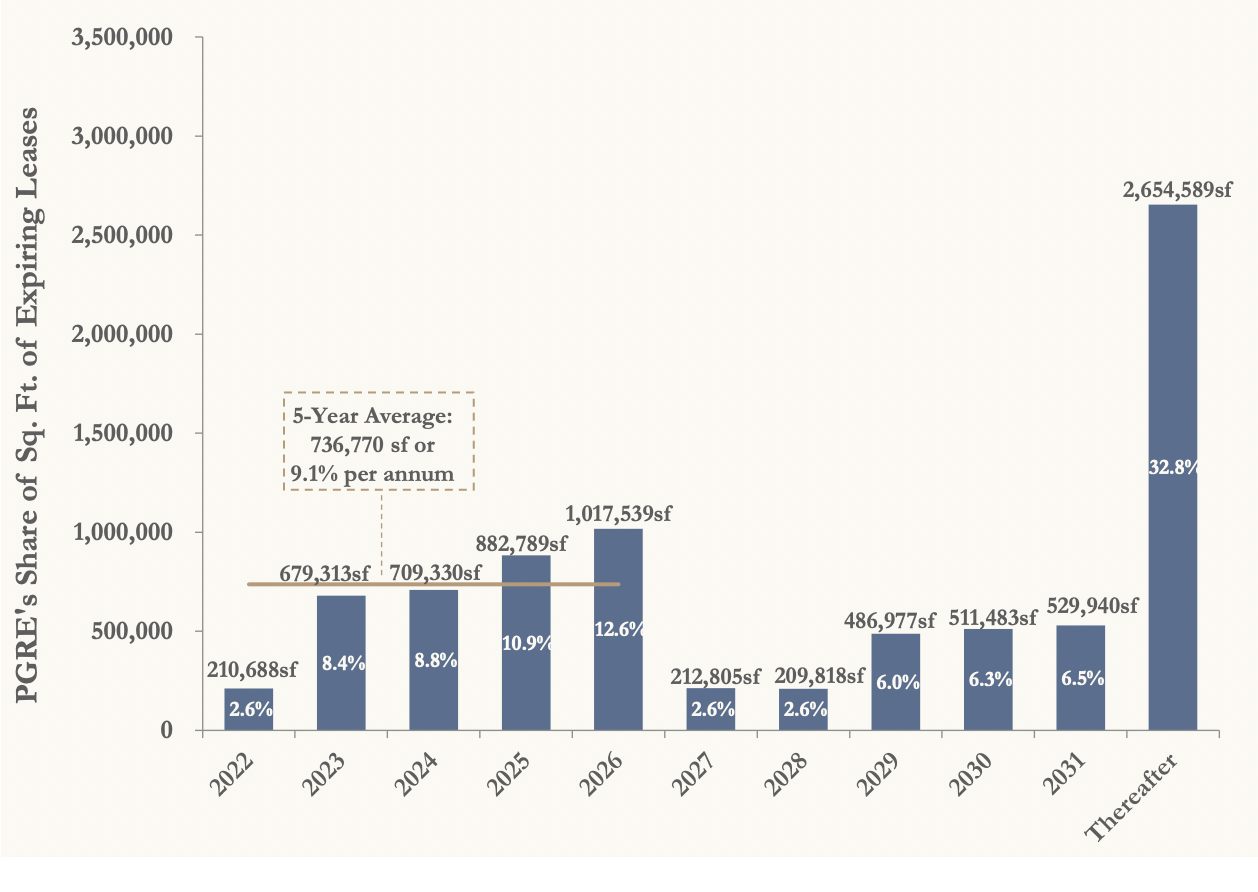
Although the company claims to have some great assets, management has not done a great job growing the business over the past few years. Like almost any office REIT, Paramount Group gets a pass for the pandemic years. However, even then, the business did quite well. But prior to that, the company had demonstrated no real growth. Revenue of $759 million in 2017 rose only modestly to $769.2 million in 2018. In 2019, it fell to $743.8 million. The 2020 fiscal year was a bit more difficult, with sales dipping to $714.2 million before increasing modestly to $726.8 million in 2021. It seems as though the company has suffered some from a decrease in its occupancy rate. After popping up from 94.2% in 2017 to 97% in 2018, it began a consistent year-over-year decline. 2021 was the most difficult for the company, with an occupancy rate of just 90.7%. Management was able to offset some of this pain by increasing the square footage of the company’s portfolio. After dropping from 12.5 million in 2017 to 11.9 million in 2018, square footage began a general increase, eventually hitting 13.9 million by the end of 2021.
Author – SEC EDGAR Data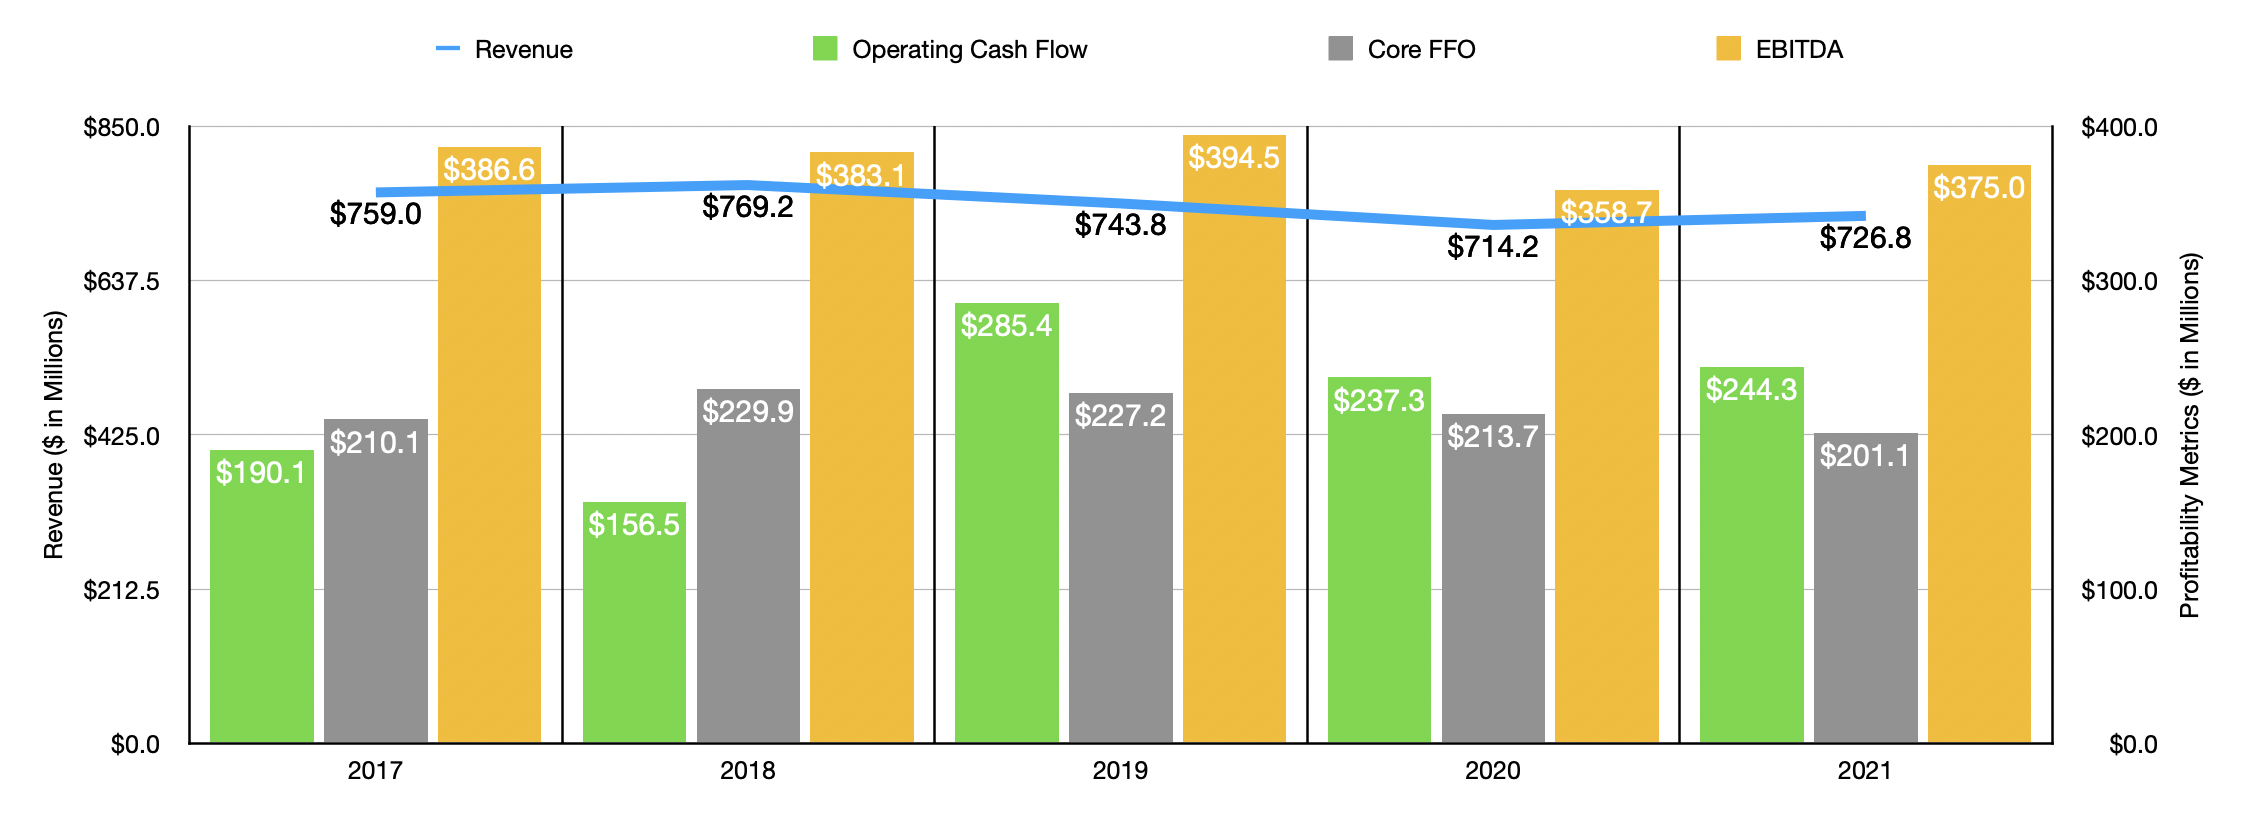
On the bottom line, results have been inconsistent but positive nonetheless. Operating cash flow has been all over the map, ranging from a low point of $156.5 million to a high point of $285.4 million. Core FFO, or funds from operations, has been more stable, with a range of between $201.1 million and $229.9 million. But for four of the past five years, this metric has worsened year over year. The absence of a clear trend in profitability can also be seen when looking at EBITDA. This number has ranged from a low of $358.7 million to a high of $394.5 million over the past five years.
Author – SEC EDGAR Data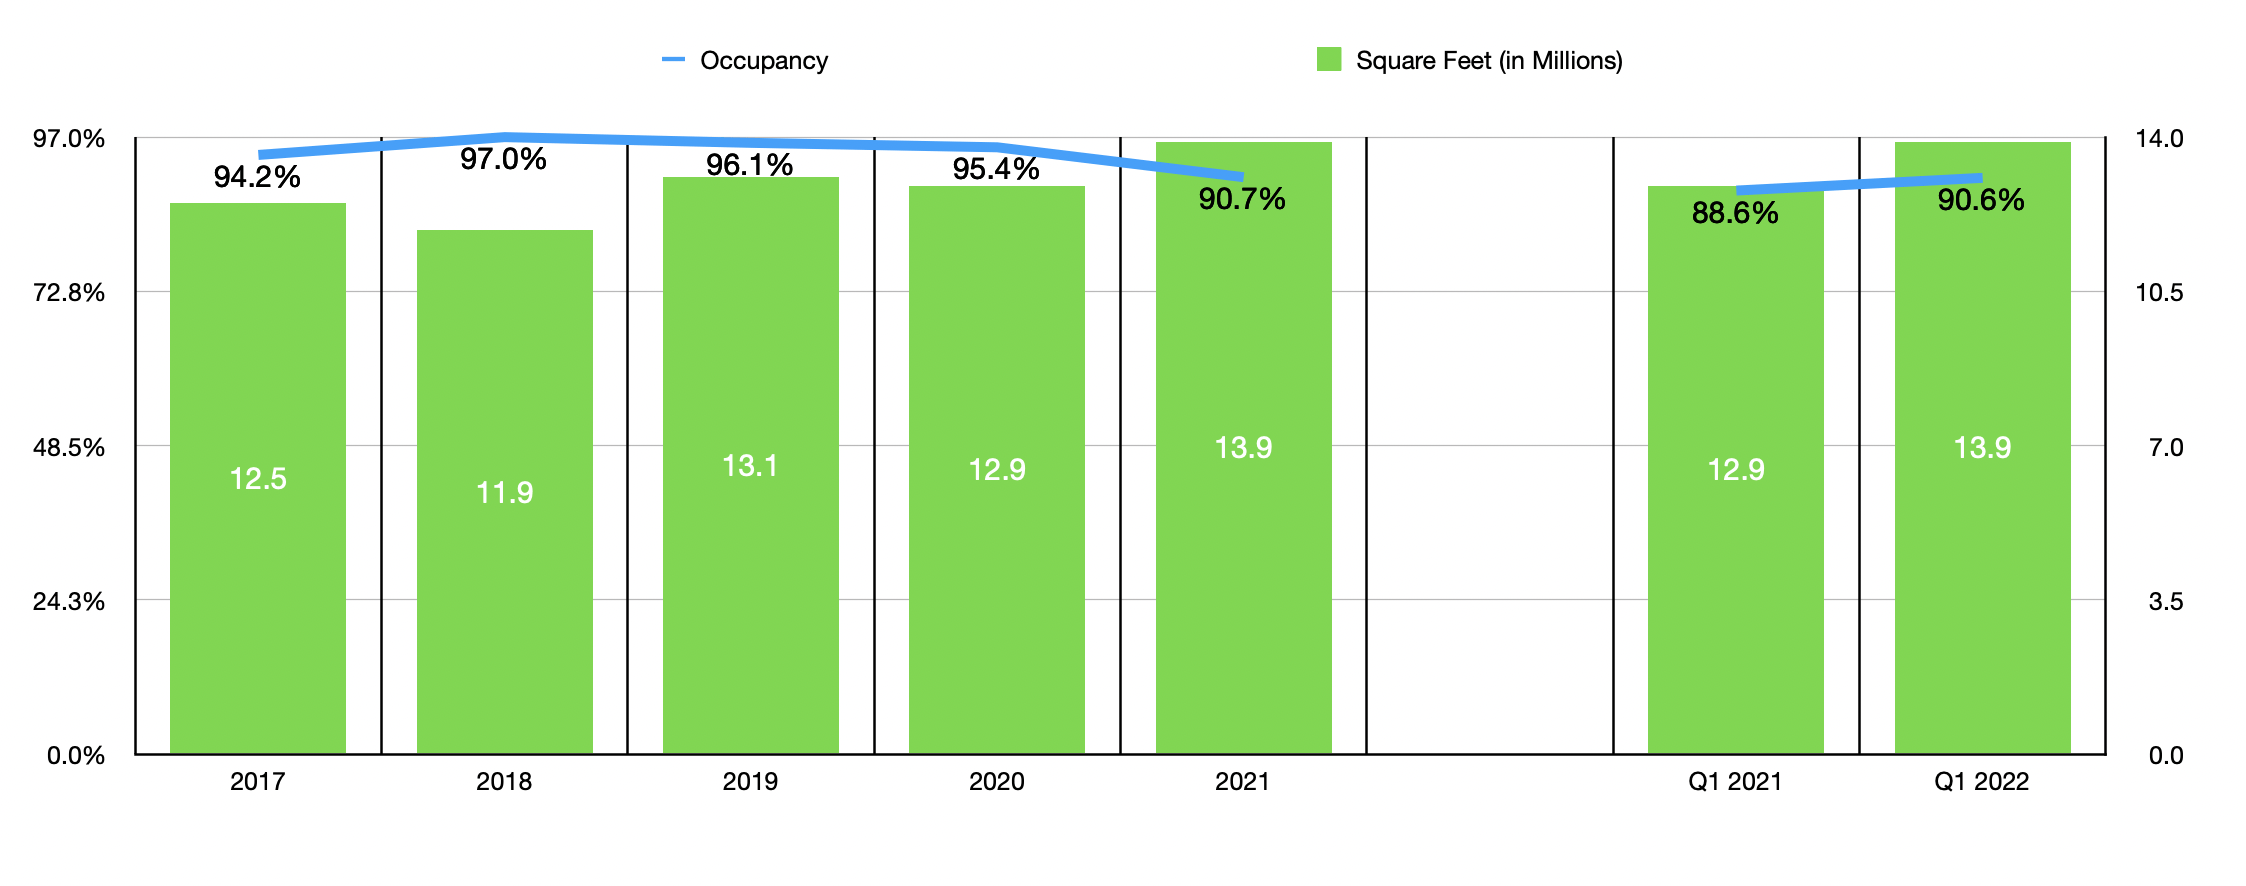
For the first quarter of the company’s 2022 fiscal year, results were generally positive, but nothing special. Revenue of $183.7 million was marginally above the $181.2 million reported for the first quarter of its 2021 fiscal year. This was driven by an increase in square footage from 12.9 million to 13.9 million, as well as by an uptick in the company’s occupancy rate from 88.9% to 90.6%. Profitability followed a similar trajectory, with operating cash flow rising from $58.3 million last year to $58.7 million this year. Core FFO also improved, rising from $50.6 million to $54.6 million, while EBITDA increased from $94.2 million to $96.1 million.
Author – SEC EDGAR Data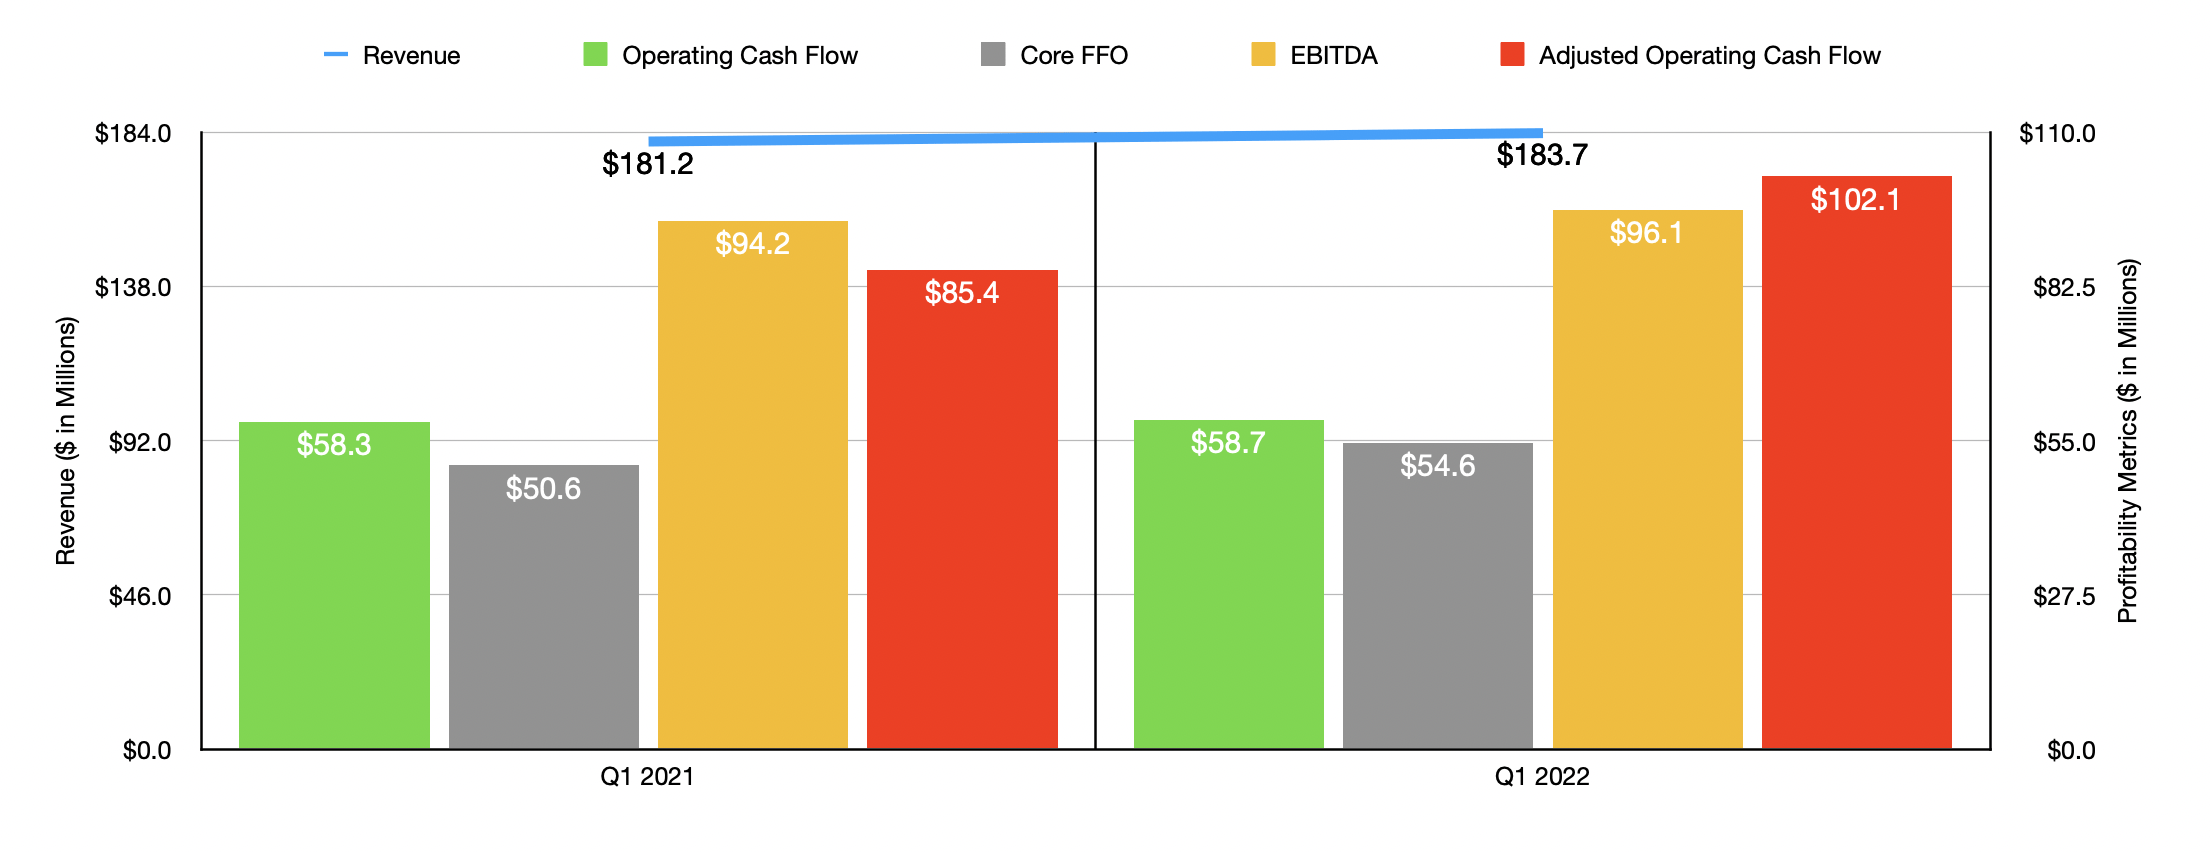
When it comes to the 2022 fiscal year, the only guidance management gave was for core FFO. The current expectation is for this to be between $0.93 and $0.97 per share. At the midpoint, this implies a core FFO of $208.1 million. Given that this number is within that very narrow range demonstrated over the past five years, I have decided to just price the company based on 2021 results. Doing this, we see that the firm is trading at a price to operating cash flow multiple of 9.7. The price to core FFO multiple is only slightly higher at 10.3, while the EV to EBITDA multiple of the company is 16.8. To put the pricing of the company into perspective, I decided to compare it to five similar firms. On a price to operating cash flow basis, these companies ranged from a low of 7.7 to a high of 12.9. In this case, Paramount Group was cheaper than all but one of the firms. Due to the higher leverage the company has, with a net leverage ratio of 9 at this time, we can see that three of the five firms were cheaper than it on an EV to EBITDA basis, with those companies ranging from a low of 2.4 to a high of 17.5.
Author – SEC EDGAR Data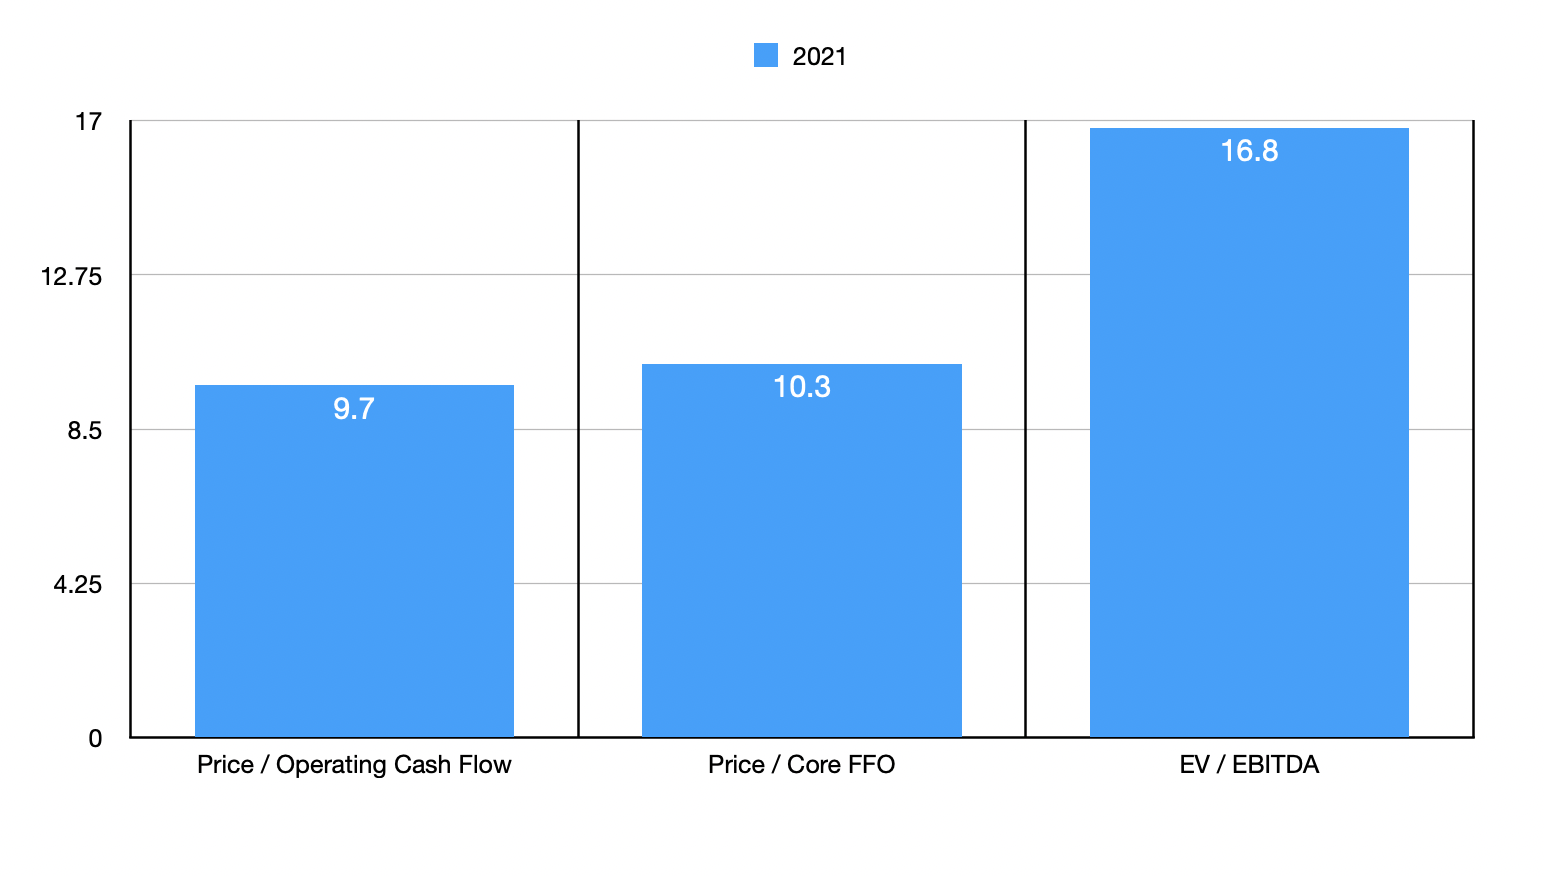
| Company | Price / Operating Cash Flow | EV / EBITDA |
| Paramount Group | 9.7 | 16.8 |
| Highwoods Properties (HIW) | 9.8 | 10.5 |
| Kilroy Realty Corp. (KRC) | 11.6 | 17.5 |
| Corporate Office Properties Trust (OFC) | 11.6 | 16.5 |
| City Office REIT (CIO) | 7.7 | 2.4 |
| Boston Properties (BXP) | 12.9 | 17.0 |
Takeaway
At first glance, Paramount Group strikes me as a company that is trading on the cheap and that owns quality assets in quality markets. However, I am underwhelmed by the inability of the company to grow its top and bottom lines over the past several years, especially prior to the COVID-19 pandemic. The company does have stable cash flows at this time, and it could very well go on to be an attractive investment. However, between the inability to grow and its high leverage, I believe that the business is closer to being fairly valued at this time.
Be the first to comment