

Charles Wollertz
Just over two months ago, I wrote on Pan American Silver (NASDAQ:PAAS), noting that while the company had a tough start to 2022 due to COVID-19-related headwinds, pullbacks below $20.00 would provide buying opportunities. This turned out to be a poor call, given that PAAS plunged below support at $21.40 and didn’t find a floor until ~$18.00. While the stock has now rallied back above this buy point, the issue is that the short-term outlook has deteriorated slightly.
The reason?
Inflationary pressures appear stickier than expected, leading many producers to revise cost guidance higher. This doesn’t apply only to small producers but also to those benefiting from economies of scale like Newmont (NEM), which cited a challenging labor environment. Concurrently, the silver price has fallen sharply since May, stuck beneath the $20.00/oz level even after a 10% rally. The result is that I have less conviction going into Pan American’s Q2 report, with PAAS less immune from these pressures than miners operating relatively high-grade mines and benefiting from hydroelectric power at several operations like Agnico Eagle (AEM). Let’s take a closer look below:
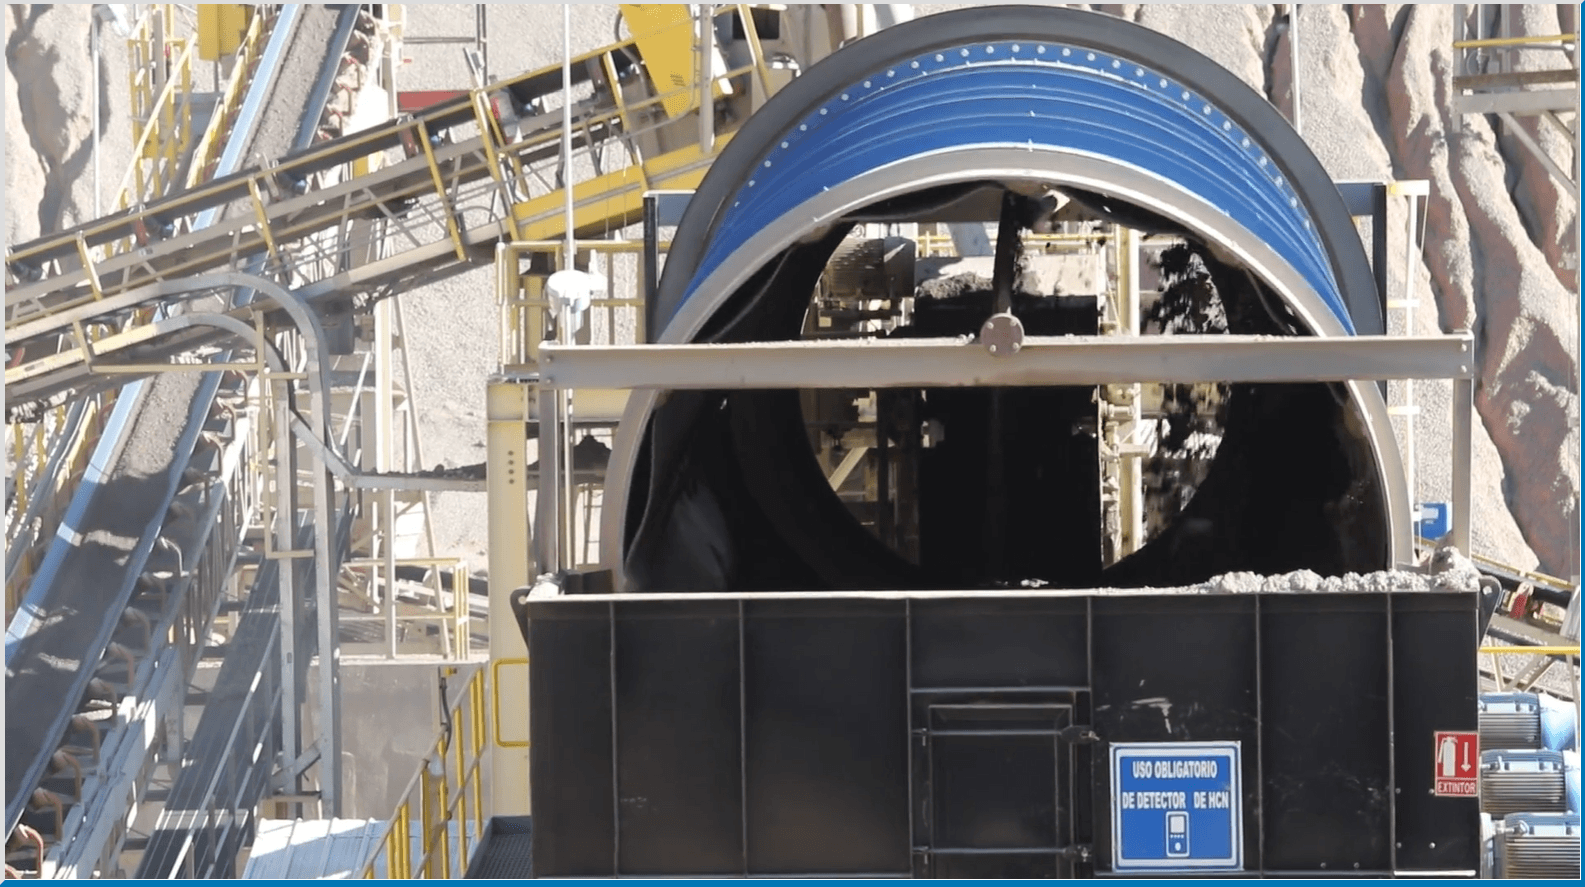
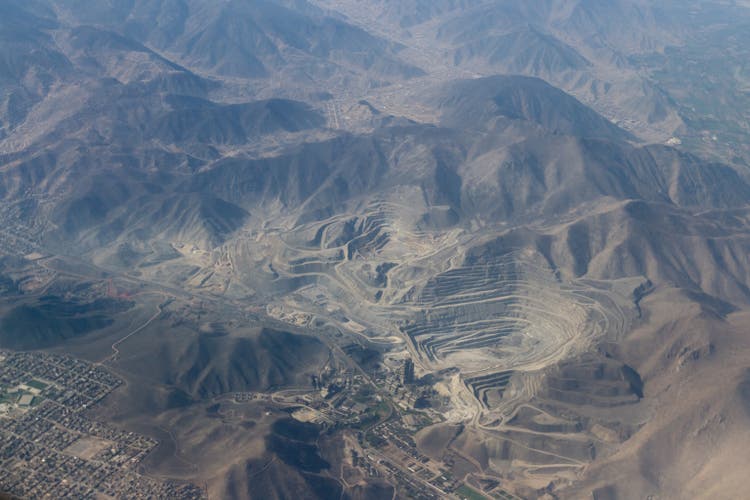
Pan American Silver Operations (Company Presentation)
2022 Guidance
Pan American Silver has guided for production of 19.0 to 20.5 million ounces of silver this year, plus 550,000 to 605,000 ounces of gold. This translates to ~19.8 million ounces of silver and ~578,000 ounces of gold at the mid-point, or an equivalent profile of ~825,000 gold-equivalent ounces [GEOs], giving it a similar production profile to names like SSR Mining (SSRM) and Evolution Mining (OTCPK:CAHPF), and just shy of B2Gold (BTG). While Pan American’s production guidance looks achievable despite the slow start to the year due to COVID-19-related headwinds, there’s a bit of a question mark around costs.
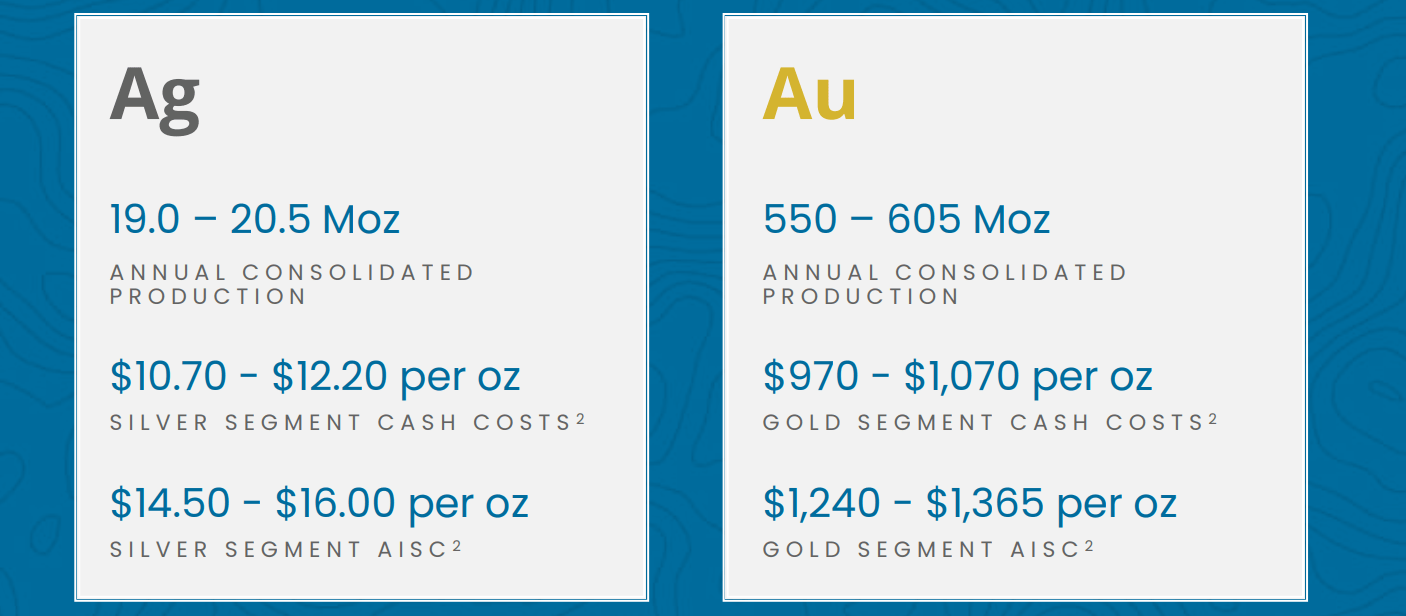
Pan American Silver 2022 Guidance (Company Presentation)
As shown above, FY2022 all-in sustaining costs have been estimated at $15.25/oz at the mid-point (silver segment) and a $1,300/oz mid-point (gold segment), but this was based on 5-10% cost inflation according to the company. This is similar (albeit slightly higher) than what most producers were guiding for in 2022 on inflation, so there wasn’t any reason to doubt this guidance. However, with the Q2 Earnings Season more than half complete and several miners already revising their cost guidance higher (and not by an insignificant amount), it’s unclear whether Pan American baked in enough conservatism.
Inflationary Pressures
One example of significant cost escalation was Newmont, which should have been one of the companies to be a little more insulated due to the size of its mines that benefit from economies of scale and a new Autonomous Haulage Fleet. However, Newmont noted that it’s anticipating an additional 7% on top of the 5% it guided for, impacted by increases in global commodities and raw materials (things like cyanide, explosives), higher diesel prices, and labor costs. If we compare this to what appears to be a 7.5% mid-point cost inflation assumption for Pan American, its assumptions may have been on the light side, and it already warned of diesel, consumables, and supply chain cost pressures in Q1.
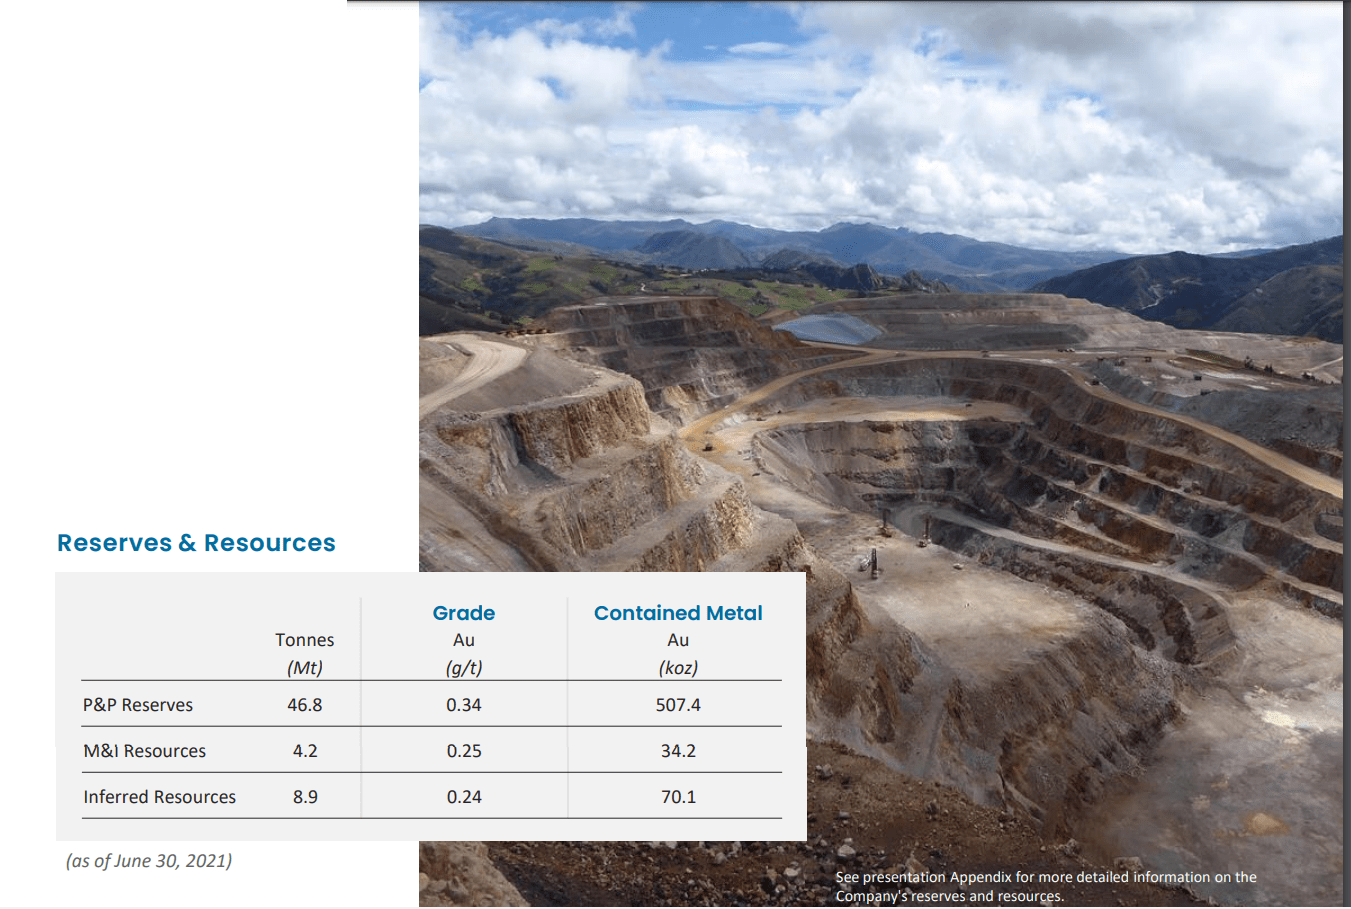
La Arena Mine & Reserves (Company Presentation)
The good news when it comes to Pan American is that it is not dealing with the ultra-light Australian labor market that is impacting producers in Australia, and it also has limited exposure to Canada, another jurisdiction Newmont called out as a tight labor market. This is because it has no operations in Australia and only one operation making up less than 15% of production in Canada (Timmins Operation). For this reason, Pan American might be able to steer clear of the sharp cost escalations from a labor standpoint that some producers in prolific regions have experienced.
That said, Pan American does operate several relatively high-volume and low-grade mines in its gold segment (Dolores, La Arena, Shahuindo), which could be more sensitive to fuel, and consumables inflation. Additionally, while Timmins is an underground operation, it’s relatively low-grade, and it’s seeing additional ground support and backfill costs. Meanwhile, its much lower-cost Morococha Mine went into care & maintenance in late February to allow for the expansion of Chinalco’s neighboring mine. Finally, while base metals prices helped from a by-product standpoint in Q1, they have pulled back sequentially (copper, lead, zinc) as shown above.
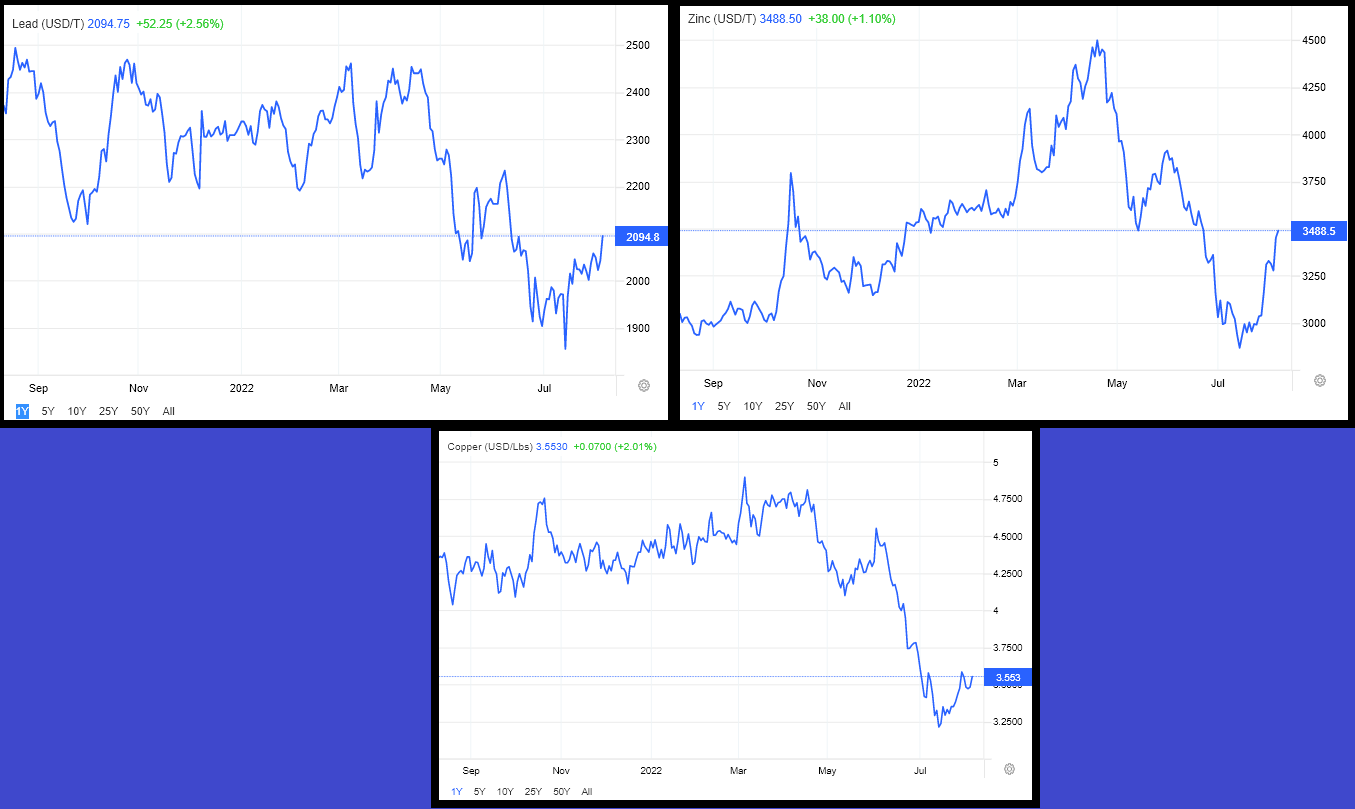
Base Metal Prices (Trading Economics)
The only real positive offset is that while inflationary pressures remain a concern, local currencies have moved in the company’s favor (but it’s not clear whether they’ve moved enough to offset higher fuel and consumables costs). This is evidenced by the pullback in the Peso vs. the US Dollar (UUP), the pullback in the Peruvian Sol vs. the US Dollar, and the weaker Canadian Dollar. Compared to companies operating in the United States with currency headwinds due to the strengthening US Dollar and inflationary pressures, this is at least some offset this year.
Metals Prices
While the inflationary pressures are a concern and could impact this year’s margin outlook, the decline in metals prices hasn’t helped, with gold losing the psychological $1,800/oz level and silver below $20.00/oz. This suggests that we could see an average realized silver price of $22.75/oz this year or lower vs. all-in sustaining costs of $16.00/oz for Pan American, translating to $6.75 – $7.00/oz AISC margins. If we compare this to its FY2021 results, margins would decline by more than 25% (FY2021: $9.38/oz). On the gold side, margin compression could also be significant.
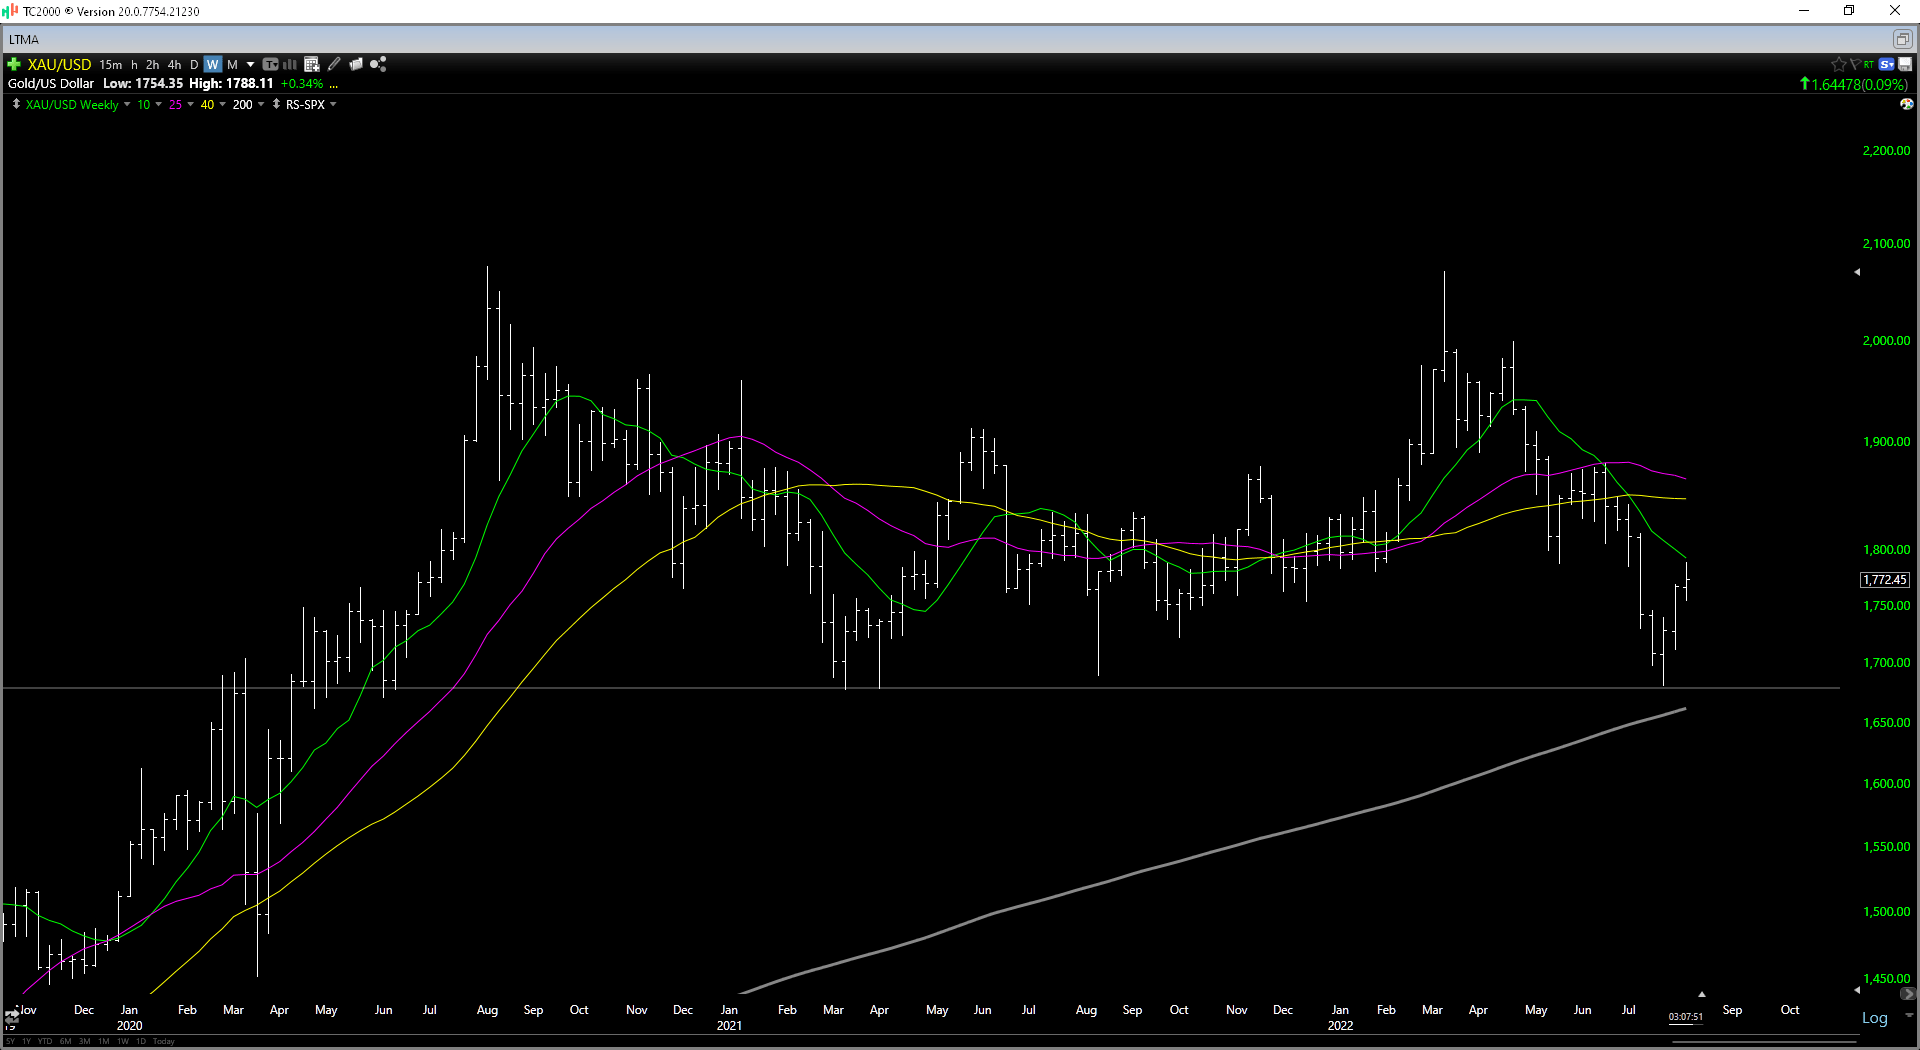
Gold Futures Price (TC2000)
This is because while the gold price looks like it could come in above $1,810oz or a 1% increase year-over-year for Pan American due to the strong H1 2022 (FY2021 realized price: $1,792/oz), all-in sustaining costs could increase to $1,335/oz or higher. If we use these assumptions, Pan American’s AISC margins for its gold segment would come in at $475/oz, which would translate to a 17% decline vs. $578/oz in FY2021 and $747/oz in FY2020.
Assuming these inflationary pressures aren’t as sticky as some producers are worried they might be, we should see costs dip back below $1,200/oz in 2023, with silver segment AISC dipping below $14.00/oz. Still, the margin outlook for 2022 isn’t great, even if 2023 will benefit from lower costs on the back of higher production levels. Given this outlook, a sharp pullback can’t be ruled out, but the long-term picture remains fine, and Pan American’s cost profile and valuation are certainly better than First Majestic’s (AG), which still trades at more than 2.0x P/NAV with a higher cost profile. Let’s look at PAAS’ valuation below:
Valuation
Based on ~211 million shares outstanding and a share price of US$21.50, Pan American trades at a market cap of ~$4.54 billion. This is a very reasonable valuation for a company producing ~800,000 gold-equivalent ounces per annum, even if less than 20% of production comes from Tier-1 ranked jurisdictions (Canada, Finland, Australia, United States). In fact, if we look at Pan American’s historical cash flow multiple below, we can see that the stock has historically traded at ~13.7x cash flow (15-year average) and currently trades at just 11x FY2022 cash flow estimates ($1.94).

Pan American Silver – Historical Cash Flow Multiple (FAST Graphs)
Even if we use a more conservative cash flow multiple of 12.3 for Pan American (10% discount to historical multiple) and more conservative FY2023 cash flow estimates of $2.12, this translates to a fair value of $26.10, or 33% upside from current levels to its 18-month price target. Notably, these cash flow estimates assume a silver price of $21.50/oz and a gold price of $1,750/oz for 2023, which I would argue to be relatively conservative. Hence, I see an upside to this price target if metals prices can rebound sharply, with the potential that the stock could make a run towards resistance at $29.50-30.50 per share in the next 12 months.
Technical Picture
Finally, if we look at the technical picture, the reward/risk ratio has degraded, with Pan American breaking below a critical support zone at $21.40 earlier in June. This was a key support area for the stock in Q4 2021, Q1 2022, and much of Q2 2022, and this has left a new resistance level at $21.40, with previous support zones often becoming new resistance levels. With PAAS now rallying back towards this resistance area and the next support level not coming in until $17.60, this has created a less favorable reward/risk setup from $20.50.
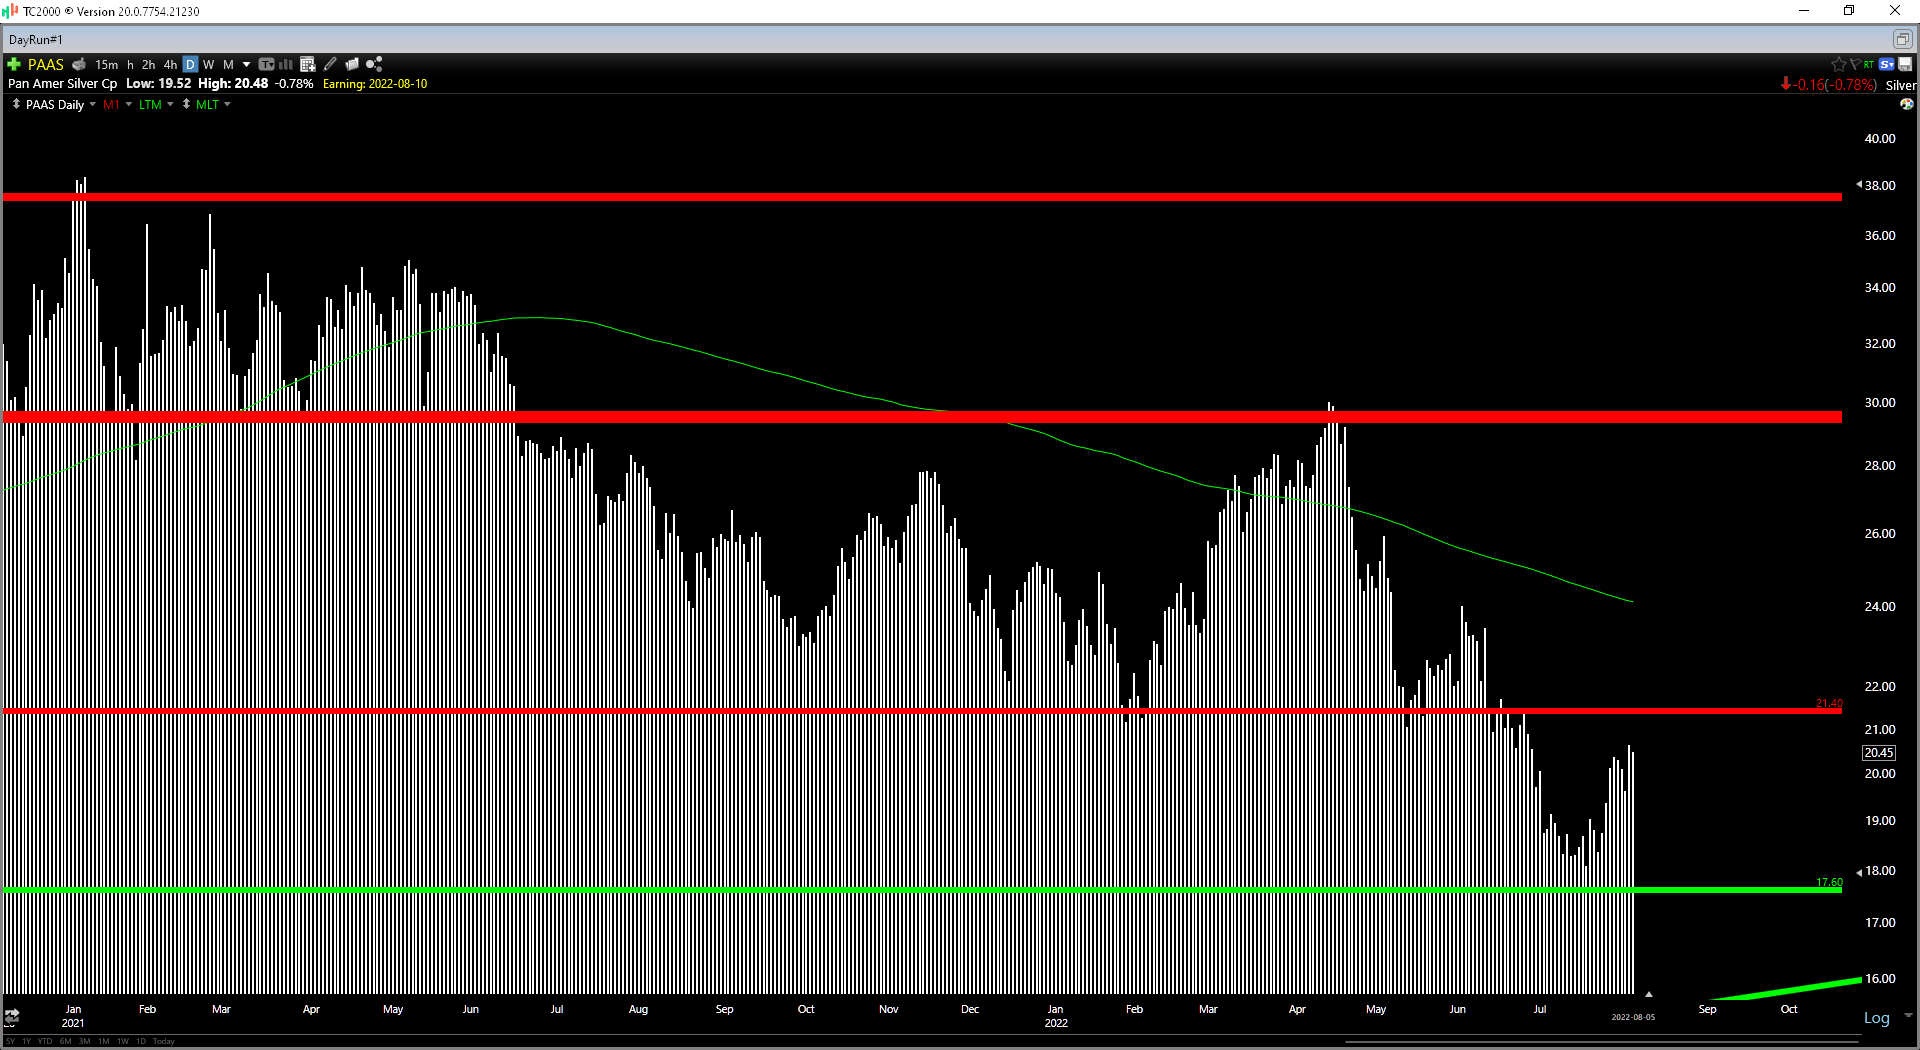
PAAS Daily Chart (TC2000)
This doesn’t mean that the stock can’t go higher, but with some uncertainty about whether the company will need to adjust its cost guidance, the setup isn’t great heading into earnings with a short-term reward/risk ratio of 0.31 to 1.0. Based on this outlook, if I wanted to own the stock, I think the better trade is looking for weakness post-earnings to establish a position, not paying $20.50+ ahead of a key report. Obviously, the risk is that PAAS rallies sharply on earnings if it beats estimates/doesn’t adjust guidance. Still, with other names trading at cheaper valuations, such as Agnico Eagle at 7.3x FY2023 cash flow estimates (historical multiple: ~19), I think there are safer places to be currently.
The short-term reward/risk ratio is based on $0.90 in potential upside to short-term resistance ($21.40) and $2.90 in potential downside to support ($17.60).
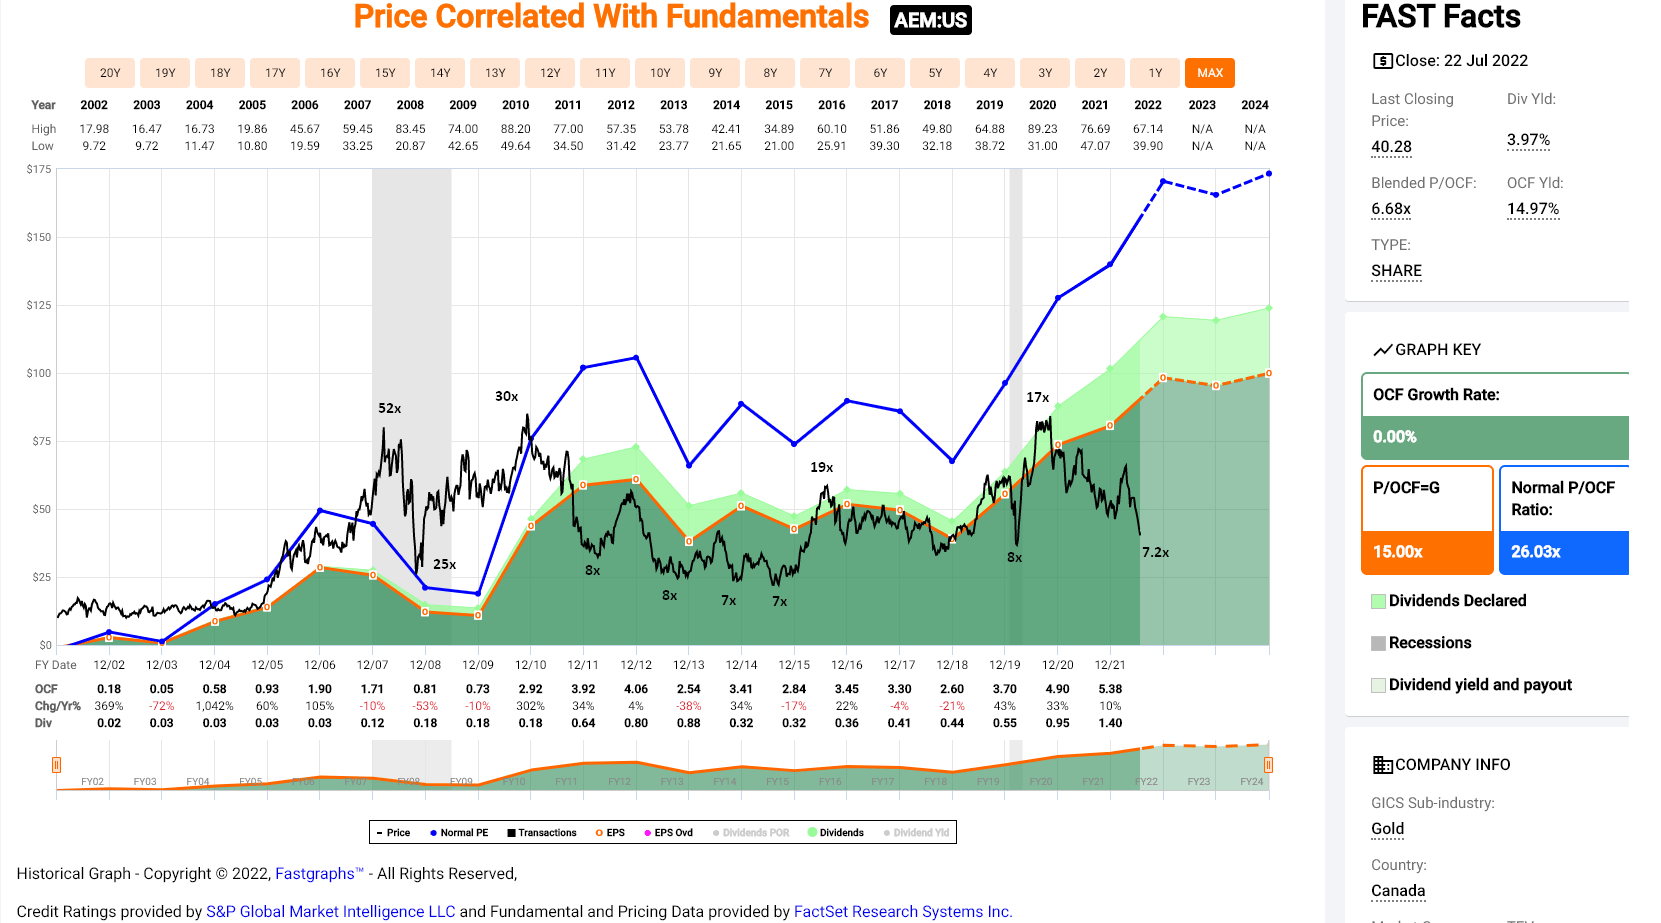
Agnico Eagle – Historical Cash Flow Multiple (FAST Graphs)
Summary
Pan American is currently trading at its most attractive valuation since April 2020, and for investors looking for leverage to the silver price, it is one of the better ways to get exposure. That said, I don’t have as much conviction on PAAS regarding its ability to hold the line on cost guidance. This is because it operates relatively high-volume, low-grade mines that are sensitive to inflationary pressures (gold segment), and there appears to be labor tightness in Ontario, potentially affecting its Canadian asset’s productivity.
Fortunately, the company will get some help from the strengthening United States Dollar relative to its local currencies. Still, I’m not sure if the currency softness is enough to hold the line on cost guidance. The good news is that some of this risk of cost creep looks priced into the stock at ~11x cash flow, but with the slight downgrade in the technical picture and weakening metals prices, the better move looks to be waiting for lower prices to establish a new position. For now, I see the lower-risk buying opportunity being below $18.15, within 5% of key support at the $17.50-17.60 region.
Be the first to comment