

Darren415
While Oxford Lane Capital (NASDAQ:OXLC)’s near 15% current distribution yield looks attractive, my analysis highlights areas of concern. First, the constant decline in NAV is troubling. Secondly, total expenses for the fund are > 10% in the latest fiscal year. Finally, as the economy continues to slow down, now might not be the best time to invest in a credit sensitive vehicle like OXLC.
Fund Overview
Oxford Lane Capital is a closed end fund (“CEF”) that primarily invests in equity tranches of Collateralized Loan Obligations (“CLO”). The fund currently has a market cap of $900 million, although the underlying net asset value (“NAV”) could be different. Most recently, management estimated the July 31st NAV at $5.36-5.46 per share, versus the market price of $6.67 on July 29th, for a roughly 23% premium.
Strategy
Oxford Lane’s investment strategy is to invest in a portfolio of CLOs. A CLO is a collection of bank loans that have been securitized and tranched (Figure 1). The securitization and tranching allows investors to select the type of risk they wish to bear. For example, risk averse investors may wish to invest in the highly rated AAA notes, while risk seeking investors may wish to invest in the equity tranches. Investors who wish to learn more about CLOs are encouraged to do their research online, for example, here.
Figure 1 – CLO structure (Oxford Lane website)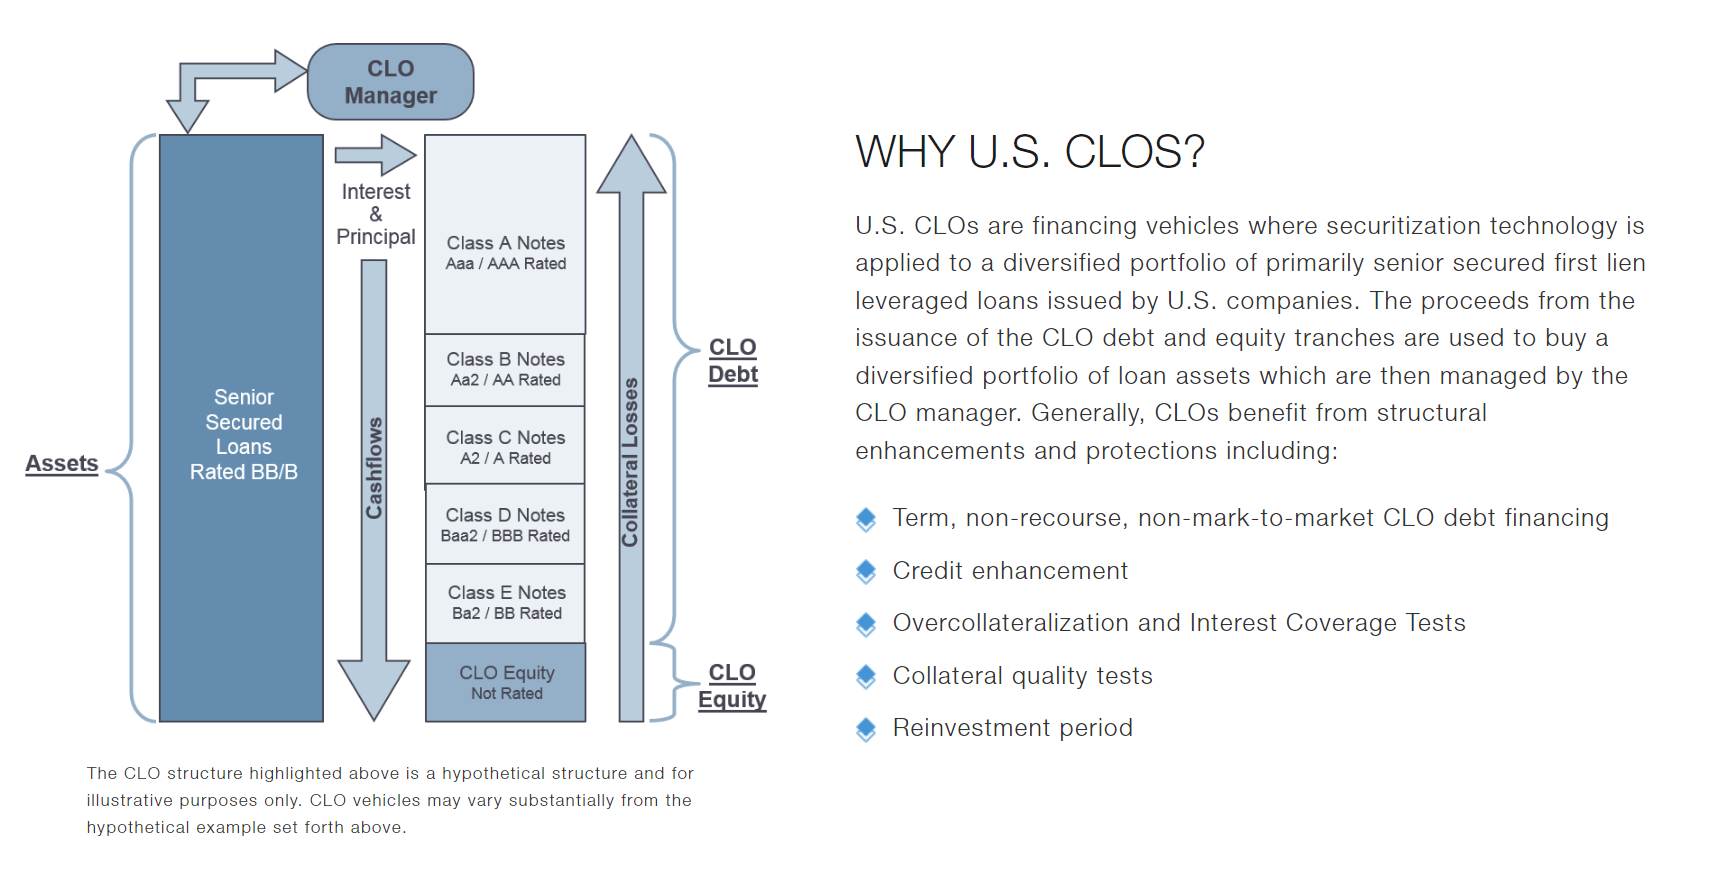
Oxford Lane focuses on CLOs because historically, leveraged loans have performed well, with only 2 years of negative returns since 1992 (Figure 2). Note, Figure 2 shows annual returns for the Credit Suisse Leveraged Loan Index. Individual loan returns may differ significantly from the index. In addition, as the loans are securitized and tranched, CLO equity tranche returns may differ significantly as well.
Figure 2 – CS Leveraged Loan Index returns (Oxford Lane website)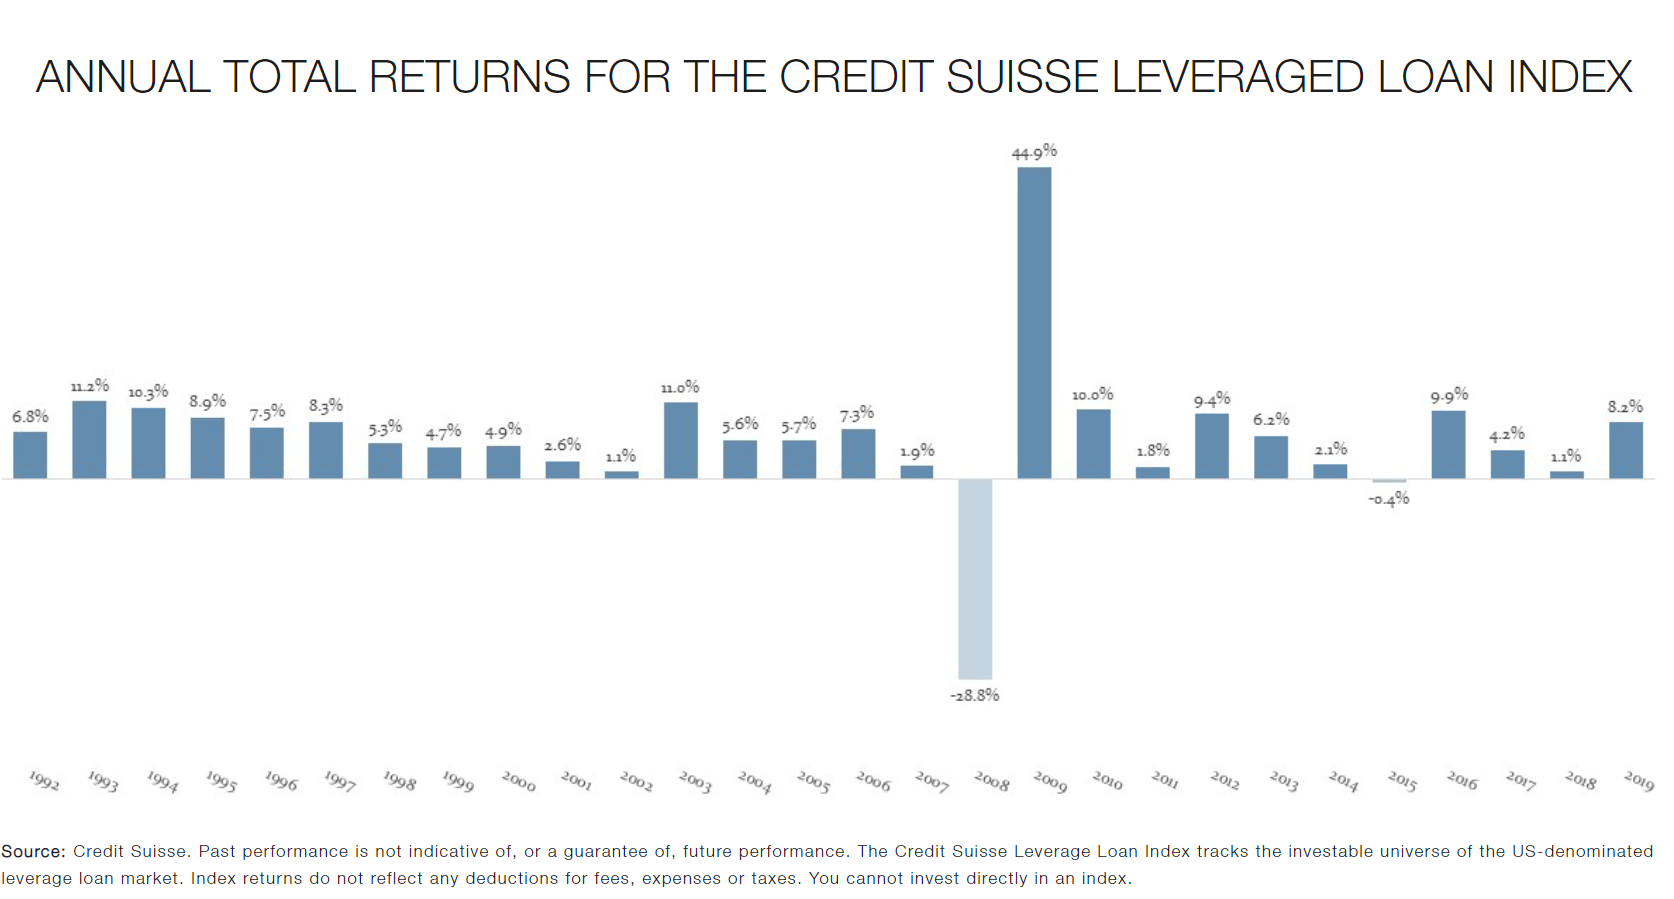
Oxford Lane currently focuses on the equity tranches of CLOs, where returns and risk are both the greatest (Figure 2). However, there has been periods in its history when Oxford Lane had significant investments in CLO debt tranches. In 2011 for example, CLO debt was over 50% of the portfolio.
Figure 3 – Oxford Lane CLO exposure (Oxford Lane Q1/F23 investor presentation)
Portfolio Holdings
As CLOs are managed by external CLO managers, it’s hard to gauge the actual underlying exposures just by looking at Oxford Lane’s portfolio holdings. From the most recent Q1/F23 quarterly presentation, we know that Oxford Lane has investments in 148 CLO equity tranches with $1.05 billion in fair value, and 14 CLO debt tranches, with $33 million in fair value (Figure 4).
Figure 4 – Oxford Lane Portfolio Summary (Oxford Lane Q1/F23 investor presentation)
Additional statistics on the portfolio are shown in Figures 5 to 7. Figure 5 shows that the portfolio is fairly diversified, with almost 2,000 obligors and no single obligor (looking through to the underlying loans) representing more than 1% of the portfolio.
Figure 5 – CLO Collateral Characteristics (Oxford Lane Q1/F23 investor presentation)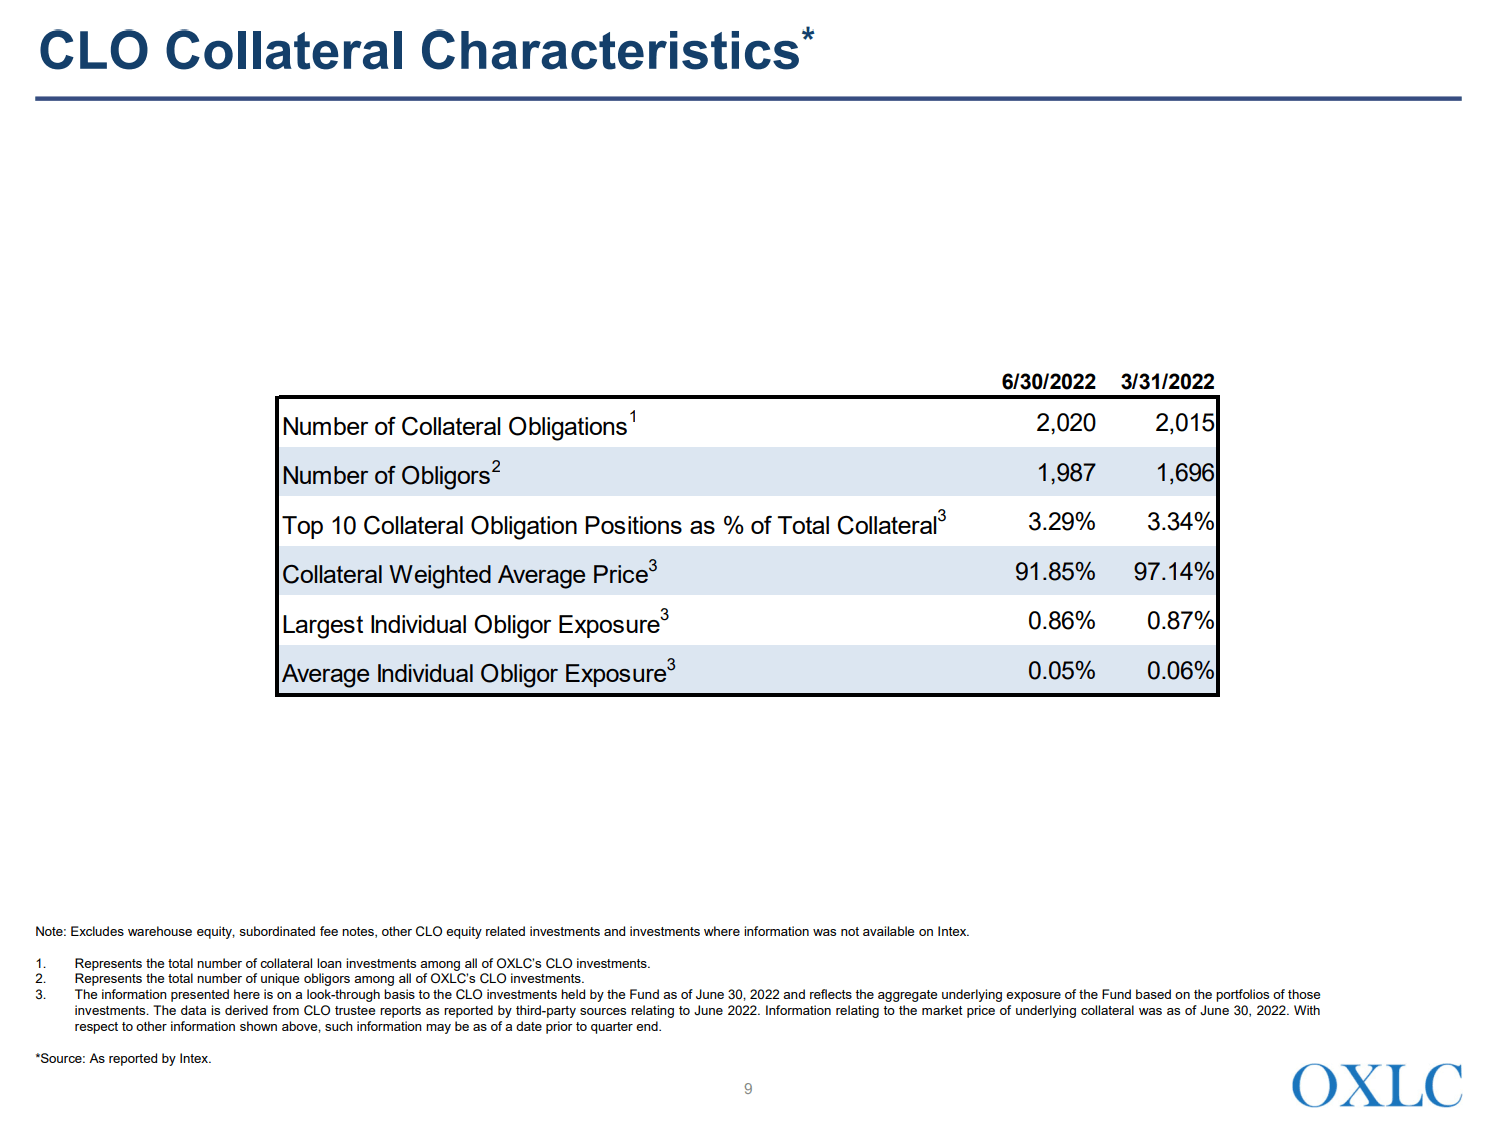
Figure 6 shows the portfolio has a weighted average effective CLO debt yield of 15.8% at current cost and weighted average cash distribution yield of 29.0% for CLO equity tranches (Figure 6).
Figure 6 – CLO yields (Oxford Lane Q1/F23 investor presentation)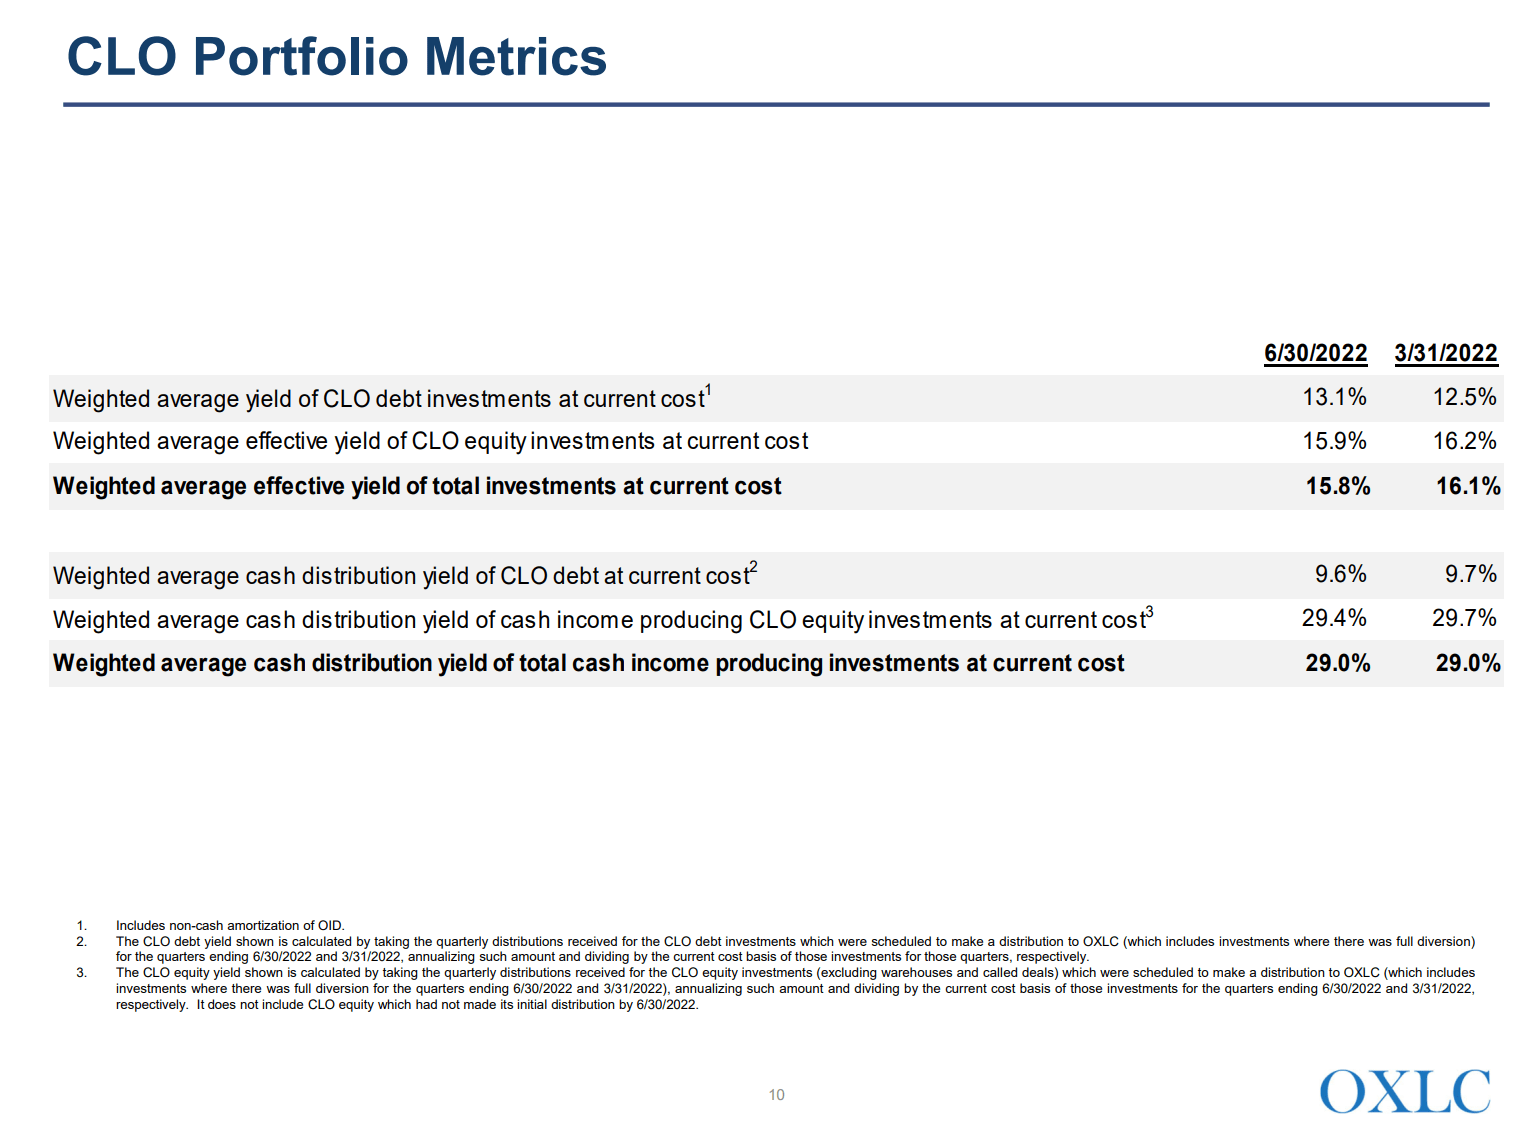
Finally, Figure 7 shows the portfolio segmented by the underlying industry exposures.
Figure 7 – industry exposures (Oxford Lane Q1/F23 investor presentation)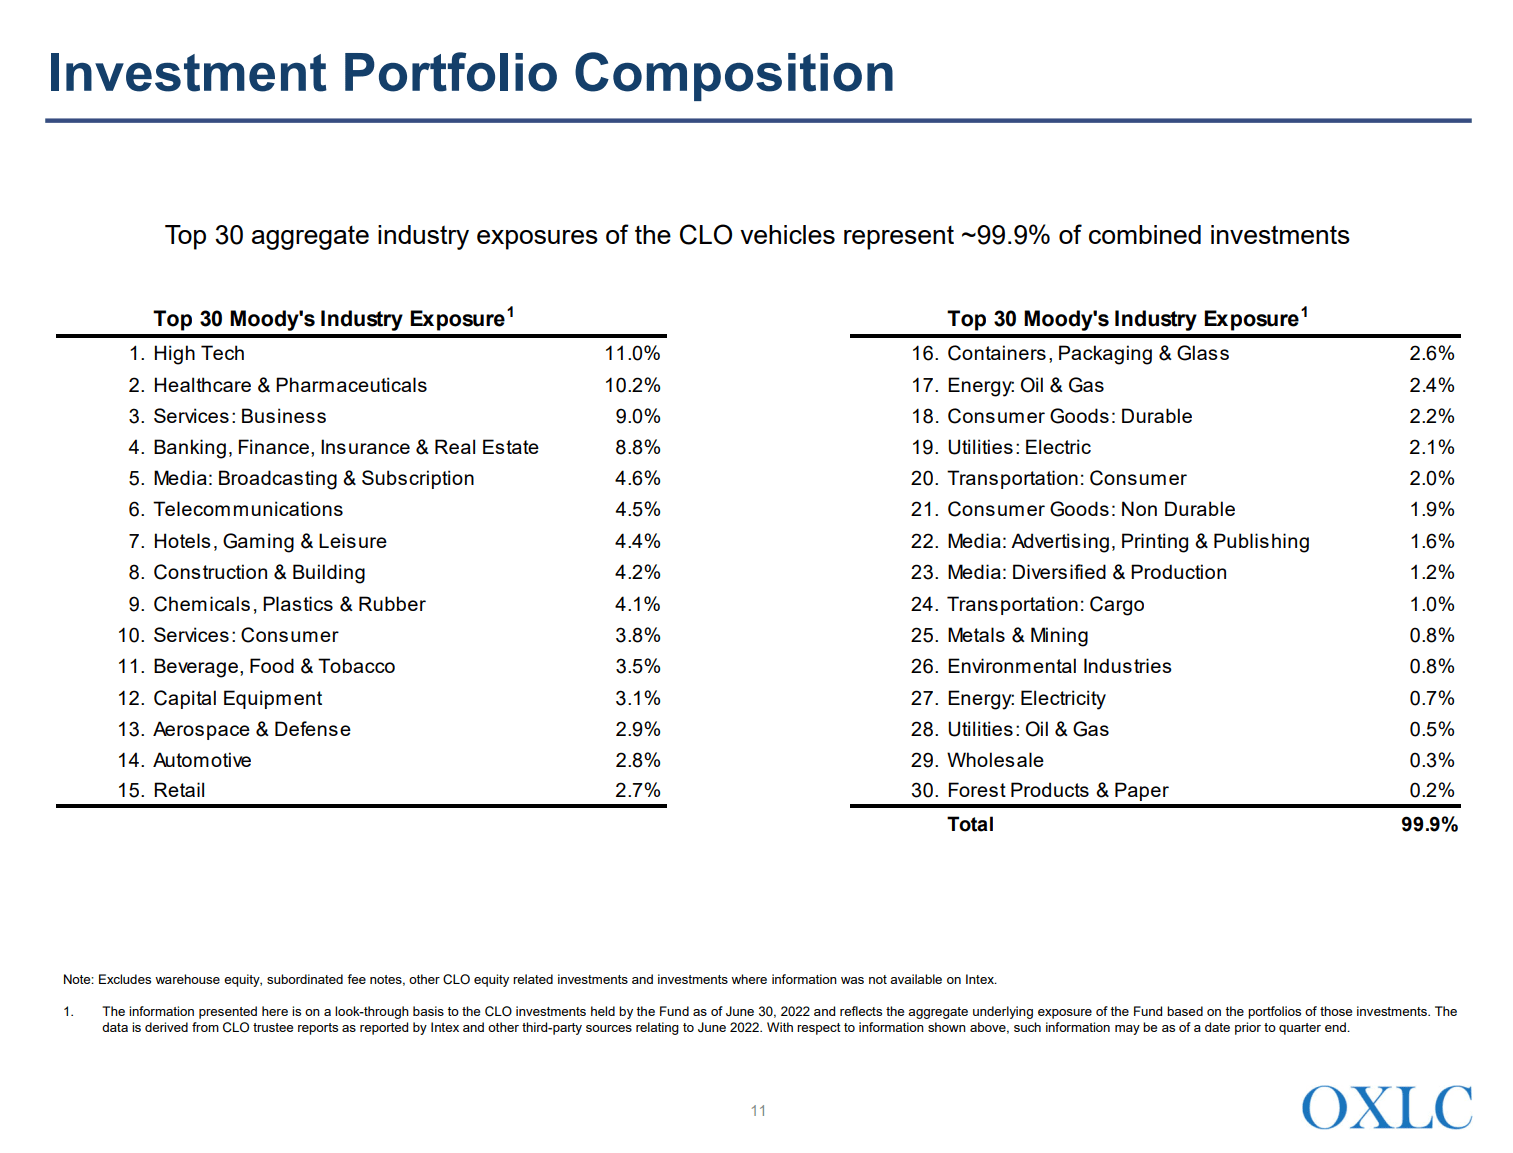
Returns
According to company literature, Oxford Lane has had pretty strong investment performance as compared to the S&P BDC Index, as shown by Figure 8 from OXLC’s F2022 annual report. Note, the figures at the bottom say ‘average annual returns’, however, I believe it should read ‘cumulative total returns’ for the 5 Year and 10 Year figures.
Figure 8 – OXLC returns (Oxford Lane 2022 Annual Report)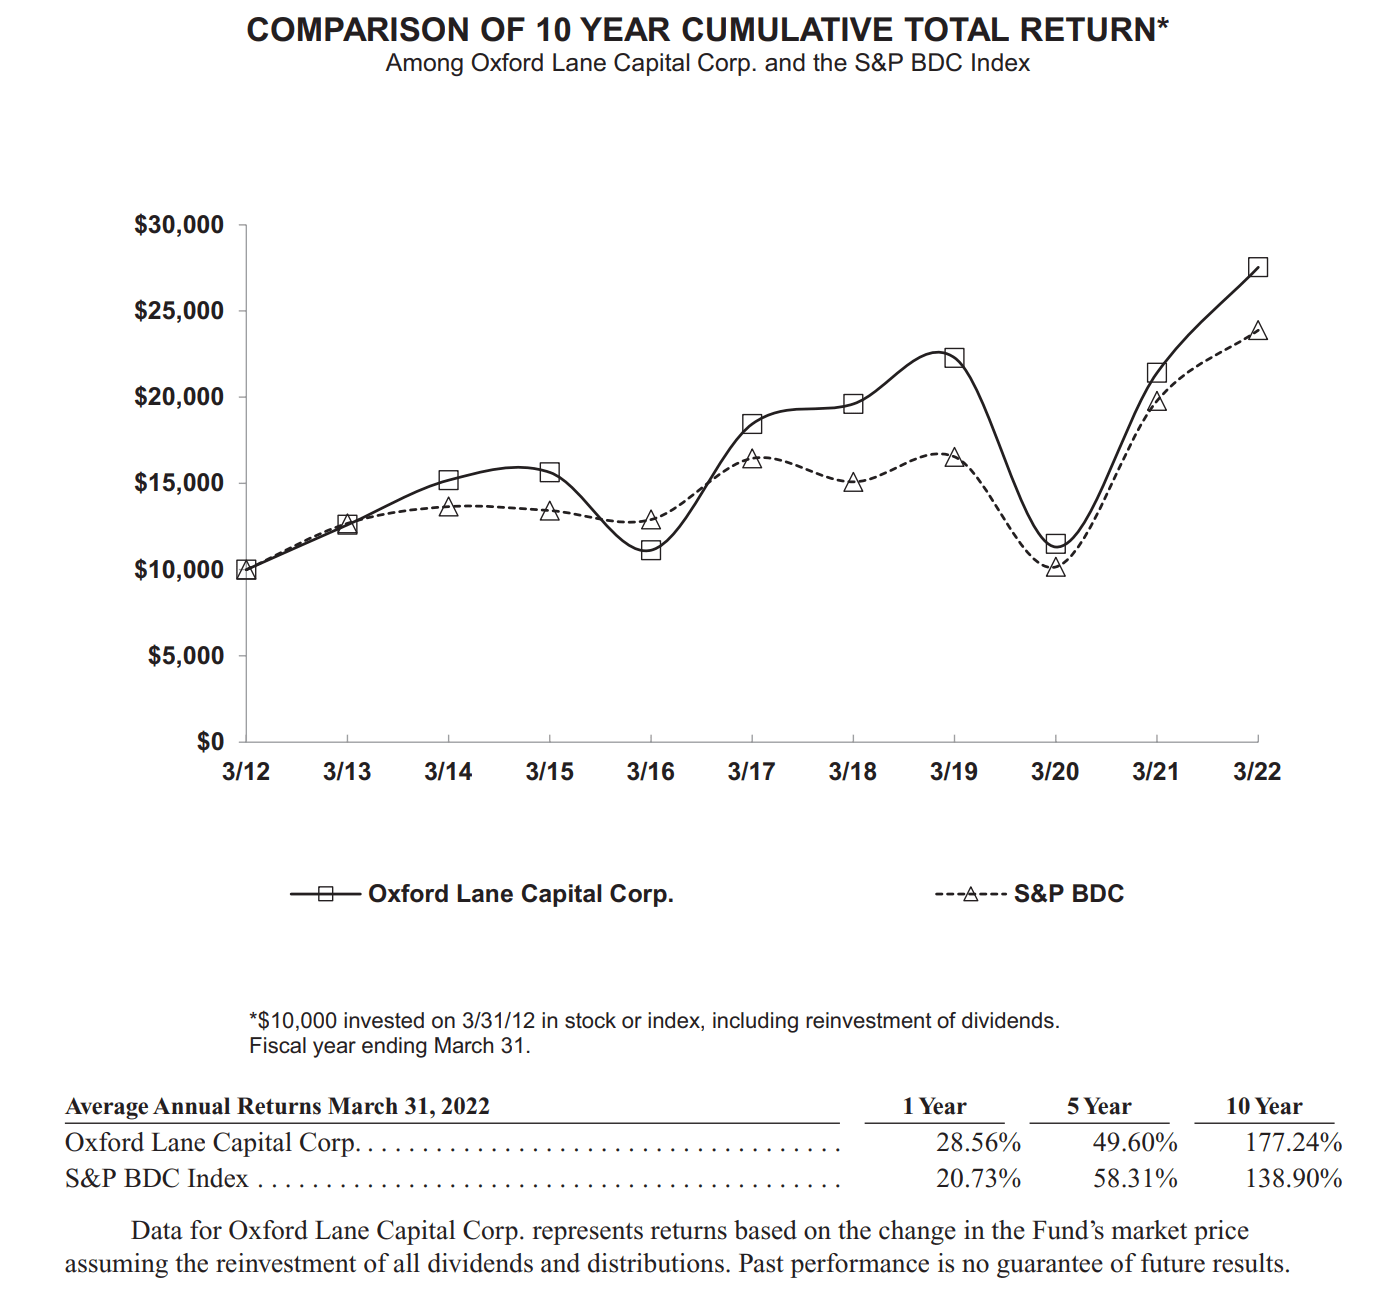
Figure 9 shows return figures as calculated by Morningstar. Impressively, an initial investment in Oxford Lane would have grown to $30,158, or ~11% compounded annual returns. From the individual yearly returns on NAV, we can see performance can be quite lumpy, with some massive years like 2012, 2016, and 2021, and some poor performing years like 2015 and 2018.
Figure 9 – OXLC returns vs. peers (Morningstar)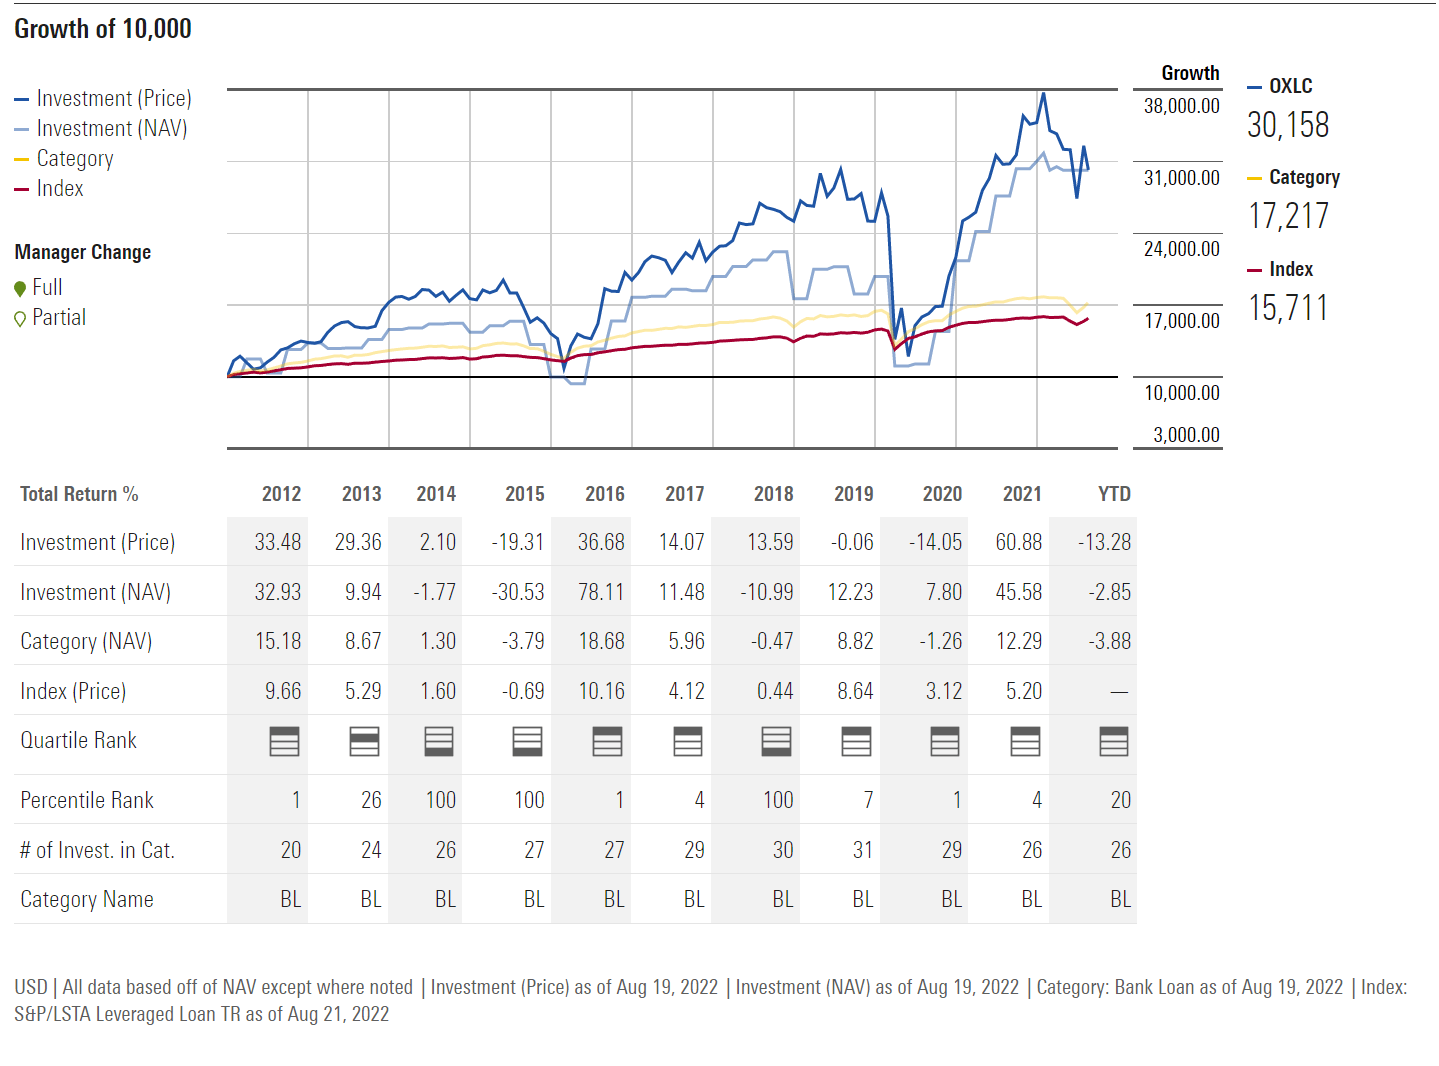
Distribution and Yield
Oxford Lane pays a very high current distribution yield. Currently, distributions are set at $0.075/month or almost 15.0% annualized. From the Q1/F23 report, we see that the Fund has generated Core Net Investment Income (“NII”) of $82 million in the quarter or $0.56/share. So the monthly distribution appears well covered from NII.
Figure 10 – Core NII (Oxford Lane Q1/F23 investor presentation)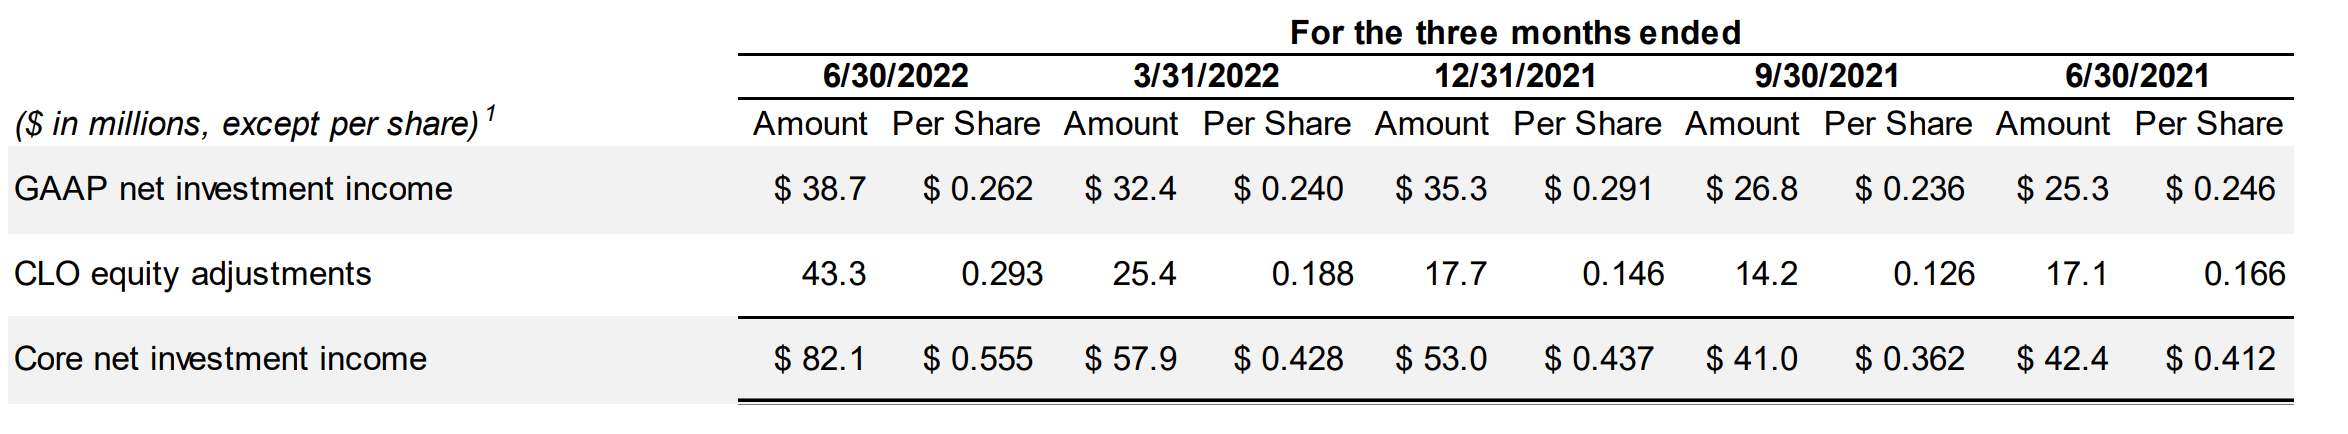
However, if we look historically, Oxford Lane’s distribution is quite variable and has been on a downward trend. In 2021, OXLC paid monthly distributions of $0.0675/share or $0.81 in total. A quarter of 2021’s distribution was designated Return of Capital (“ROC”), and not from income. In 2020, almost all of the distribution of $1.22 came from ROC, and there was a distribution cut from a monthly $0.135/share to $0.0675/share (Figure 11).
Figure 11 – Oxford Lane historical distribution (Author created with data from Oxford Lane website)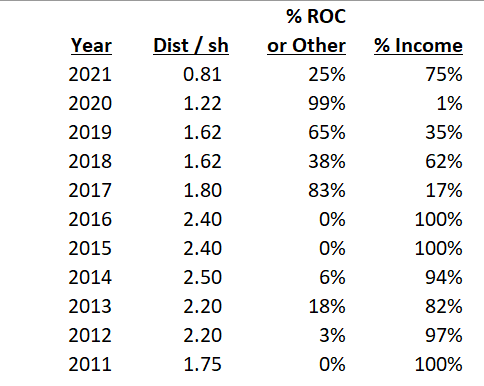
Fees
Oxford Lane is an extremely high cost fund. Figure 12 is excerpted from the 2022 Annual report. For fiscal year 2022, Oxford Lane’s common shareholders paid 10.52% in annual expense, broken down as 2.92% base management fees, 3.12% incentive fees, 2.6% interest on borrowed funds, 1.42% preferred share dividends, and 0.46% other expenses.
Figure 12 – Oxford Lane F2022 fees (Oxford lane F2022 annual report)
Investors should pay particular attention to note 9 explaining the total annual expenses:
“Total annual expenses” is presented as a percentage of net assets attributable to common stockholders, because the holders of shares of our common stock (and not the holders of our preferred stock or debt securities, if any) bear all of our fees and expenses, all of which are included in this fee table presentation. The indirect expenses associated with the Fund’s CLO equity investments are not included in the fee table presentation, but if such expenses were included in the fee table presentation then the Fund’s total annual expenses would have been 30.69%.
Including indirect CLO expenses, total annual expenses were an incredible 30.69% of net assets in Fiscal 2022. Fiscal 2022 was not a one-off either, as Fiscal 2021 total expenses were 9.17% of net assets, and 30.03% including indirect CLO expenses.
Something Doesn’t Add Up With The Math; Don’t Ignore The NAV Decline
While Oxford Lane’s published investment returns are fairly strong (~11% annualized, based on NAV) and it pays a handsome distribution, something about the math just doesn’t add up for me.
Most CEF investors hold their CEFs for the distribution yield. Assume I had invested $100,000 into Oxford Lane at its’ 2011 IPO at $20/share, for 5,000 shares. In 2011, I would have received distributions of $8,750 or 8.7% cash yield. In 2012, the cash distribution would have been $11,000 or 11%, although the NAV fell to $17.41/share at December 31, 2012. The cash yield on initial investment remained fairly strong for a few years (north of 10%), despite NAV steadily decreasing from $18.60 at IPO (due to $1.40 in issuance costs) to $6.81 on December 31, 2019. Investors who simply looked at the monthly distribution might say ‘I don’t care about the volatility, as long as I get my distribution’.
However, disaster struck in 2020 when the distribution was severely cut to $0.675/month. Now, in 2022, at the current distribution of $0.075/month, my annual cash distribution on initial capital is only 4.5%. At a recent trading price of $6/share, my ‘capital’ has also shrunk by 70%, to $30,000. So although the ‘current’ cash yield is north of 14% and OXLC has delivered compounded ~11% annual returns according to literature, as a long-term shareholder of OXLC, I would have only received a cumulative $21/share in distributions plus $6/share in NAV, or a ~2.5% compounded return, assuming the distributions were not reinvested in shares.
Look At Management’s Incentive Structure
Prospective investors are highly encouraged to read through Oxford Lane’s annual reports and see how management is incentivized.
First, a comment about the base management fee. Oxford Lane calculates its base management fee based on gross assets, including those acquired using debt. This is different from the norm, where net assets are usually used to calculate management fees. This gives management an incentive to use debt and preferred shares to add ‘leverage’, as they will earn them more fees.
The focus on gross assets also incentivizes management to continuously grow the assets under management by issuing more shares. In 2011, the Fund IPO’d by issuing 1.825 million shares at $20/share. In the most recent quarter, Oxford Lane issued 4.6 million shares for net proceeds of $30.9 million. As of June 30, 2022, Oxford Lane has 149.9 million shares outstanding, more than 80x the initial IPO share count.
Also, if we look at the management incentive fee, Oxford Lane management earns 20% of net investment income above a quarterly 1.75% rate (annualized 7.0%). Note this structure might incentivize management to reach for yield to maximize NII (and incentive fees) at the expense of credit quality.
In the past 10 years, generally characterized as one of the longest expansions in history with the exception of the COVID-19 pandemic, Oxford Lane experienced cumulative $3.14/share in realized and unrealized losses (Figure 13). This poor result is especially troubling as the F2020 loss figure of $5.39 is 65% of F2019 NAV of $8.32!
Furthermore, the ‘bounceback’ in F2021 of $2.26/share was small relative to the drawdowns of $5.39/share in F2020, as the number of shares shot up from 42.5 million at the end of F2019 to 100.4 million at the end of F2021, i.e., Oxford Lane kept issuing shares in F2020 and F2021 to maintain AUM, so any credit recovery was diluted.
Figure 13 – 10 year financial highlight (Oxford Lane F2022 annual report)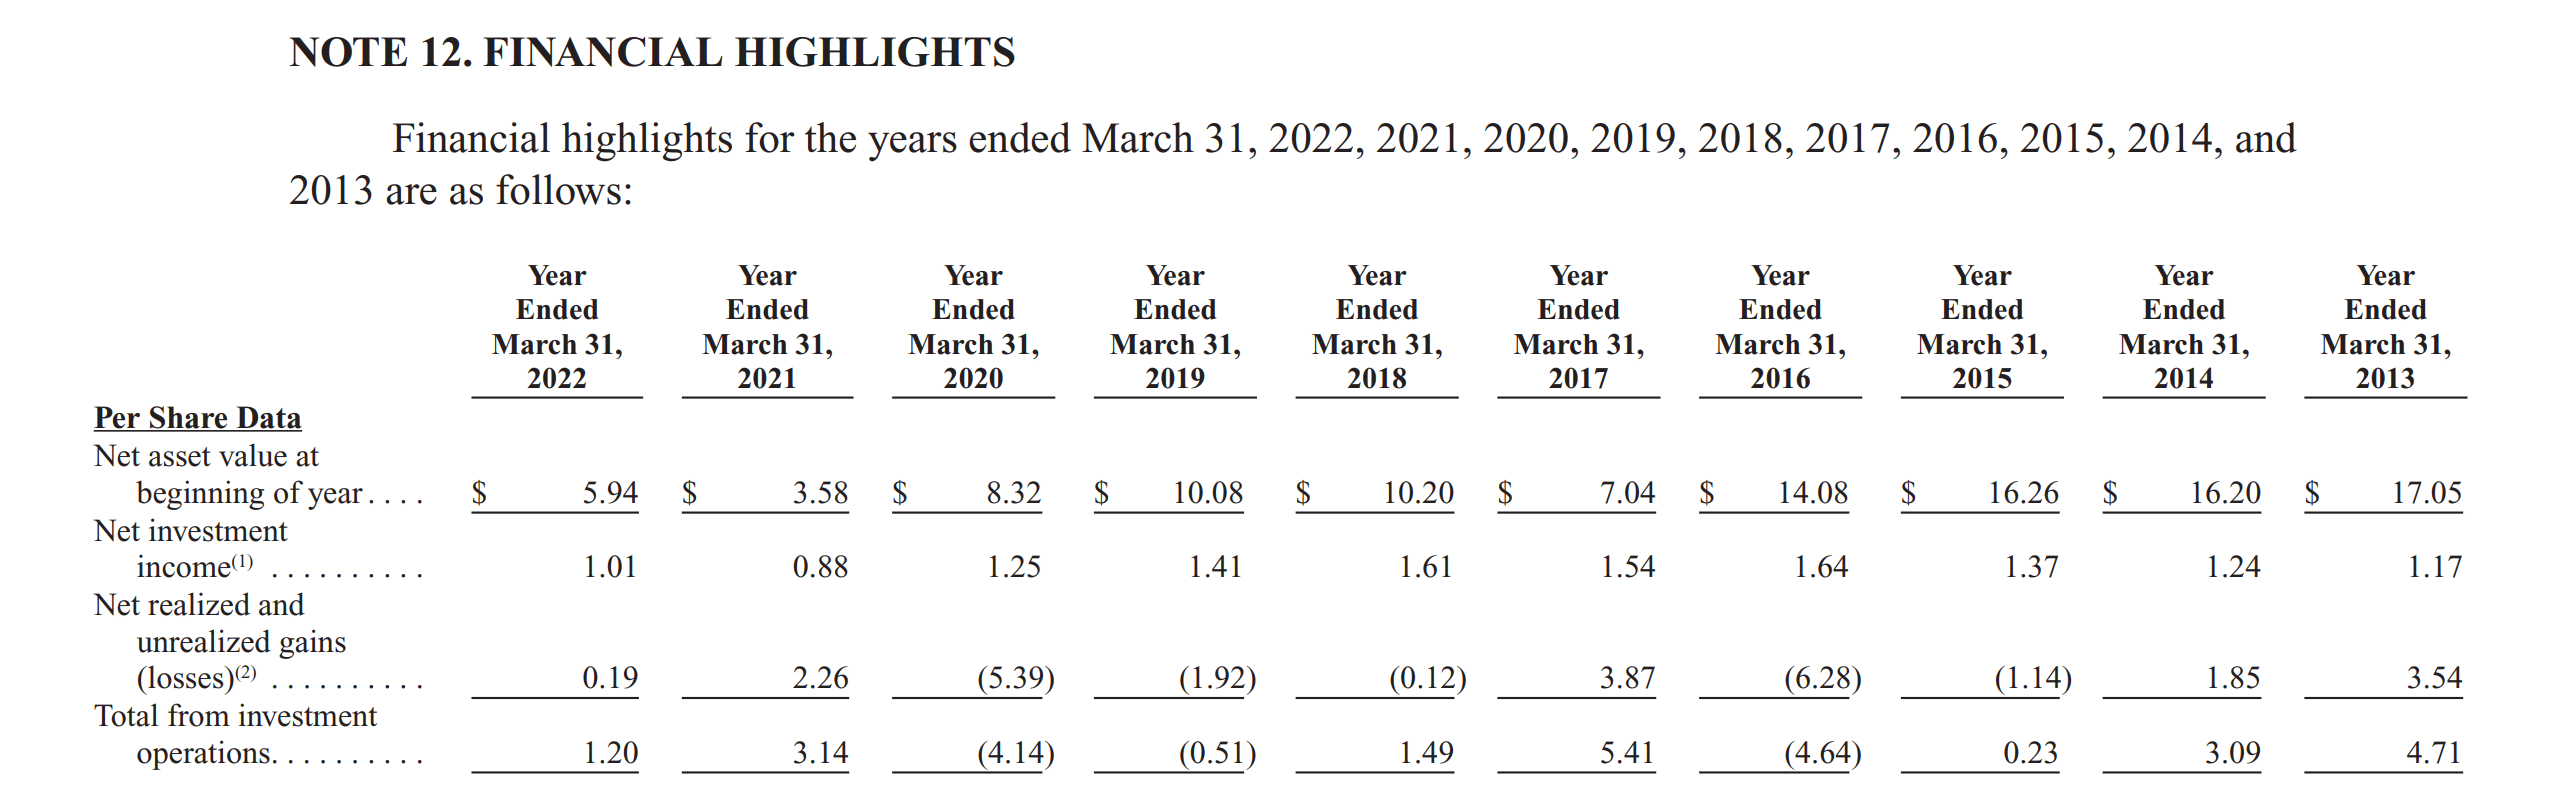
Risk
The biggest risk for Oxford Lane is a deterioration in the general economy. As Oxford Lane’s portfolio holdings are predominantly equity tranches of CLOs, they are very sensitive to the economy and credit quality. While an increase in credit spreads may have minimal effect on the highly rated tranches of CLO debt (as the underlying loans continue to perform and the tranches are overcollateralized), it can have a disproportionate effect on equity tranches which are the first loss tranche. Recall from Figure 6 above, the cash yield on CLO equity is almost 30%. This level of cash yield is historically very high, implying we could see a very high rate of default.
When Would I Buy?
In my opinion, rather than buy and hold, Oxford Lane is most suitable as a credit recovery play. Invest in Oxford Lane when high yield credit spreads have blown out to unsustainable levels, but sell once spread normalizes (as OXLC has historically not been a good long-term investment). In 2016, the BofA HY spread widened to 8.5% and marked a good entry into Oxford Lane to play for a credit recovery. Similar, in March 2020, BofA HY spreads widened to 10%, which was also a great credit recovery entry. At current HY spreads of 4.5%, I’m not sure if there’s enough margin of safety for a credit recovery play (Figure 14)
Figure 14 – Oxford Lane as Credit Recovery Play (Author created with price chart from stockcharts.com)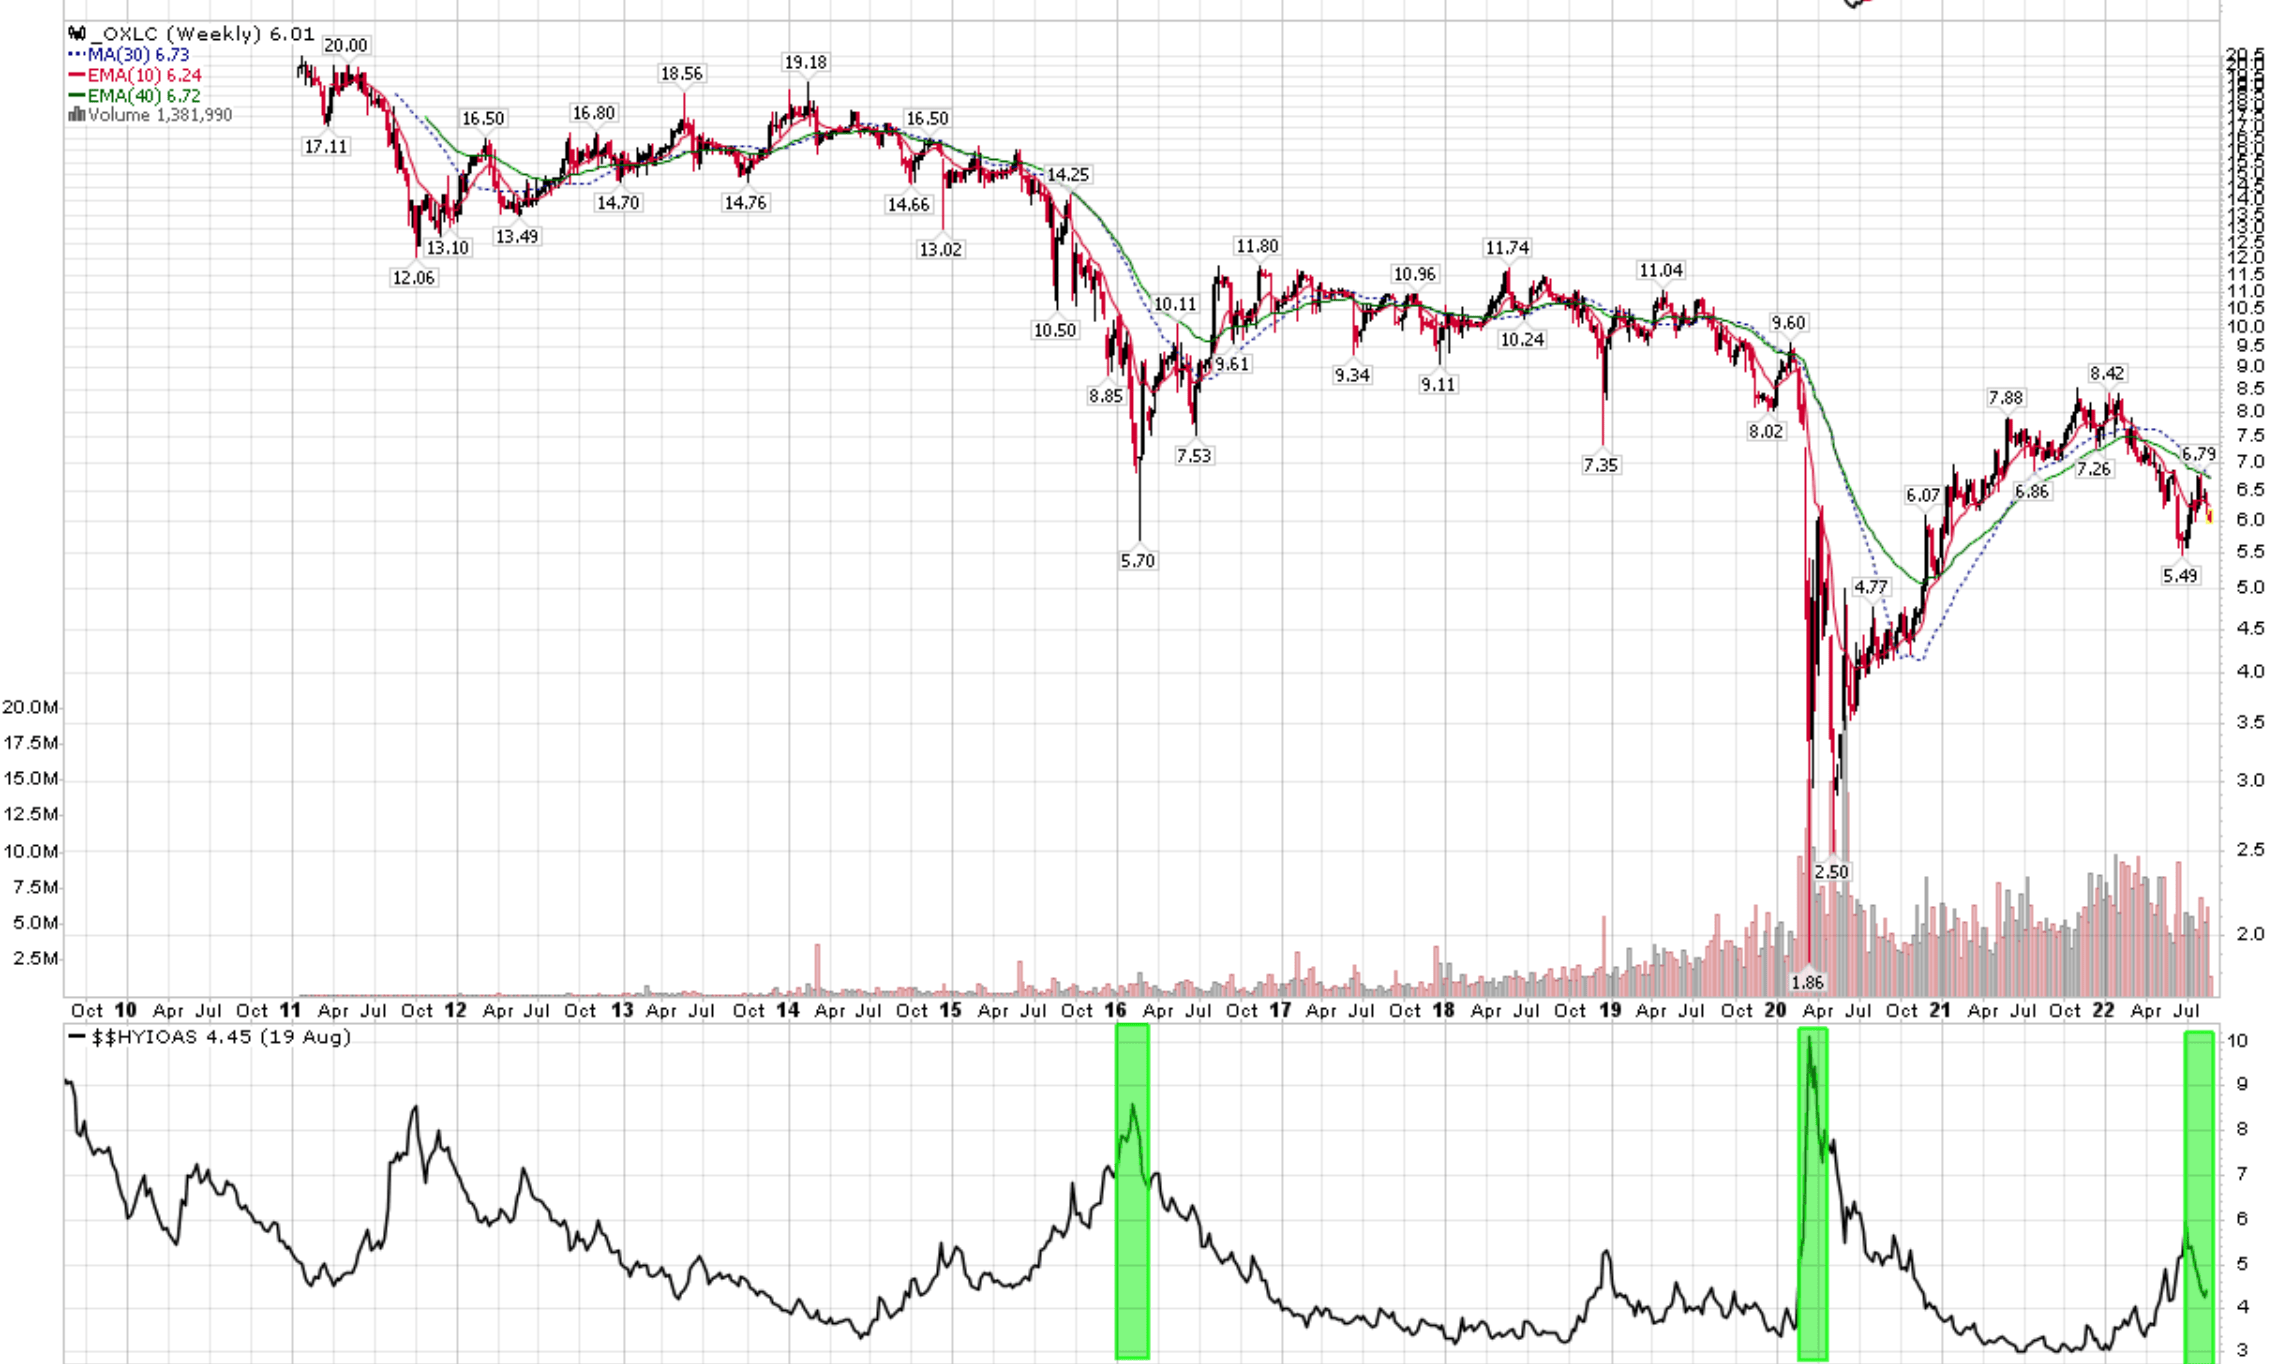
Conclusion
In summary, while Oxford Lane’s near 15% current distribution yield looks attractive at first glance, I would personally stay away from the Fund. First, the constant decline in NAV is troubling. As shown by my numeric example above, declines in CEF NAV doesn’t matter until all of a sudden it matters, and investors are then left with a capital haircut and a reduction in distributions. Secondly, the total expenses of the fund, at 10.5% in Fiscal 2022, is far too high. This implies management’s incentive structure is not properly aligned with investors, in my opinion. Finally, with the Federal Reserve still in the early innings of its tightening cycle, I think there is room for general credit to deteriorate and hence OXLC’s NAV to fall further. I would consider OXLC as a credit recovery play if high yield spreads were to widen beyond 8%.
Be the first to comment