

everythingpossible
Investment summary
Factors of quality and resiliency are standouts within the current and forward looking investment landscape. If playing the healthcare sector, investors should be looking to shift up in the quality matrix and look for selective opportunities within the space, as they are abundantly spread.
Despite this, Owens & Minor, Inc. (NYSE:OMI) exhibits several favorable equity characteristics that investors are paying for in FY22, namely, high return on capital and a growing bottom line. However, valuations are unsupportive of the investment debate and closer inspection of the balance sheet indicates goodwill takes up a good portion of shareholder equity value. With these points in mind, we rate OMI neutral at $25.45.
Exhibit 1. OMI 6-month price action
Data: Refinitiv Eikon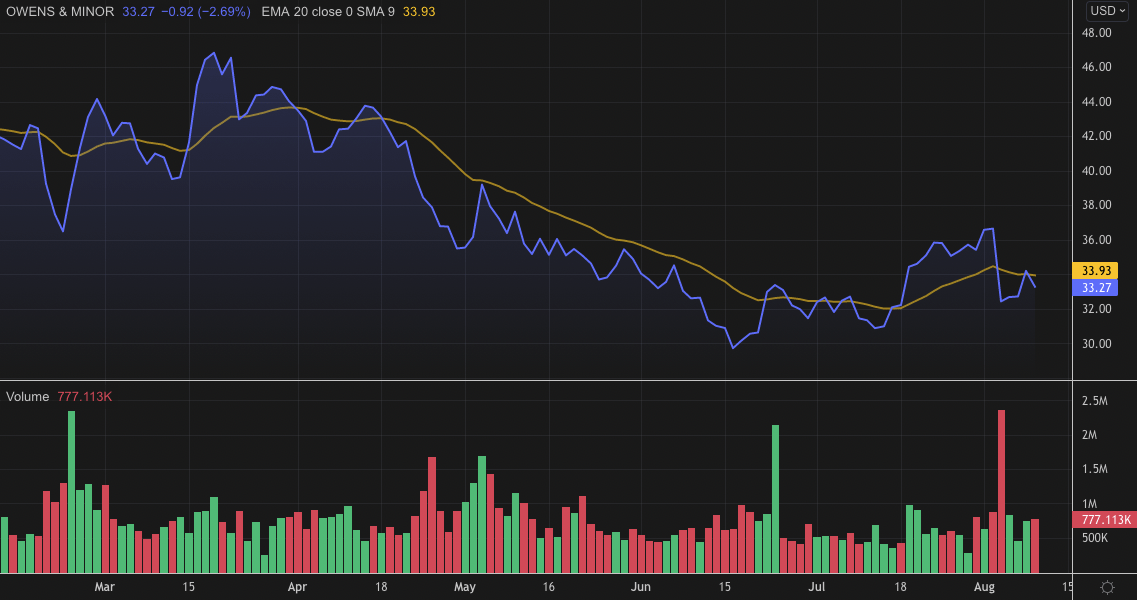
Q2 earnings: behind internal and external expectations
Turnover for Q2 came in at $2.5 billion and marginally ahead of the same period last year. Meanwhile, it recognized gross profit of $533 million on a margin of 21.3%, up 520bps YoY. Growth at the top was underscored by incremental acquisition revenue. In particular, it booked first quarterly revenues from the Apria transaction. Apria is a higher margin segment being in sleep apnea, and it grew single-digits YoY, whereas Patient Direct pro forma revenue increased by 10% YoY. Meanwhile, the Byram business contributed a 17% YoY growth schedule.
Distribution and SG&A expenditure came in at $453 million on the back of higher variable costs tied to Apria. In total, distribution and SG&A expenses increased 54% YoY. Whereas OMI also realized a $36 million interest expense – up by an entire $24 million YoY, secondary to financing obtained to fund the Apria transaction. To manage the company’s sensitivity to interest rate delta and shorten the Macaulay duration of its debt, the company entered into an interest rate swap to size up the percentage of its fixed rate credit exposure to ~66% of total borrowings. This will provide further certainty over the predictability of those cash out flows.
Moving down the P&L, operating income was down 22% YoY to $75 million, predominantly due to the substantial jump in Distribution, SG&A. However, operating income is behind FY21’s result for the 6 months ending June 30 2022 as well. It brought this down to net income of $29 million, or $0.37 per share and comprehensive income of $12.83 million. The company mentioned that unfavorable USD cross forex rates have had “an unfavorable impact on foreign currency translation, reducing adjusted EPS in the second quarter by $0.05, and an $0.08 reduction on a year-to-date basis.” Nevertheless, we are agnostic to adjusting earnings into “constant currency” terms – shareholder dividends aren’t paid in these terms, so why should earnings be registered in the same way? [Noteworthy is that companies rarely report their profits/upside in constant currency terms either – only to the downside]. We encourage investors to consider the same kind of thinking.
Segmentally, products and healthcare services came in behind Q2 FY21 with a $1.93 billion result. Revenue volumes were expected to slip however, as Covid-19 tailwinds start to fully diminish. Operating income for the segment came in narrower by ~39% for the year, driven by much lower revenue volumes as above. Meanwhile, turnover from the patient direct segment outshone and grew 145% YoY to $573 million.
As seen in Exhibit 2, quarterly operating metrics continue to hold the fort and have been resilient over the course of the pandemic–date, and all that’s brought along with it. As investors look to shift up the quality spectrum resiliency is a key factor to consider in portfolio construction. FCF conversion has normalized to ~45% from operating income these past 2 years, and was 42.4% in Q2.
Exhibit 2. Operating performance offers a layer of resiliency for investor portfolios in FY22
Data: HB Insights, OMI SEC Filings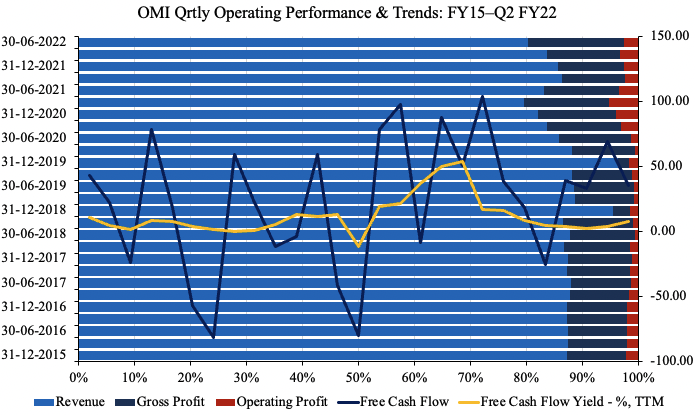
Meanwhile, profitability and working capital management are also features to be considered bullish in the investment debate. Quarterly NOPAT conversion averages $70 million since FY18 whereas normalized ROIC is 3.2% – 12.7% annualized. This is well above the company’s cost of capital of 5.8%, more than double in fact. As such, the ROIC/WACC ratio is ~2.2x. In the search for long-term cash compounding machines, these features (and those mentioned from Exhibit 2) are desirable in the current and forward looking climate. As a demonstration of this, whilst interest expense increased YoY, the company paid down $67 million in long-term liabilities whilst completing a $108 million acquisition payment.
Exhibit 3.
Data: HB Insights, OMI SEC Filings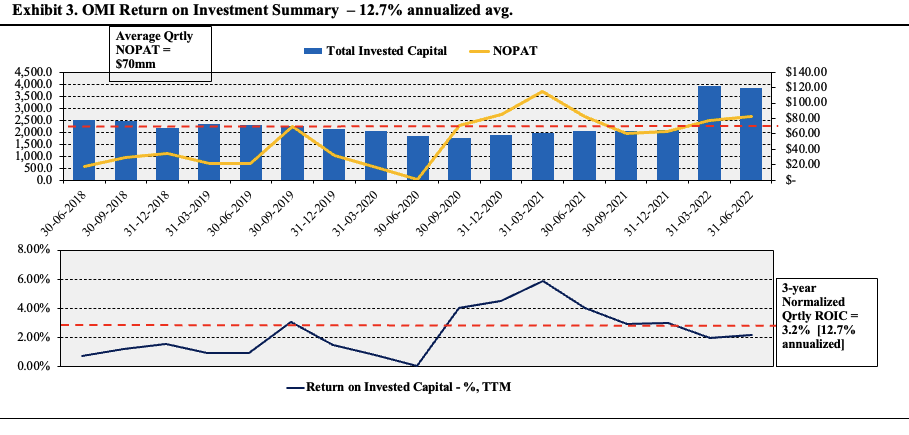
Guidance to fall behind expectations
Despite various other names within the sector bumping forward earnings, OMI downgraded its FY22 full-year guidance. It now expects top-line growth of ~3.2%, calling for net revenue of $9.8–$10.1 billion. Gross margin on this is forecast at 20% [unchanged]. It projects to pull this down to adjusted EBITDA of $570–$610 million with non-GAAP EPS of $3.15 at the upper end. Meanwhile, interest expense is suspected to rise to $130–$135 million. The revision downward was prompted by macroeconomic pressures and industry-specific headwinds, management said on the earnings call.
Per CFO Andy Long:
“Higher interest rates and the stronger U.S. dollar alone are contributing approximately $0.10 of the reduction in the midpoint of our guidance. Both the short and long-term expectations for Apria remain right on track. And we continue to expect Apria to add over $900 million of revenue and approximately $180 million of adjusted EBITDA for the partial year impact in 2022.
We remain confident in our synergy expectations related to Apria and believe incremental annual revenue will be in the range of $80 million to a $100 million and incremental annual adjusted EBITDA in the range of $40 million to $50 million within the next few years.”
Valuation
Shares are trading at ~11x trailing P/E and are priced at a discount to GICS Industry peers at 8.4x forward P/E. At a 42% discount, the market has priced OMI to deliver a below-sector result in FY23. It also trades at 2.7x book value and less than 0.3x sales, and therefore trades at a deep discount to peers across all multiples used in the analysis.
Exhibit 4. Multiples and comps
Data: HB Insights 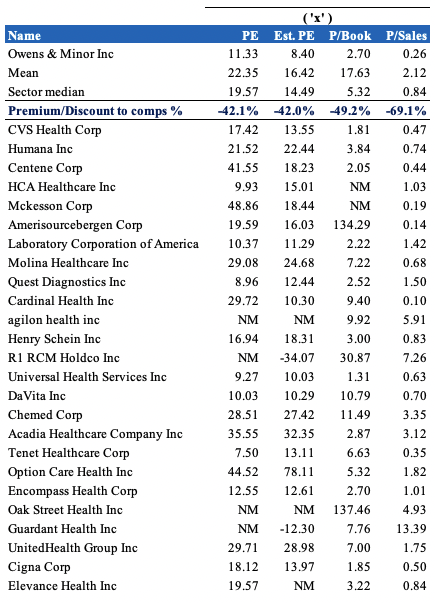
Meanwhile, extrapolating tangible book value from the company’s equity value reveals there’s a lack of tangible value to be realized by shareholders at this level. Goodwill and intangibles make up more than 38% of total assets combined, and more than 221% of OMI’s total book value of equity, as seen in Exhibit 5. Investors should keep this in mind when trying to gauge the value thesis for OMI. At 8.4x FY23 EPS estimates this prices OMI at $25.45 and therefore offers a lack of upside capture in valuation.
Exhibit 5. Goodwill continues to make up a large portion of equity value on the balance sheet
Data: HB Insights, OMI 10-Q Q2 FY22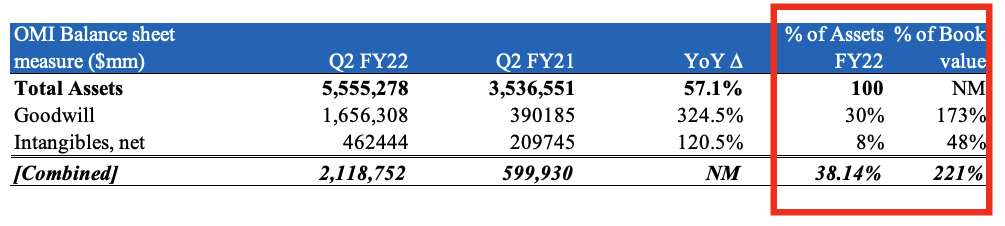
In short
Whilst OMI continues to expand its bottom-line fundamentals the stock price relative to valuation has us trigger shy on the name. Whilst there’s a number of fundamental drivers on display, there are also a number of impeding headwinds on the horizon, and OMI has reduced its FY22 guidance accordingly, unlike numerous other names within the sector, who have raised guidance.
With the culmination of factors presented in this report, we rate OMI neutral on a valuation of $25.45.
Be the first to comment