

Donald34/iStock via Getty Images
Introduction
The S&P 500 has been experiencing increased volatility since the beginning of 2022 and has recently entered a bear market. Many analysts believe that investors shifted their holdings to defensive sectors as the Fed started tightening and inflation remained at historically high levels. Sector rotation is one of the strategies attempting to classify for each business cycle a set of sectors that empirically proved to be stronger than the others.
Last April, our Tactical Sector Rotation Strategy shifted from the recovery phase to the rebound phase in the business cycle. In this article, we will analyze the characteristics of this current phase and evaluate this strategy’s performance during inflationary periods. In addition, we will try to assess the outlook for the next economic business cycle.
The investment strategy is a rule-based strategy that has generated above-average annual returns over the years. For more information, you can check our previously published articles: “This Sector Rotation Strategy Made 17% Each Year Since 1991” and “This Sector Rotation Strategy Has Delivered Each Year Since 1991 (Part 2)“, where we explain what factors contribute to the determination of the business cycle and which sectors correspond to each phase.
Tactical Sector Rotation Performance
Supported by the thesis that some sectors are prone to outperform the market during specific business phases and that the sectors’ performance can be predicted based on the economy’s business cycle, we were able to build this model and backtest its performance. As shown below, since 1991, this strategy has outperformed the market and efficiently determined the change in the economy’s business cycle.
Factor-Based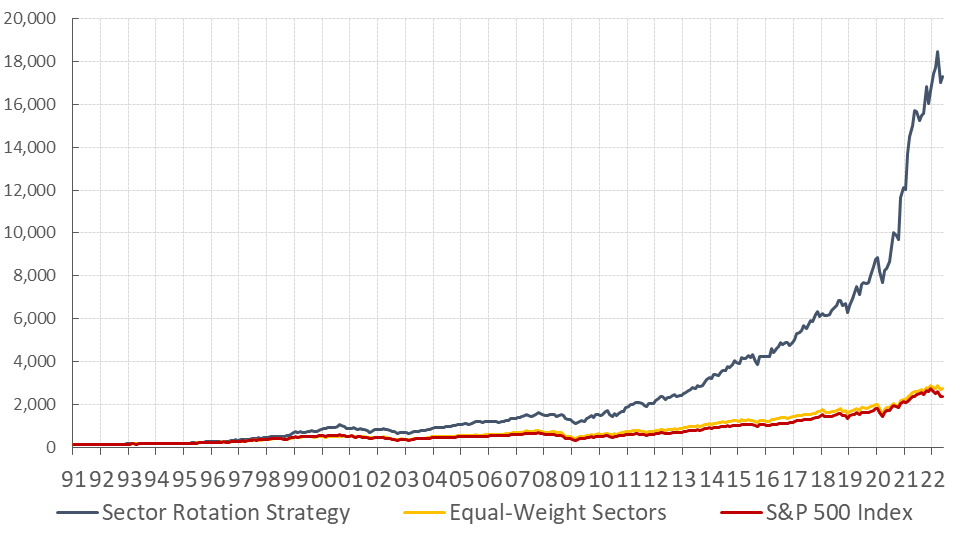
The performance was remarkable compared to the S&P 500 Total Return Index or an equally weighted portfolio investing in the ten GICs Level 1 sectors. In only four out of the 31 years did the strategy underperform. Interestingly, the alpha became larger over the last four years.
Factor-Based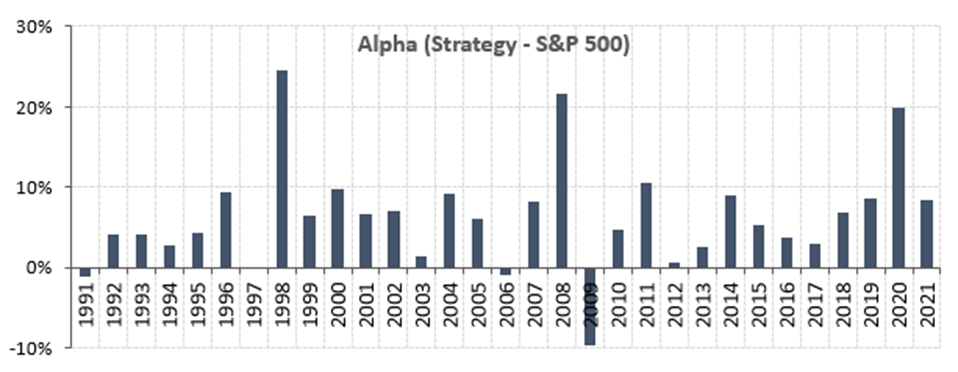
This strategy worked well under a low inflation environment as the period since 1991 did not show extremely high inflation years similar to the current situation. But as inflation is a significant concern, an intuitive question arises: How does this strategy perform during an inflationary business environment? And is it expected to outperform?
Tactical Sector Rotation During Inflation
We further backtested this strategy by checking its performance between 1965 and 1991 to include periods of extremely high inflation.
We calculated the average monthly year-over-year change in the inflation rate during this period and found that it was relatively high (above 5.00%) 13 times. To assess the strategy’s efficiency during inflationary periods, we examined its performance and excess returns compared to the market (S&P total return) and an equally weighted portfolio for these years.
The simulation was done based on two scenarios. One of the scenarios used the same sector allocation as the current strategy. In the other, we tweaked the sector allocation a bit to check the best sector combination. We used the same process in both cases to identify business cycle shifts.
Scenario 1: Using Same Sector Allocation
The table below shows that the portfolio would have outperformed in seven out of the 13 years with high inflation by applying the same strategy.
Factor-Based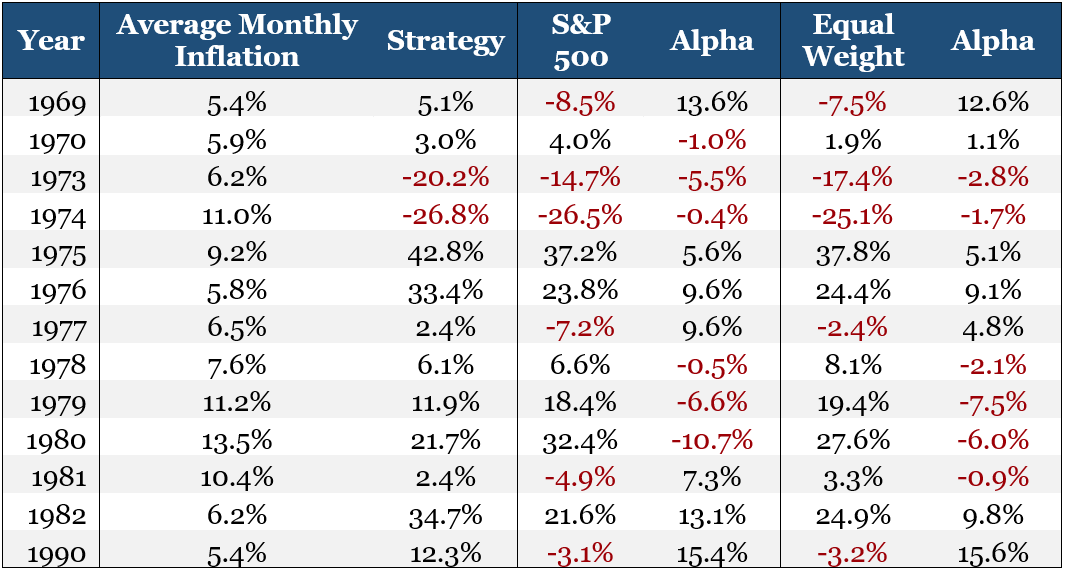
Scenario 2: Tweaking the Sector Allocation
We tweaked the sector allocation to have a better result. We made the below sector allocation for each phase:
- Decline: Energy and Materials
- Recovery: Consumer Discretionary
- Early: Financials
- Late: Energy and Staples
- Rebound: Telecom and Info Tech
We summarized the data for these 13 occurrences:
Factor-Based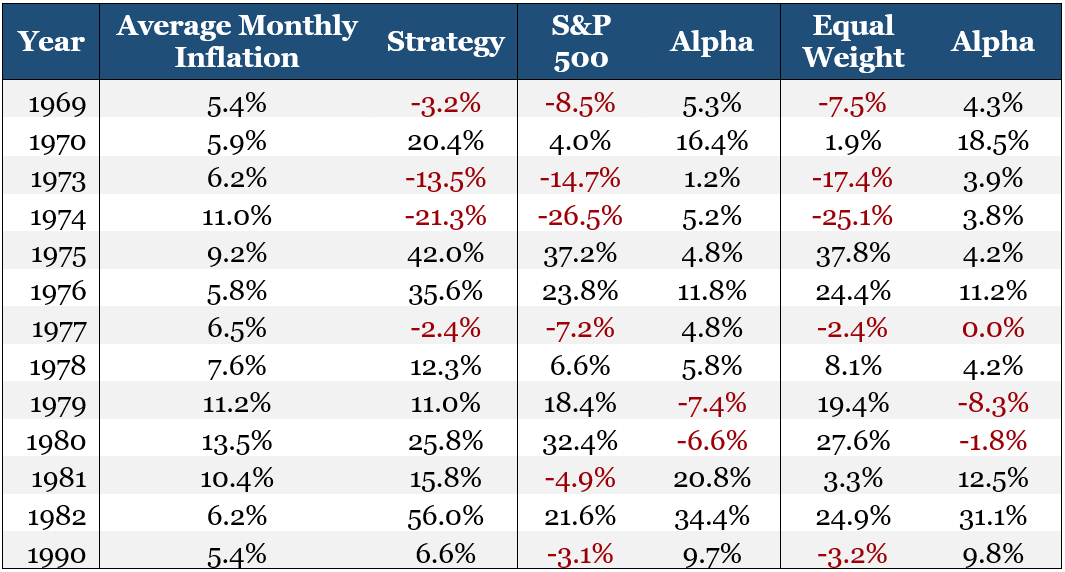
Evidence suggests that during inflationary periods, tweaking the sector allocation to fit this business environment resulted in outperforming the market in 11 out of 13 years. It also outperformed an equally weighted portfolio combining all the sectors ten times.
As mentioned earlier, the signals based on which the strategy is built (LEI Y/Y change and the Federal funds rate evolution, among others) could effectively identify the appropriate cycle. Therefore, we shifted the portfolio’s allocation towards the best sectors at the right time.
Factor-Based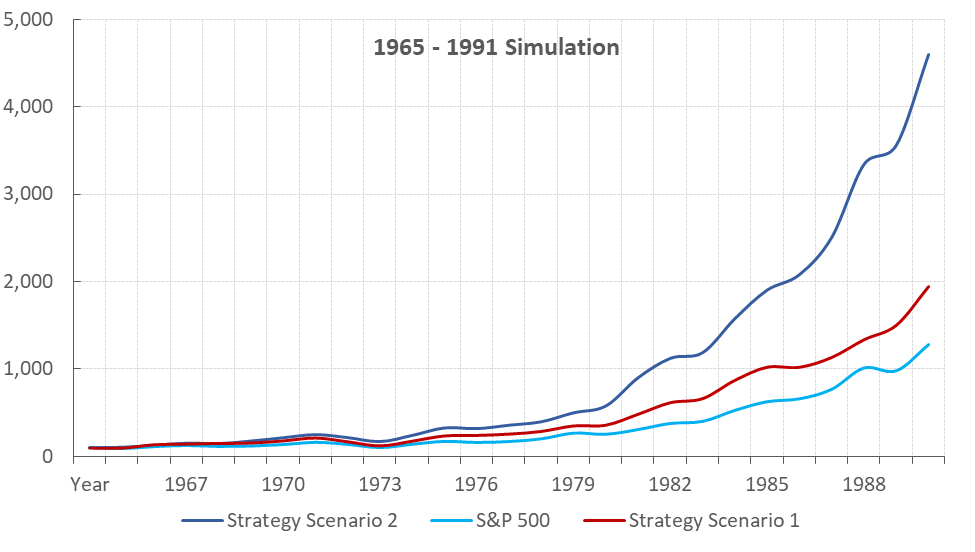
This Business Cycle Has Seen Four Phases
Since the pandemic’s start, our investment model has identified four different business cycles. According to the strategy, various sectors were recommended. The portfolio outperformed the market, as shown in the chart below.
Factor-Based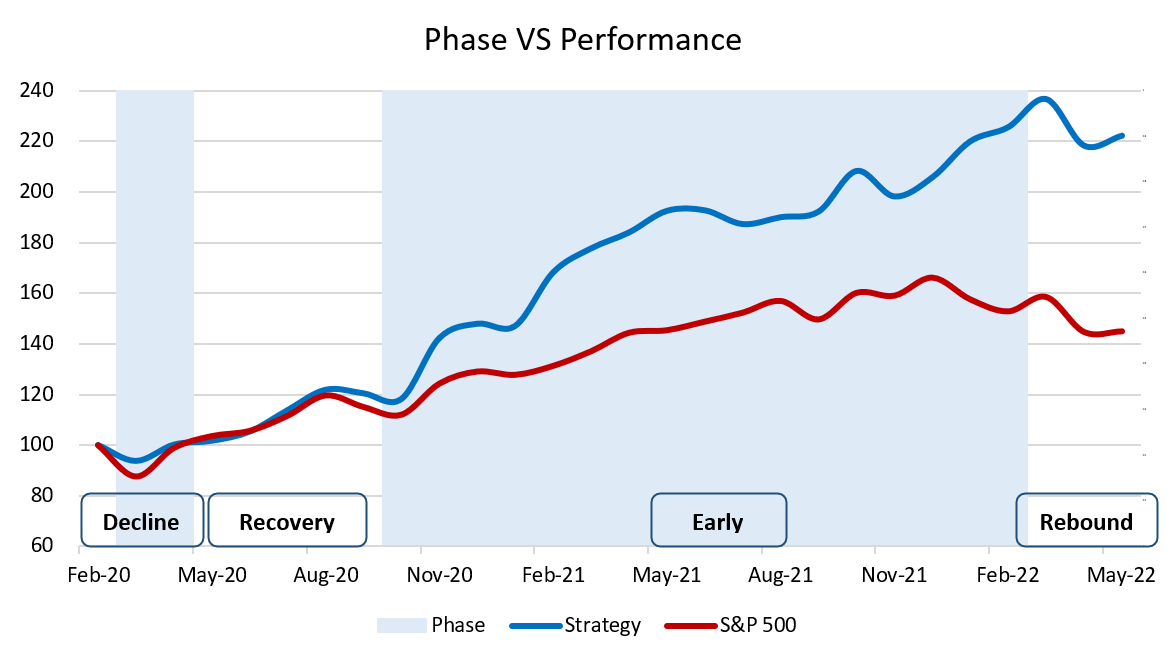
The most recent cycle shift was identified last March when the model suggested that the economy was heading towards the rebound phase, characterized by a decreasing LEI Y/Y change and an increasing Fed rate. During this phase, two sectors were expected to outperform: Info Tech and Utilities. As shown below, this call has outperformed the market.
Factor-Based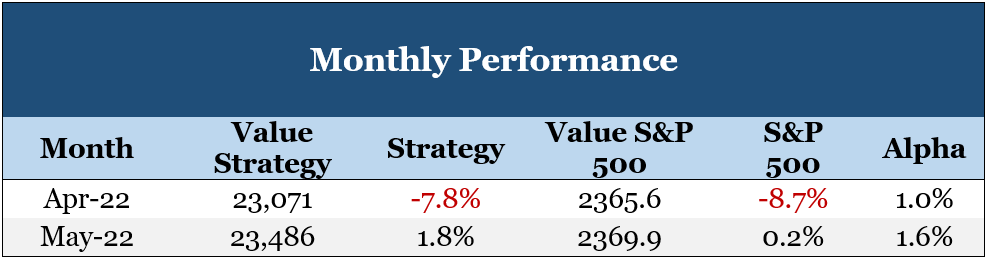
Historical Performance in a Similar Phase
To further assess whether an investor can earn excess adjusted returns during periods of high inflation, combined with an increasing rate environment and a decreasing LEI, we will check the performance of the strategy during the period 2004-2006.
Factor-Based
Following the dot-com bubble, the economy was in an early phase when LEI reached a relatively high level beyond 7%. The strategy identified a shift in the business cycle to the rebound phase (similar to the current classification), and inflation was higher than average (above 4%). Additionally, the Fed was increasing rates from 1.00% to 5.25%, and the LEI Y/Y change dropped from a peak of 11.4% to -1.5% by the end of this phase.
In 2005, where the first four months were classified as the early phase and the remaining months were classified as the rebound phase, the strategy’s return was 12.6% compared to 4.9% for the S&P 500. Thus, the excess adjusted return was nearly 7.7%. As such, it is expected that the strategy will continue outperforming the market this year.
Still Positive Despite The Bear Market
Since the beginning of 2022, the strategy has outperformed each month, as shown in the table below.
Factor-Based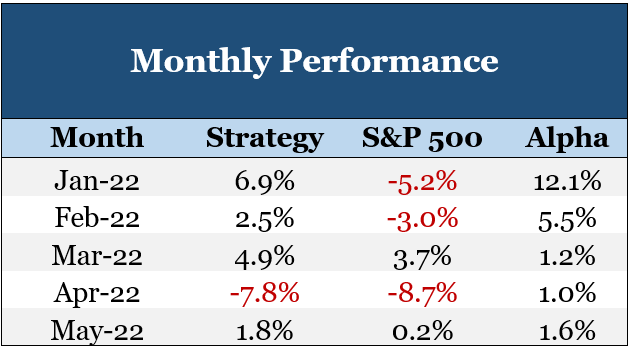
YTD, after accounting for the variations in the weights inside the portfolio and the rebalancing, the strategy’s cumulative return is 8.0% compared to -12.8% for the S&P 500, creating an alpha return of almost 20.8%!
2022, A Year With Three Phases?
For the remainder of this year, the rebound phase might not remain for a long time. A probable shift to the Late phase or Decline phase might occur based on the changes in the model’s two main drivers:
- Either the Fed stops its tightening monetary policy and limits its rate hikes;
- Or the LEI Y/Y change drops sharply below our -3% threshold.
Given the market conditions, the second scenario is more likely to occur. But, until now, the pace of the LEI drop has not been clear whether it will reach our -3% threshold this year or in early 2023.
Still, there is a probability that the first scenario might occur in case the Fed is able to somehow curb inflation in the short-term and wants to sustain economic growth with a dovish monetary policy.
Final Thoughts
Despite the dramatic sell-off experienced in the last few months, our Tactical Sector Rotation Strategy outperformed the market and delivered excess returns to investors. This year, the strategy identified a shift in the business cycle, and given the current market circumstances, another shift might occur before the end of the year.
We backtested the strategy’s assumptions and the sectors’ performance since 1960. The goal was to assess whether the strategy is efficient during a high inflationary business environment. Our findings suggest that the strategy appropriately identified the shift in the business cycle and outperformed its benchmark using the same sector allocation. If the sectors were tweaked to fit an inflationary business environment, the strategy would outperform during 11 out of 13 years where inflation was above 5.00%. Additionally, the strategy outperformed during a similar phase in 2005 when the LEI and rates were experiencing similar trends.
Finally, shifting a portfolio’s allocation during uncertain and volatile periods is challenging. Therefore, investors may benefit from our backtested model to have a forward-looking approach to the next business cycle and decide on the best reallocation of sectors within their portfolio.
Be the first to comment