

Michael M. Santiago
Author’s note: This article was released to CEF/ETF Income Laboratory members on December 28th.
The O’Shares U.S. Quality Dividend ETF (BATS:OUSA) is a multi-factor U.S. equity index ETF. OUSA invests in companies with strong fundamentals, considering quality, dividend, and volatility metrics. OUSA has outperformed YTD, and should continue to outperform as long as investors continue to shift from growth / tech to value.
OUSA is also a somewhat complicated fund, with a complex index with many moving parts, which makes it a difficult fund to analyze. Several of its peers have broadly similar characteristics while being simpler, including the ProShares S&P 500 Dividend Aristocrats ETF (NOBL). I think simpler is best, so would choose NOBL over OUSA, but both funds remain reasonable investment opportunities.
OUSA – Basics
- Investment Manager: Alps
- Underlying Index: O’Shares U.S. Quality Dividend Index
- Dividend Yield: 1.89%
- Expense Ratio: 0.48%
- Total Returns CAGR 5Y: 8.5%
OUSA – Overview
OUSA is a U.S. equity index ETF, tracking the O’Shares U.S. Quality Dividend Index. It is a relatively complicated multi-factor index, but the fund has summarized the key points in a handy infographic.
OUSA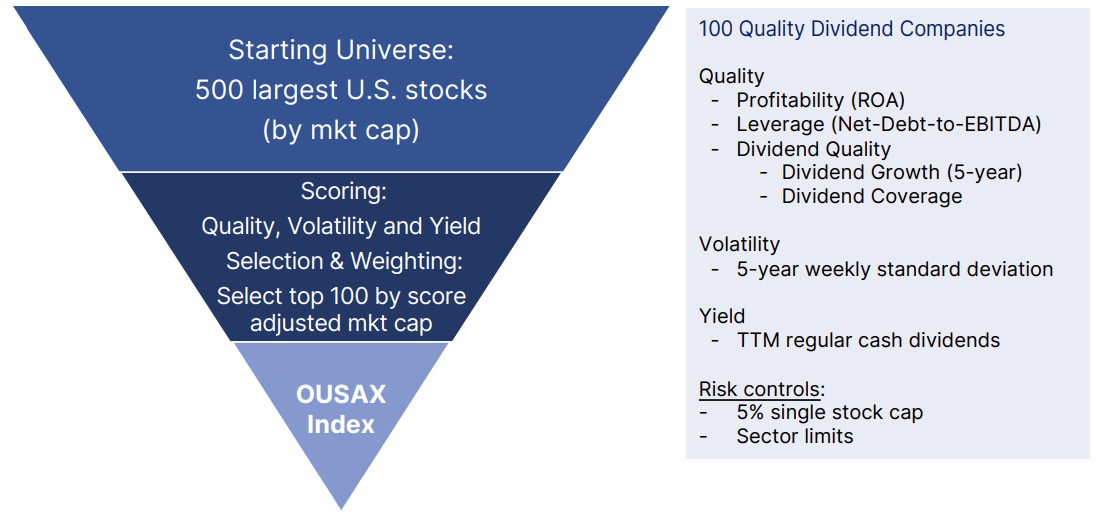
Let’s go through each of the steps above.
The index first selects the 500 largest U.S. equities from the following industries:
O’Shares U.S. Quality Dividend Index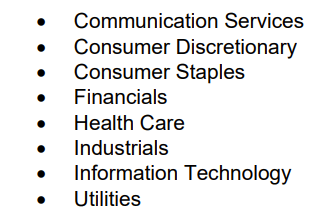
Energy, real estate, and materials stocks are explicitly excluded from the index. The index then ranks said companies based on the following quality, volatility, and dividend metrics:
- Market-cap
- ROA
- Total net debt / EBITDA
- Volatility
- Dividend yield
- Dividend coverage ratio
- Dividend growth
The index then selects the 100 highest-rated companies, based on the metrics above. Weights are based on these same metrics. In case it’s not particularly clear, market-cap itself is a metric, so the fund is tilted towards larger companies. As with most indexes, there are industry and security caps meant to ensure diversification. Index rules, weighting scheme, and other index characteristics are quite complex, although not excessively so.
OUSA’s underlying index does seem to select companies with above-average quality, dividend, and volatility metrics, as expected.
O’Shares U.S. Quality Dividend Index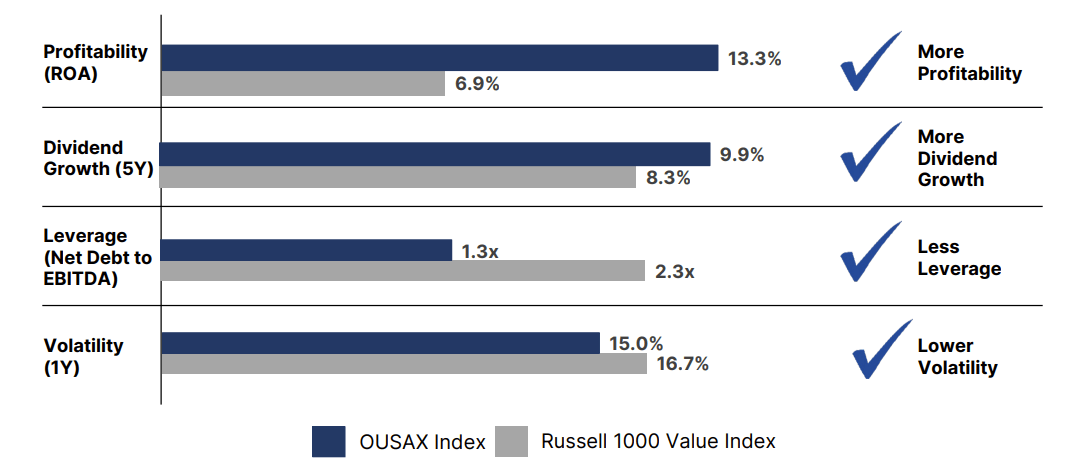
OUSA’s underlying index is quite broad, which results in a reasonably well-diversified fund. OUSA invests in 100 different companies, in-line with most niche equity index funds, but lower than most broad-based equity indexes, including the S&P 500. Largest holdings are as follows.
OUSA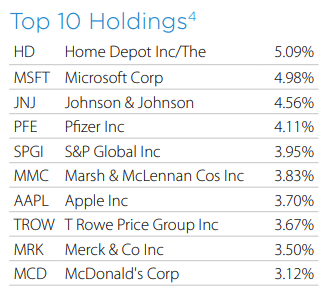
OUSA provides diversified exposure to most relevant industry segments, excluding energy, real estate, and materials. Excluding energy is particularly notable, due to the industry’s idiosyncratic behavior: energy performance sometimes significantly differs from equity market performance. OUSA’s industry exposures are as follows.
OUSA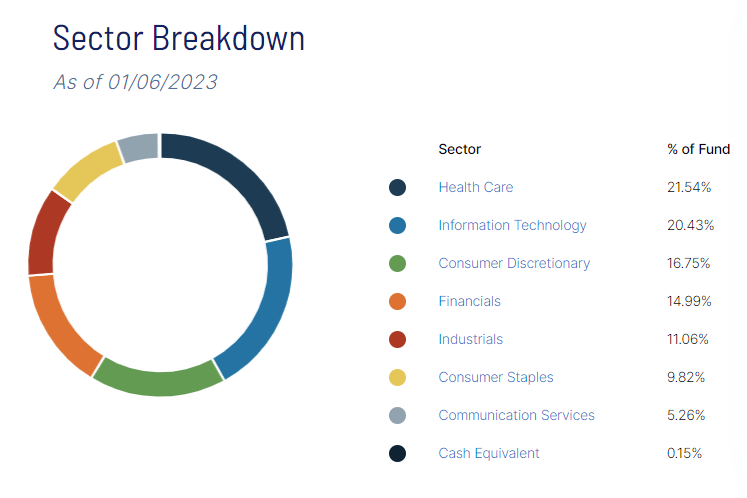
Relative to the S&P 500, OUSA’s industry exposures are, well, all over the place.
OUSA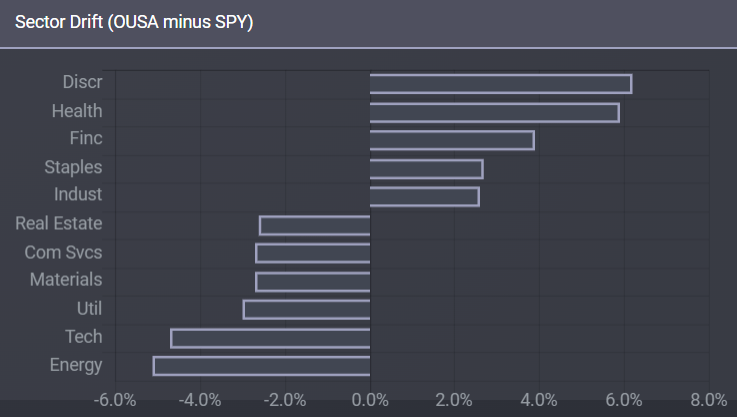
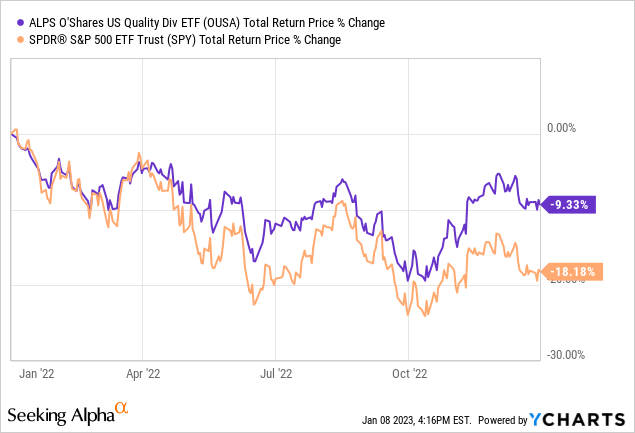
As can be seen above, OUSA’s industry exposures tend to differ from those of the S&P 500 by quite a bit, but I fail to see a pattern. OUSA is underweight old-economy industries with cheap valuations and commodity price exposure like energy and materials, but also underweight frothy growth industries like tech and communication services. OUSA’s overweight positions are a bit more clearly on the value side of the equation, but not firmly so. On net, the fund seems to tilt old-economy value, as evidenced by its strong performance during 2022.
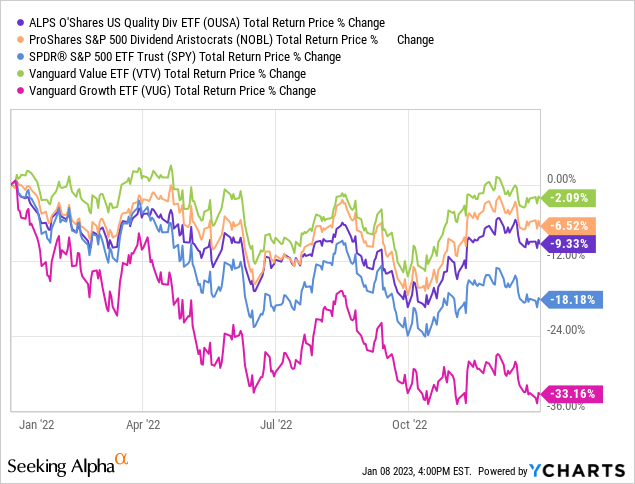
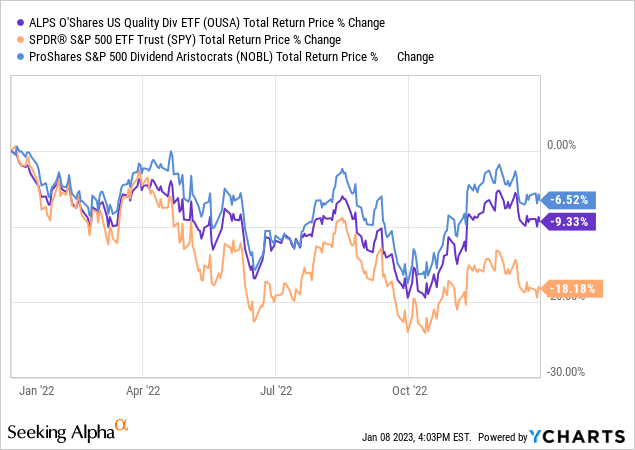
As can be seen above, OUSA outperformed in 2022, in-line with value performance, as well as large-cap quality dividend performance (see NOBL). Bear in mind, although these results are consistent with the fund’s industry exposures, the situation is quite complex, and I’m not 100% certain that the fund would outperform during similar conditions moving forward. OUSA does not invest in energy, the best-performing industry YTD, and although the fund’s other industry exposures more than outweighed its exclusion of energy stocks, this might not be the case moving forward.
OUSA’s holdings and industry exposures are relatively unique amongst its peers, with relatively low weight overlaps across the board. From what I’ve seen, OUSA is most similar to the S&P 500. Approximately all of OUSA’s holdings are included in said index, and there is a 39% overlap by weight.
Etfrc.com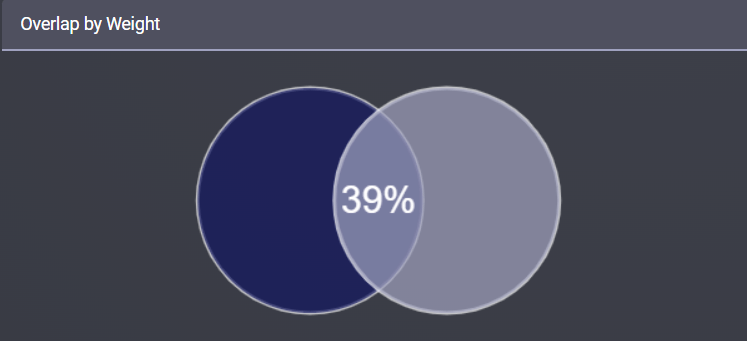
Overlaps are much lower for most other indexes and funds. OUSA and NOBL, which share similar high-level characteristics, only overlap 21%. Similar values for most other relevant indexes and funds.
Etfrc.com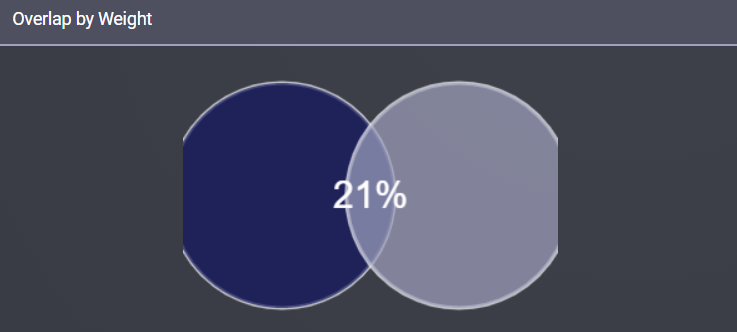
OUSA’s relatively unique portfolio means fund performance could significantly differ from those of its index and peers, although this has rarely been the case in the past.
To summarize, OUSA is a multi-factor index ETF, investing in large-cap U.S. equities with above-average quality, dividends, and below-average volatility. Let’s have a closer look at these three benefits.
OUSA – Benefits
Above-Average Quality, Below-Average Volatility
OUSA invests in companies with above-average quality and below-average volatility, as evidenced by their low leverage and realized volatility.
O’Shares U.S. Quality Dividend Index
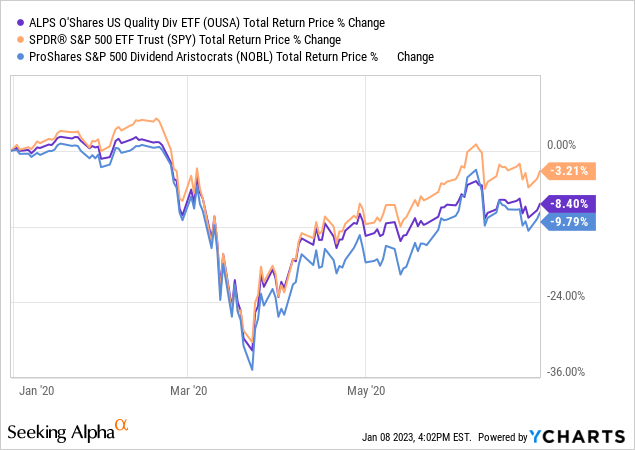
These two characteristics reduce risk, volatility, and should reduce losses during downturns. Differences in industry exposures could, potentially, impact that last factor though. OUSA itself moderately underperformed during early 2020, the onset of the coronavirus pandemic, likely due to the aforementioned differences.
On the other hand, OUSA moderately outperformed in 2022, another period of significant stock market losses.
OUSA’s high-quality, low-volatility holdings reduce risk, volatility, and potential losses during downturns, but the impact seems to moderate, at best, and swamped by differences in industry exposures.
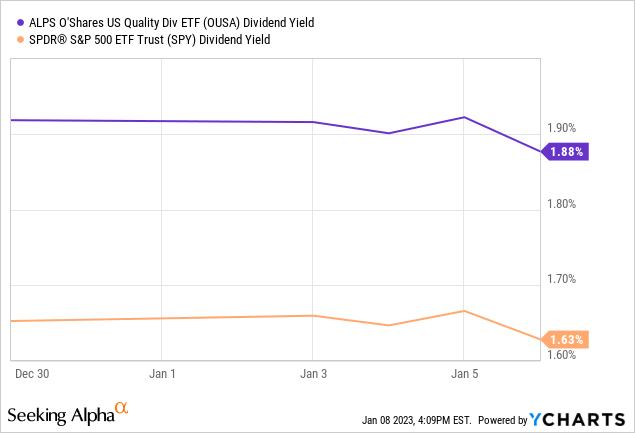
Above-Average Dividends
OUSA focuses on companies with above-average dividends, as per its underlying index methodology, and as evidenced by the fund’s above-average yield:
And above-average dividend growth track-record:
OUSA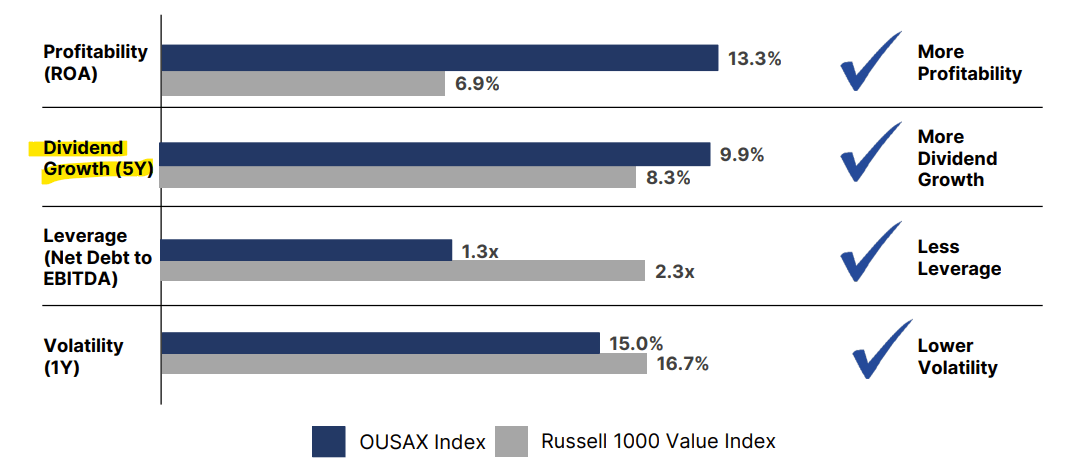
OUSA’s above-average dividends are a benefit for the fund and its shareholders, but a minor one at that: yields remain low, and dividend growth barely higher than average. OUSA is quite clearly a subpar income vehicle, above-average dividends notwithstanding.
OUSA does focus on high-quality, low-volatility stocks with above-average dividends, all of which benefit the fund and its shareholders, but the impact seems incredibly muted, in my opinion at least.
OUSA – Performance Analysis
OUSA’s performance track-record seems reasonable enough, with the fund slightly underperforming since inception, but significantly outperforming YTD. Said pattern is quite common for dividend, quality, and value ETFs, as it reflects long-term growth / tech outperformance, and a more recent shift towards old-economy industries and sectors.
OUSA
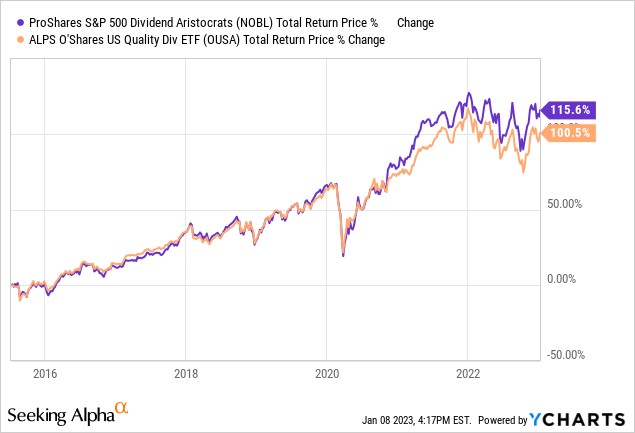
OUSA technically consistently underperforms relative to NOBL and value indexes, but the difference is quite small, and not terribly material. The figures above are accurate, but I feel overstate OUSA’s actual underperformance due to issues of timing. Looking at the fund’s returns since inception might be of use.
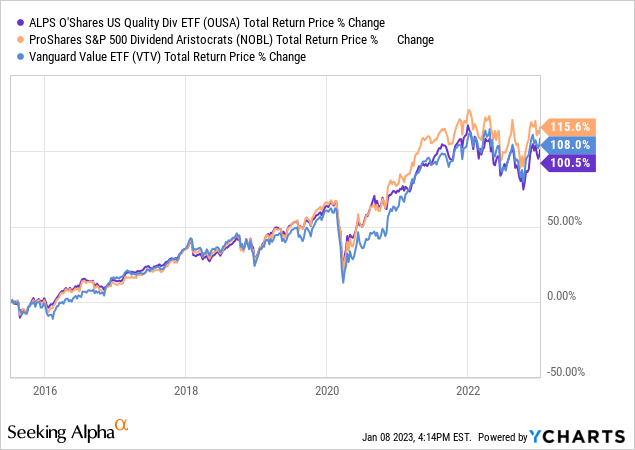
As can be seen above, OUSA has underperformed relative to its peers since inception, but by very little. In general terms, I don’t think the fund’s underperformance to be all that material, nor indicative of the fund’s future expected returns.
OUSA – Complexity
OUSA is a somewhat complicated fund, as its underlying index considers quality, dividend, and volatility metrics when constructing its portfolio. Although there is nothing inherently wrong with this, it does make it difficult to analyze the fund, and to forecast its performance: it simply has too many moving parts.
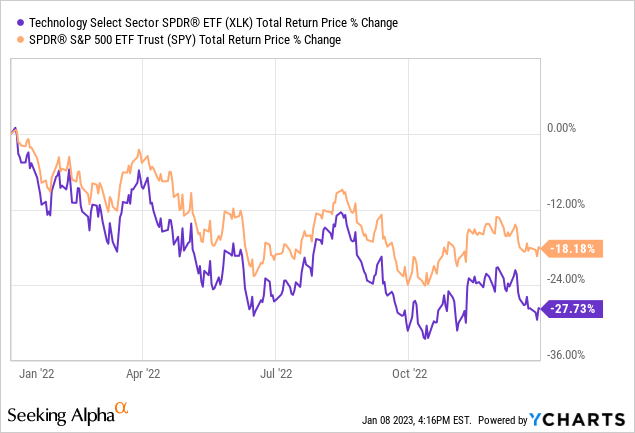
As an example, OUSA’s exclusion of energy stocks significantly reduced fund returns during 2022, as energy was the best-performing industry segment for said time period, and by quite a large margin.
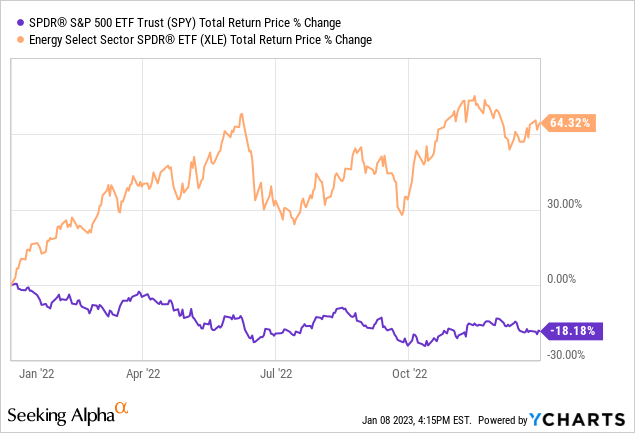
Excluding energy significantly reduced fund returns for the year, but the fund still managed to outperform, and by quite a healthy margin.
OUSA’s other industry exposures played a role in the above, but the situation is not trivially easy to explain. For instance, OUSA is somewhat underweight tech, an industry which has underperformed YTD. Said position definitely contributed to the fund’s outperformance, but only moderately so: the fund is still heavily invested in tech, and said industry has not underperformed that much YTD.
Although these issues do not harm the fund or its performance in any way, it does complicate matters for investors and analysts. It is not clear to me if the fund would continue to outperform if energy keeps posting strong returns, for instance.
In general terms, I prefer simpler investments to more complicated ones. OUSA is not complicated enough to warrant a hold or sell rating, but it is complicated enough that I slightly prefer its peers. Of these, NOBL seems closest to OUSA. NOBL invests in Dividend Aristocrats: S&P 500 components with at least 25 consecutive years of dividend growth. NOBL’s holdings have above-average quality and dividends, and below-average volatility, same as OUSA. NOBL generally performs in-line with OUSA, but has moderately outperformed since 2021.
Portfolio holdings and weights are surprisingly different, with these overlapping by only 21%.
Etfrc.com
Still, NOBL seems similar enough to OUSA, has slightly outperformed since inception, and follows a much simpler index. OUSA is fine, but NOBL is better, in my opinion at least.
Conclusion
OUSA invests in companies with strong fundamentals, considering quality, dividend, and volatility metrics. Although the fund is a buy, I believe that there are slightly similar, but simpler, stronger, choices out there, including NOBL.
Be the first to comment