

smodj
Earnings of OP Bancorp (NASDAQ:OPBK) will most probably stay flattish in 2023. Subdued loan growth and slight margin expansion will likely support the bottom line. On the other hand, inflation-driven growth of operating expenses will limit earnings growth. Overall, I’m expecting OP Bancorp to report earnings of $2.20 per share for 2022, up 17%, and $2.24 per share for 2023, up by just 2% year-over-year. Compared to my last report on the company, I’ve reduced my earnings estimates mostly because I’ve raised my operating expense estimates. The December 2023 target price suggests a high upside from the current market price. Further, OP Bancorp is offering a high dividend yield for a bank-holding company. Based on the total expected return, I’m maintaining a buy rating on OP Bancorp.
Recent Deterioration of Balance Sheet Positioning to Hurt the Pace of Margin Growth
OP Bancorp’s net interest margin expanded by ten basis points in the third quarter, after growing by nine basis points in the second quarter of the year. The rate of expansion will most probably decline in the near future because of recent shifts in the loan and deposit mixes.
OP Bancorp’s deposit mix has worsened as the proportion of non-interest-bearing deposits in total deposits has fallen and the proportion of other deposits has risen. Non-interest-bearing deposits dropped to 43.7% by the end of September 2022 from 50.5% at the end of December 2021. Nevertheless, the balance of non-interest-bearing deposits is still quite large and should keep the average deposit costs sticky in the near term.
The loan mix has also worsened in the same timeframe. Variable-rate loans were down to 30.7% of total loans by the end of September from 45.7% at the end of December 2021, as mentioned in the earnings presentation. Therefore, the pace of margin expansion will most probably subside in future quarters.
Further, a large balance of certificates of deposits (“CD”) will mature in the coming quarters. According to details given in the presentation, CDs totaling $488 million will mature by the third quarter of 2023, representing 27% of total deposits. New replacement CDs will carry higher rates as market interest rates have risen. Therefore, the CD maturity will lead to higher average deposit costs.
Considering these factors, I’m expecting the margin to have increased by five basis points in the last quarter of 2022. Further, I’m expecting the margin to grow by another five basis points in 2023.
Loan Growth to be Slightly Below the Historical Average
Thanks to exceptional loan growth during the third quarter, OP Bancorp is now on track to post the strongest yearly growth in the last five years. The loan portfolio grew by 9% during the quarter, taking the first nine-month growth to 23%, or 31% annualized. Going forward, loan growth will naturally slow down because of high-interest rates that will temper credit demand.
However, the persistently strong regional economy will likely support loan growth. OP Bancorp mostly operates in California with a concentration in Los Angeles. The company also has some presence in Atlanta GA, Aurora CO, Lynnwood WA, Seattle WA, and Carrollton TX. Although OP Bancorp focuses on Korean Americans, it is not restricted to any ethnicity. As shown below, the trend line for California’s economic activity is far steeper than the trend line for the national average.
The Federal Reserve Bank of Philadelphia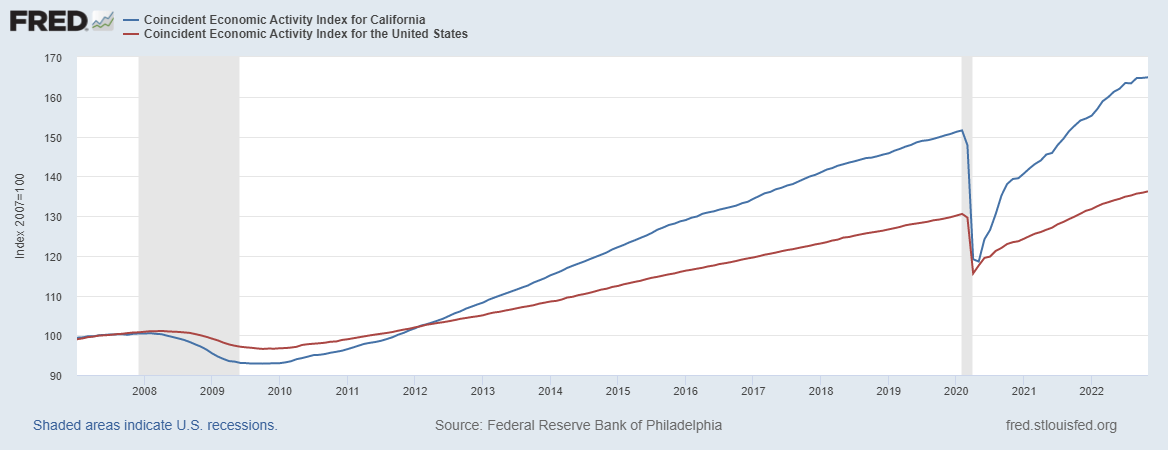
Considering these factors, I’m expecting the loan portfolio to have grown by 3% in the last quarter of 2022, taking full-year loan growth to 27%. For 2023, I’m expecting the portfolio to grow by 13%, which is slightly below the average for the last five years. Meanwhile, deposits will most probably grow in line with loans. The following table shows my balance sheet estimates.
| Financial Position | FY18 | FY19 | FY20 | FY21 | FY22E | FY23E |
| Net Loans | 865 | 980 | 1,084 | 1,298 | 1,648 | 1,854 |
| Growth of Net Loans | 17.1% | 13.2% | 10.6% | 19.7% | 26.9% | 12.6% |
| Other Earning Assets | 63 | 68 | 129 | 251 | 242 | 262 |
| Deposits | 905 | 1,021 | 1,200 | 1,534 | 1,871 | 2,106 |
| Borrowings and Sub-Debt | – | 10 | 13 | 10 | 20 | 22 |
| Common equity | 130 | 141 | 143 | 165 | 171 | 192 |
| Tangible BVPS ($) | 8.3 | 8.8 | 9.4 | 10.9 | 11.2 | 12.6 |
| Source: SEC Filings, Author’s Estimates(In USD million unless otherwise specified) | ||||||
Reducing the Earnings Estimate due to Higher than Expected Operating Expenses
OP Bancorp’s non-interest expenses surged by more than I expected during the third quarter of 2022. Going forward, these expenses will grow even further because of the high inflation in the economy. Since the issuance of my last report on OP Bancorp in September 2022, my inflation outlook has worsened. Therefore, I’ve decided to raise my non-interest expense estimates.
In contrast to operating expenses, the anticipated loan growth and slight margin expansion will lift earnings. Meanwhile, the provisioning for expected loan losses will likely remain close to a normal level. The existing loan loss reserve coverage seems high enough to weather any potential upcoming economic storms. Allowances were 1.14% of total loans while non-performing loans were just 0.14% of total loans at the end of September 2022. As a result, I’m expecting the net provision expense to make up around 0.15% of total loans in 2023, which is the same as the average from 2017 to 2019.
Overall, I’m expecting OP Bancorp to report earnings of $2.20 per share for 2022, up 17% year-over-year. For 2023, I’m expecting earnings to grow by just 2% to $2.24 per share. The following table shows my income statement estimates.
| Income Statement | FY18 | FY19 | FY20 | FY21 | FY22E | FY23E |
| Net interest income | 41 | 44 | 45 | 61 | 78 | 94 |
| Provision for loan losses | 1 | 1 | 6 | 1 | 3 | 3 |
| Non-interest income | 9 | 11 | 11 | 16 | 19 | 18 |
| Non-interest expense | 30 | 33 | 32 | 36 | 46 | 56 |
| Net income – Common Sh. | 14 | 16 | 13 | 29 | 34 | 34 |
| EPS – Diluted ($) | 0.89 | 1.03 | 0.85 | 1.88 | 2.20 | 2.24 |
| Source: SEC Filings, Earnings Releases, Author’s Estimates(In USD million unless otherwise specified) | ||||||
In my last report on the company, I estimated earnings of $2.25 per share for 2022 and $2.39 per share for 2023. I’ve reduced my earnings estimates mostly because I’ve increased my non-interest expense estimates.
My estimates are based on certain macroeconomic assumptions that may not come to fruition. Therefore, actual earnings can differ materially from my estimates.
OPBK is Trading at a Large Discount to its Target Price
OP Bancorp is offering a dividend yield of 4.3% at the current quarterly dividend rate of $0.12 per share. The earnings and dividend estimates suggest a payout ratio of 21% for 2023, which is in line with the 2019-2021 average of 23%. Therefore, I’m not expecting an increase in the dividend level.
I’m using the historical price-to-tangible book (“P/TB”) and price-to-earnings (“P/E”) multiples to value OP Bancorp. The stock has traded at an average P/TB ratio of 0.94 in the past, as shown below.
| FY19 | FY20 | FY21 | Average | |||
| T. Book Value per Share ($) | 8.8 | 9.4 | 10.9 | |||
| Average Market Price ($) | 9.5 | 7.2 | 10.5 | |||
| Historical P/TB | 1.08x | 0.77x | 0.96x | 0.94x | ||
| Source: Company Financials, Yahoo Finance, Author’s Estimates | ||||||
Multiplying the average P/TB multiple with the forecast tangible book value per share of $12.6 gives a target price of $11.8 for the end of 2023. This price target implies a 4.6% upside from the January 20 closing price. The following table shows the sensitivity of the target price to the P/TB ratio.
| P/TB Multiple | 0.74x | 0.84x | 0.94x | 1.04x | 1.14x |
| TBVPS – Dec 2023 ($) | 12.6 | 12.6 | 12.6 | 12.6 | 12.6 |
| Target Price ($) | 9.3 | 10.5 | 11.8 | 13.1 | 14.3 |
| Market Price ($) | 11.3 | 11.3 | 11.3 | 11.3 | 11.3 |
| Upside/(Downside) | (17.7)% | (6.6)% | 4.6% | 15.7% | 26.9% |
| Source: Author’s Estimates |
The stock has traded at an average P/E ratio of around 7.8x in the past, as shown below.
| FY19 | FY20 | FY21 | Average | |||
| Earnings per Share ($) | 1.03 | 0.85 | 1.88 | |||
| Average Market Price ($) | 9.5 | 7.2 | 10.5 | |||
| Historical P/E | 9.3x | 8.5x | 5.6x | 7.8x | ||
| Source: Company Financials, Yahoo Finance, Author’s Estimates | ||||||
Multiplying the average P/E multiple with the forecast earnings per share of $2.24 gives a target price of $17.5 for the end of 2023. This price target implies a 17.5% upside from the January 20 closing price. The following table shows the sensitivity of the target price to the P/E ratio.
| P/E Multiple | 5.8x | 6.8x | 7.8x | 8.8x | 9.8x |
| EPS 2023 ($) | 2.24 | 2.24 | 2.24 | 2.24 | 2.24 |
| Target Price ($) | 13.0 | 15.3 | 17.5 | 19.8 | 22.0 |
| Market Price ($) | 11.3 | 11.3 | 11.3 | 11.3 | 11.3 |
| Upside/(Downside) | 15.4% | 35.3% | 55.2% | 75.1% | 95.0% |
| Source: Author’s Estimates |
Equally weighting the target prices from the two valuation methods gives a combined target price of $14.7, which implies a 29.9% upside from the current market price. Adding the forward dividend yield gives a total expected return of 34.2%. Hence, I’m maintaining a buy rating on OP Bancorp.
Be the first to comment