

RgStudio
This article was originally published on Dividend Kings on Wednesday, January 11th, 2023.
—————————————————————————————
How would you like to retire a millionaire? Who wouldn’t!?
But with 45% of Americans worried about retiring at all, much less in safety and splendor, that dream seems impossible to many.
According to a recent survey, even 35% of millionaires worry that they won’t be able to retire!
But what if I told you there was a 5.4% yielding company growing at double-digits that was precisely the kind of rich retirement dream stock that could make your financial dreams come true?
Safe midstream blue-chips offer this but many investors dislike this space for three key reasons.
- some have K1 tax forms
- some have foreign tax withholdings
- the green energy transition is something all must plan for and overcome in the future
But this is where ONEOK (NYSE:OKE), the 5.4% growth king of midstream shines.
- no K1 tax form (qualified dividends)
- US company with no dividend tax withholdings
- a great green energy transition plan and very strong track record of long-term risk management
Best of all? Analysts currently expect OKE to deliver almost 16% long-term returns in the future. That’s on par with the greatest investors in history, and could run circles around not just the S&P and dividend aristocrats, but even the Nasdaq.
ONEOK Rolling Returns Since 1985
Portfolio Visualizer Premium 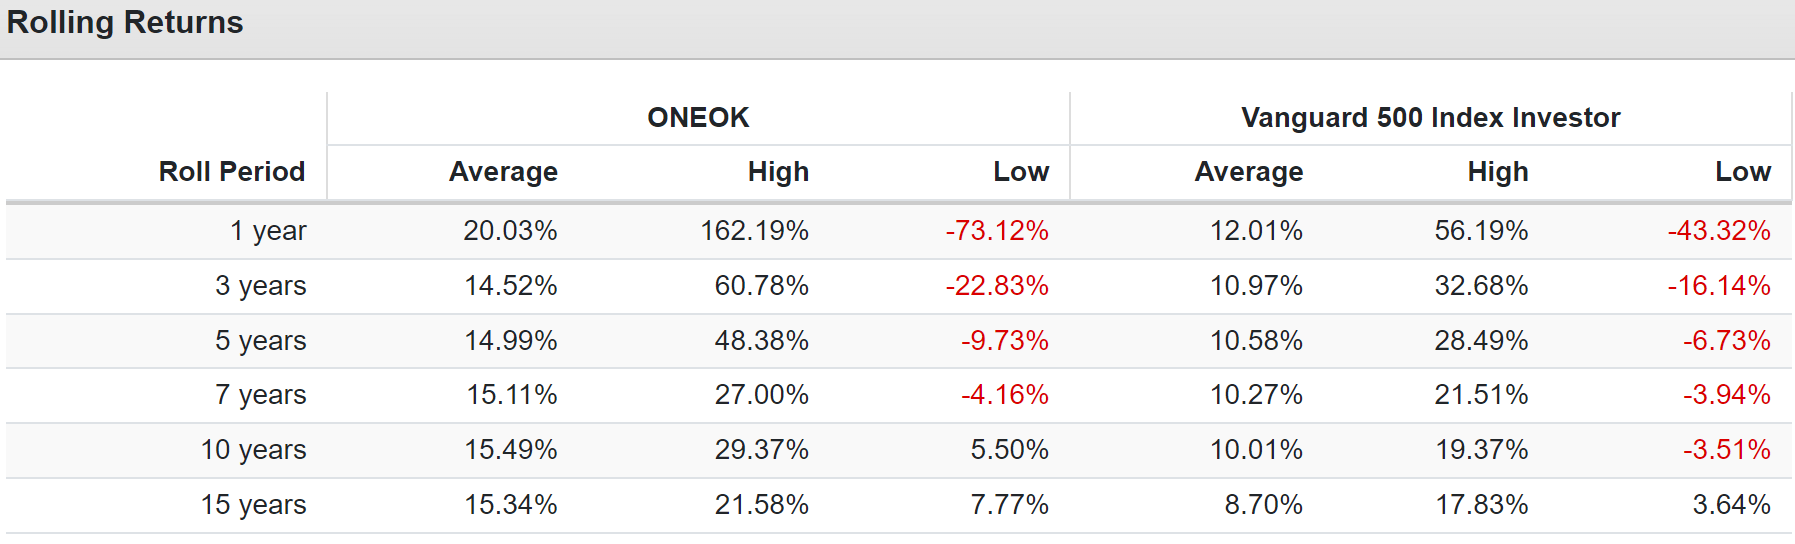
It’s also similar to the returns OKE has been delivering with incredible consistency for the last four decades.
So let me show you why 5.4% yielding OKE is a potential rich retirement dream stock that could be just what you need to make your dreams of retiring rich and staying rich in retirement, a reality.
ONEOK: One Of The Best High-Yield Blue-Chips You Might Not Have Heard Of
Oneok brings together high-quality assets, some of the strongest near- to medium-term growth prospects in our coverage as Rockies volumes continue their ongoing rebound, a C-Corporation structure, and a well-respected management team in a compelling package.” – Morningstar
Morningstar loves OKE, and it’s not hard to see why.
Investor presentation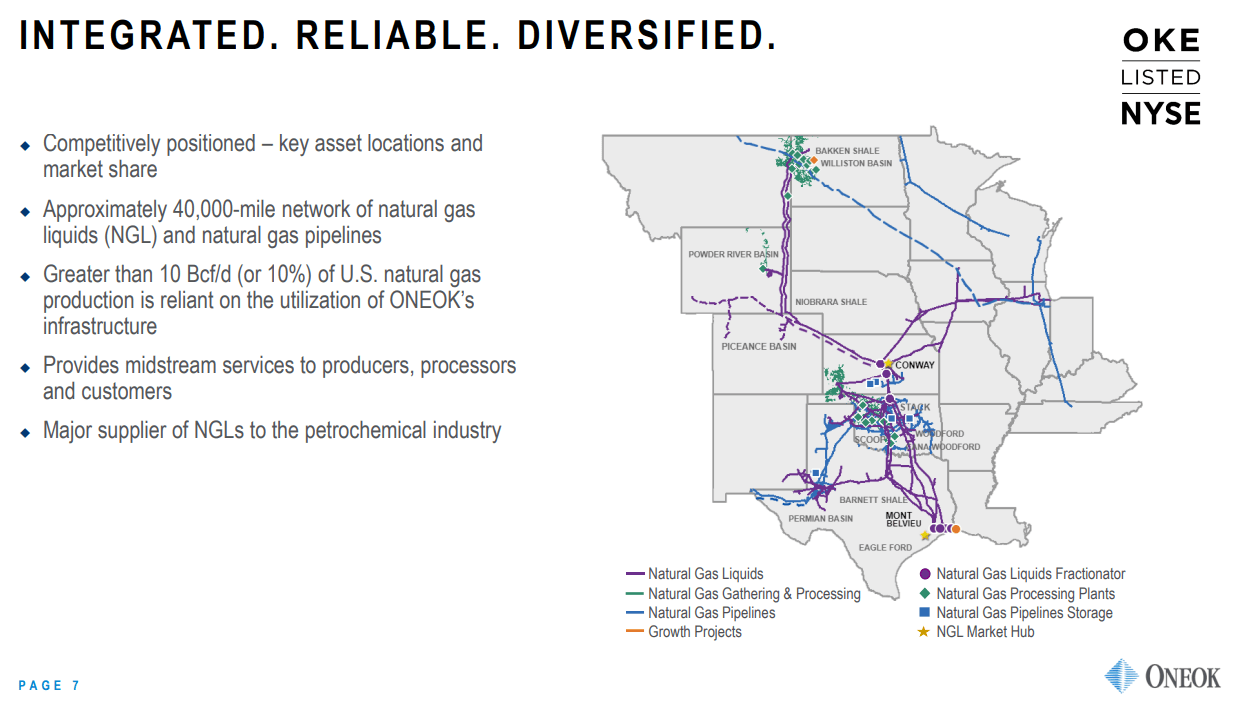
OKE owns 40,000 miles of natural gas and natural gas liquid or NGL pipelines, connecting America’s most important shale formations.
Investor presentation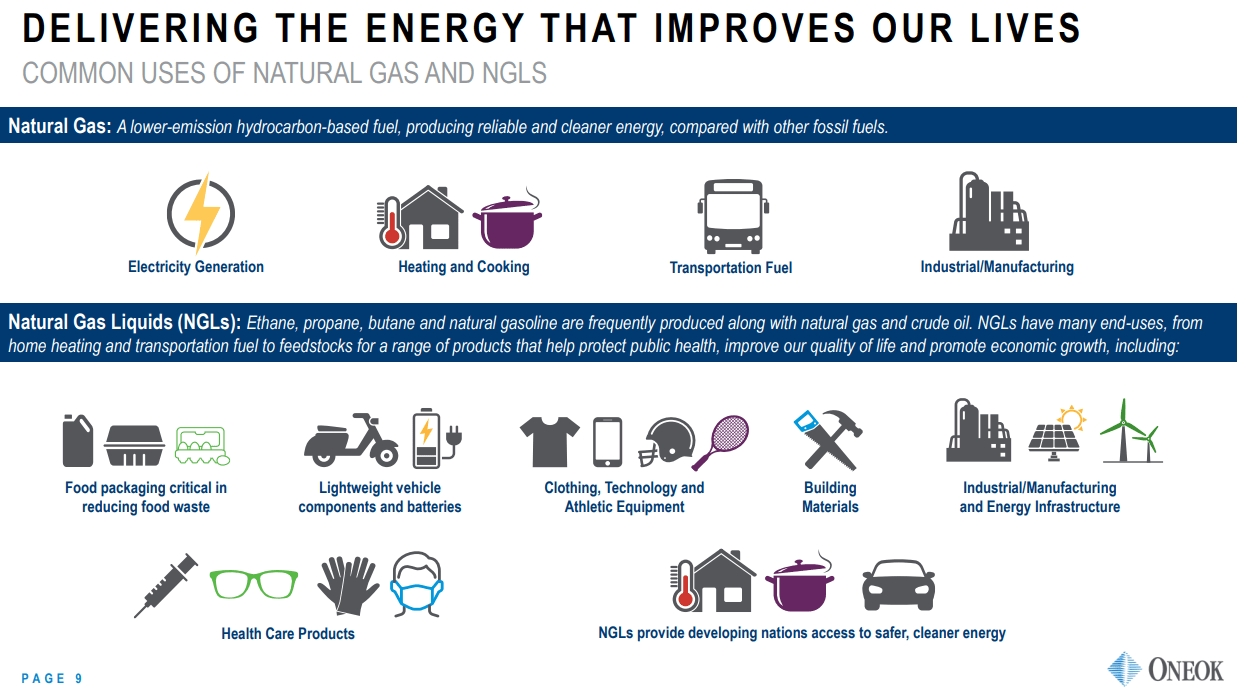
NGLs are the basis of petrochemicals found in almost every product we buy, from medicine to batteries to solar panels and wind turbines. Without NGLs, there can be no green energy transition.
OKE was founded in 1906 in Tulsa, Oklahoma, making it the oldest midstream in North America. Its corporate culture is built on long-term durability, and it’s survived and thrived through:
- 19 recessions
- four depressions
- a flu pandemic that killed 5% of humanity
- two world wars
- inflation as high as 22%
- interest rates as high as 20%
- over 23 bear markets
- 78 market corrections
- 234 market pullbacks
Invasions, pandemics, and financial crises, OKE overcame them all over the last 117 years. It’s truly built to last and could very well outlive us all.
OKE might not be famous for its dividend growth streak, which Enbridge (ENB) holds the industry record at 28 years, but OKE hasn’t cut its dividend for 35 years.
Oneok management managed the balance sheet well during the latest energy market turmoil in 2020, issuing debt and equity to shore up liquidity while significantly slicing capital spending. The firm maintained a very strong near-term liquidity profile while concurrently placing several large and complex projects in service with no major issues. Leverage is now beginning to decline fairly rapidly and stands at a more reasonable 3.8 times as of the third quarter of 2022, and we expect it could be around 3.2 times at the end of 2023.” – Morningstar
5.0X or less debt/EBITDA is considered safe by rating agencies for this industry, and OKE’s leverage in the last year was a very safe 3.8X and is expected to keep falling over time.
- It’s expected to hit 3.0X in 2024
That means OKE’s credit ratings should improve from already solid levels.
ONEOK Credit Ratings
| Rating Agency | Credit Rating | 30-Year Default/Bankruptcy Risk | Chance of Losing 100% Of Your Investment 1 In |
| S&P | BBB Stable Outlook | 7.5% | 13.3 |
| Fitch | BBB Stable Outlook | 7.5% | 13.3 |
| Moody’s | Baa3 (BBB- Equivalent) Positive Outlook | 11.00% | 9.1 |
| Consensus | BBB Stable Outlook | 8.67% | 11.5 |
(Sources: S&P, Fitch, Moody’s)
OKE’s fundamental risk is just under 9% meaning a 1 in 11.5 chance that anyone buying it today will get wiped out in the next three decades.
FactSet Research Terminal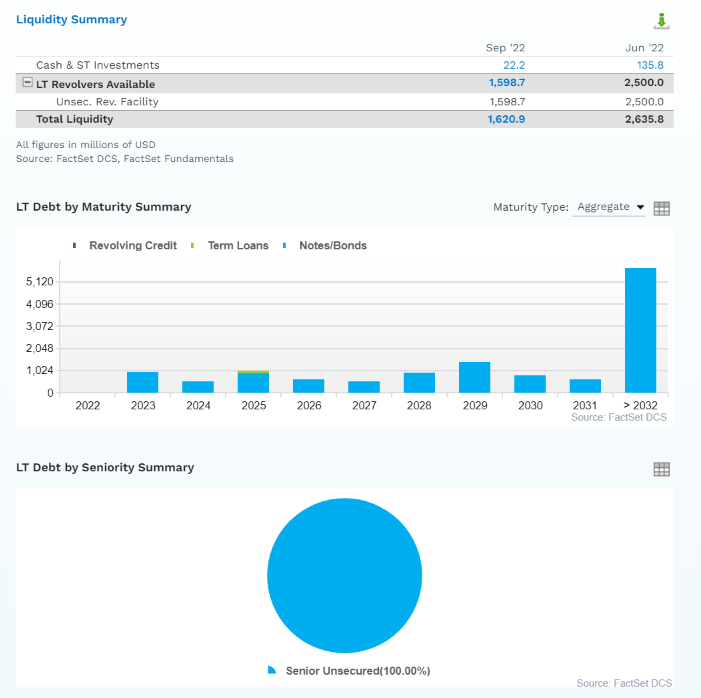
The company has $1.6 billion in liquidity, 100% unsecured bonds for maximum financial flexibility, and well-staggered debt maturities. The bond market is so confident in OKE’s energy transition plan that bond investors are willing to lend to it for three decades, out to 2051, at reasonable interest rates.
Basically, OKE is a wonderful high-yield dividend growth package.
investor presentation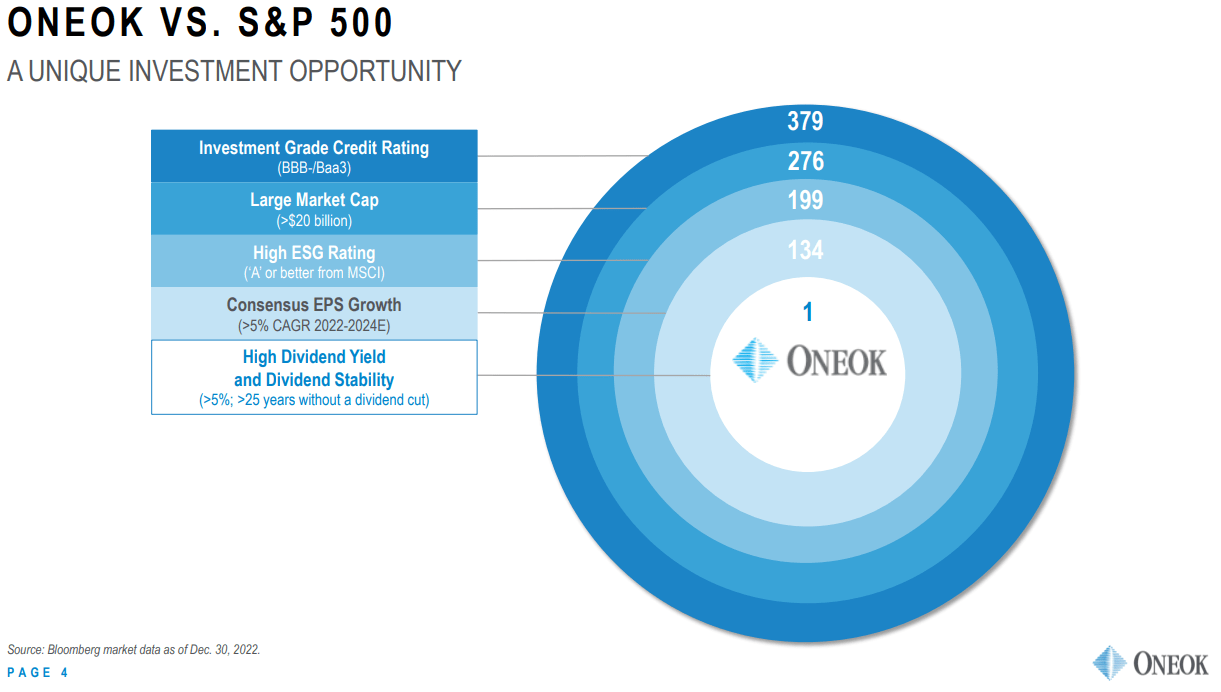
Thanks to its long-term take-or-pay contracts, its cash flow stability is impressive, even in the face of volatile energy prices.
investor presentation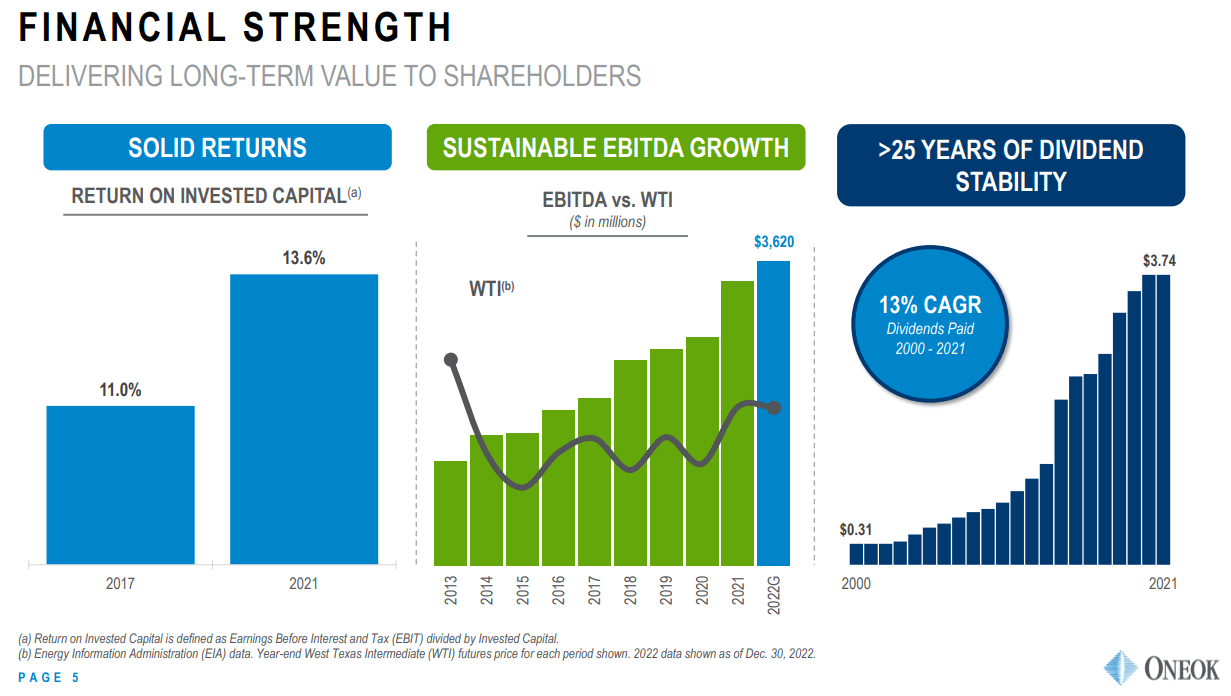
Its profitability has been steadily improving over time, as management remains disciplined with its growth capital spending.
OKE’s profitability is historically in the 70th percentile among its peers, indicating a narrow and stable moat.
investor presentation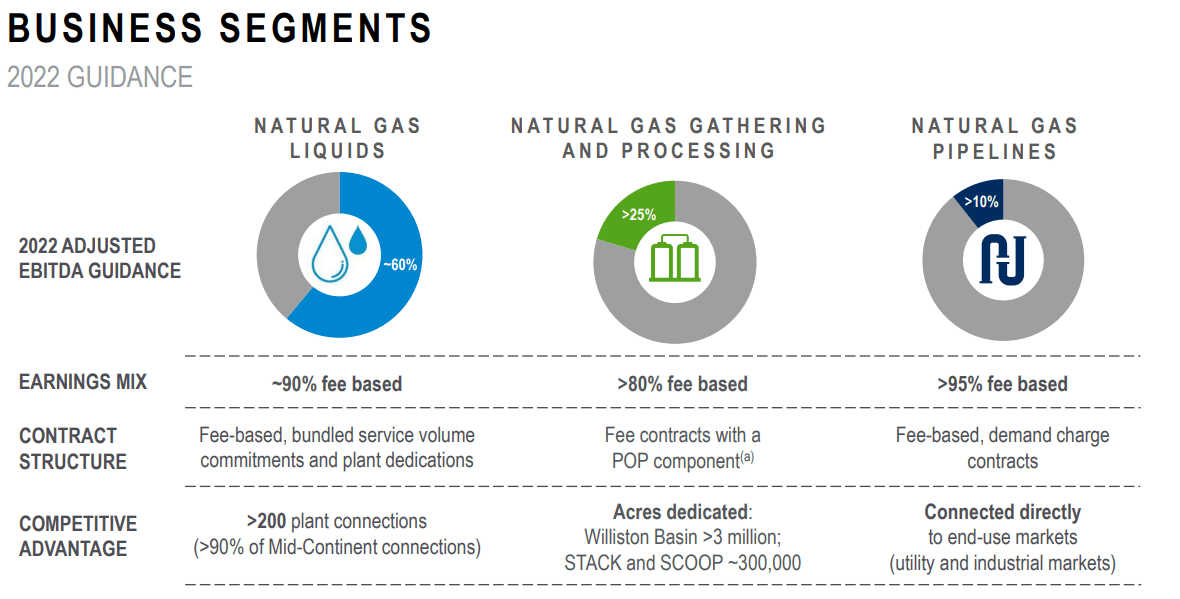
84% of OKE’s cash flow is protected from commodity prices by its long-term contracts. That’s why the dividend is very safe, in my opinion.
A Very Safe 5.4% Yield You Can Trust
| Rating | Dividend Kings Safety Score (233 Point Safety Model) | Approximate Dividend Cut Risk (Average Recession) | Approximate Dividend Cut Risk In Pandemic Level Recession |
| 1 – unsafe | 0% to 20% | over 4% | 16+% |
| 2- below average | 21% to 40% | over 2% | 8% to 16% |
| 3 – average | 41% to 60% | 2% | 4% to 8% |
| 4 – safe | 61% to 80% | 1% | 2% to 4% |
| 5- very safe | 81% to 100% | 0.5% | 1% to 2% |
| OKE | 91% | 0.5% | 1.45% |
| Risk Rating | Very Risk (89th S&P Global percentile risk-management) | BBB Stable Outlook credit rating = 7.5% 30-year bankruptcy risk | 15% or less max risk cap |
(Source: DK Research Terminal)
The approximate risk of OKE cutting its dividend even in a severe recession is 1 in 69. And in an average recession, it’s about 1 in 200.
- economists expect the mildest recession in US history in 2023
I’ll eat my hat if OKE cuts its dividend during this recession.
investor presentation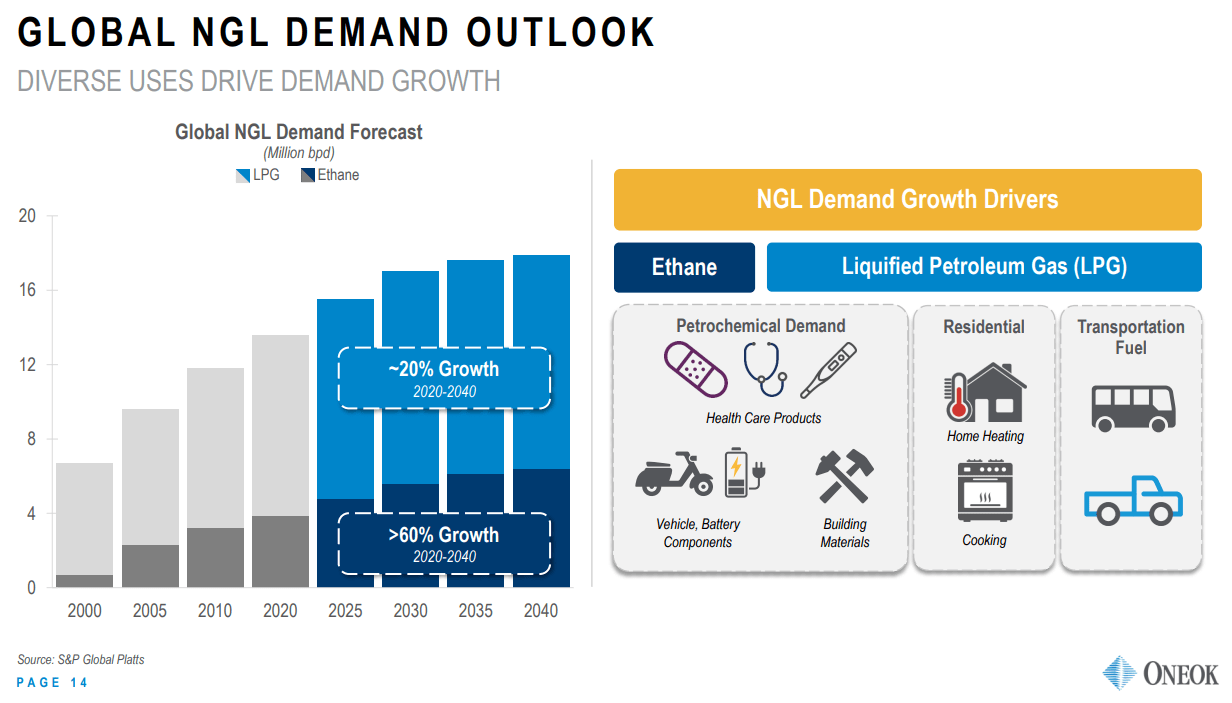
According to S&P, in the next 20 years, global NGL demand will grow by around 40%. With NGL an important input in the green energy transition and OKE a pure gas and NGL business, its green energy transition plan for the next 30 years is rather simple.
- Just keep doing what it’s doing
investor presentation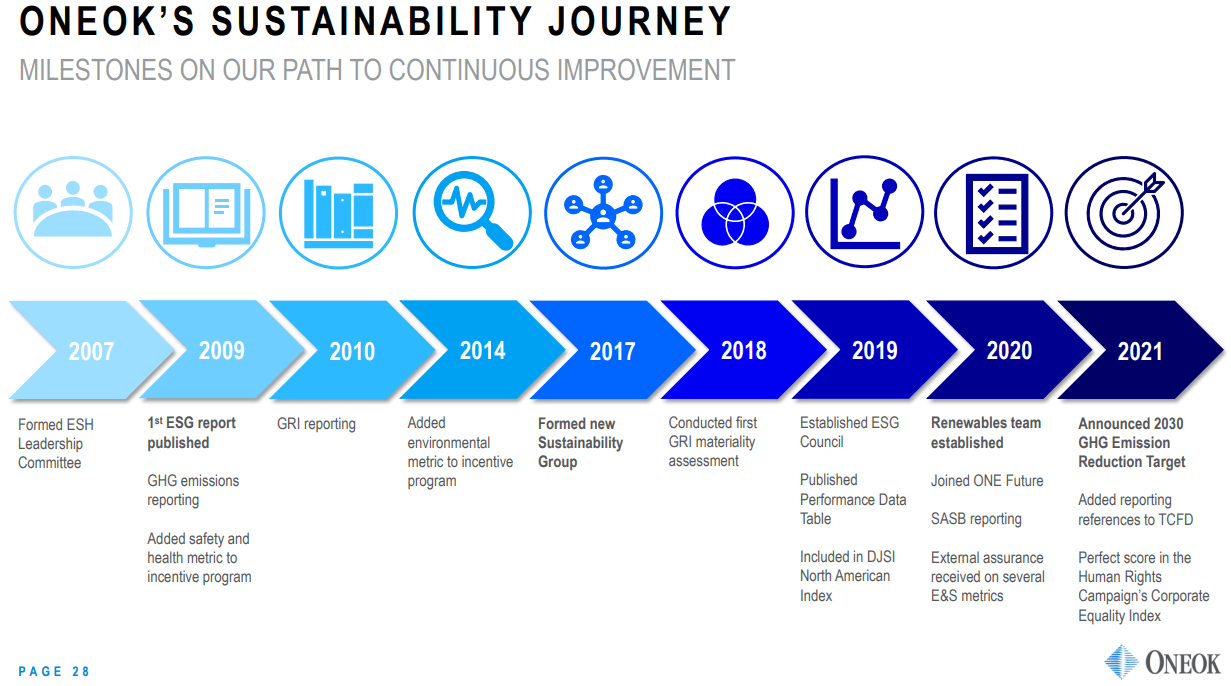
Because OKE is an industry leader in planning for the future, long beyond 2050, that includes setting up a renewable energy team in 2020. What else would you expect from the oldest midstream in the world, which has been around for 117 years and plans to be around 100 years from now?
investor presentation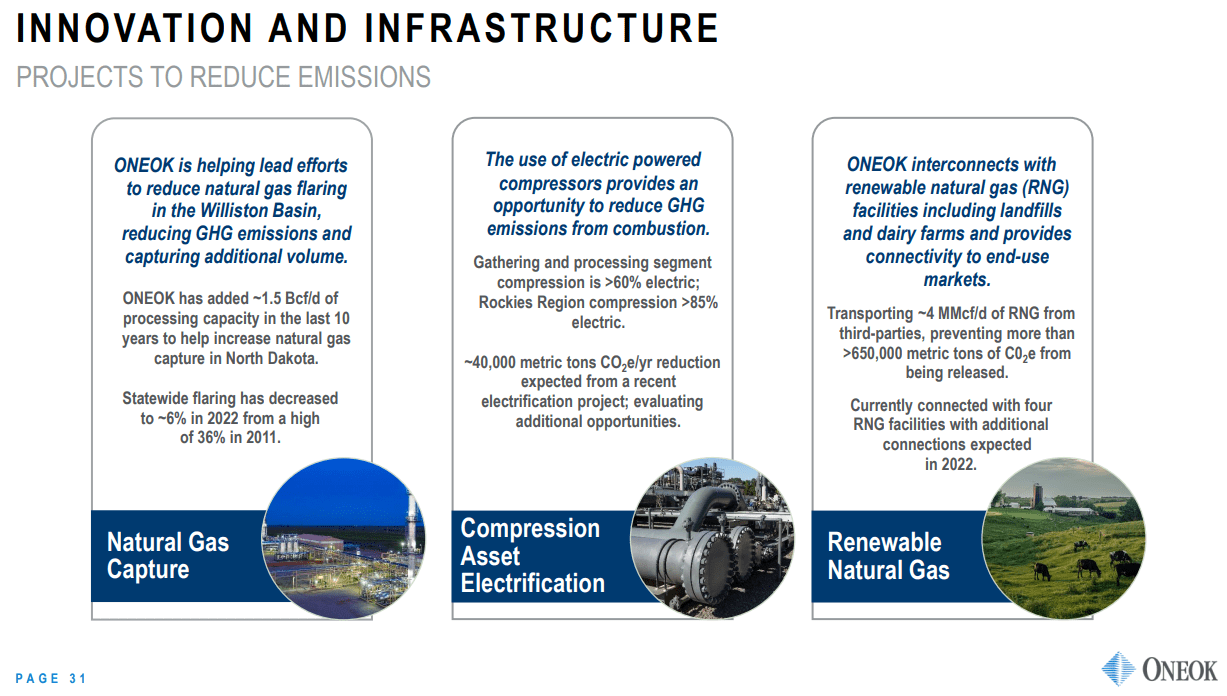
That includes things like helping oil companies capture more natural gas that is a byproduct of oil production, electrifying its operations, and renewable natural gas.
Some analysts estimate that 80% of US gas demand could be replaced with RNG, which comes from landfills and cows.
What do OKE’s focus on NGL, natural gas, and renewables mean for long-term investors?
The Best Growth Prospects Among Blue-Chip Midstream
Here’s what OKE’s growth outlook looks like for the next two years.
| Metric | 2022 Growth Consensus | 2023 Growth Consensus (Recession) |
2024 Growth Consensus |
| Sales | 35% | 1% | 9% |
| Dividend | 0% | 2% | 2% |
| Operating Cash Flow | 7% | 18% | 6% |
| Distributable Cash Flow | 7% | 8% | 9% |
| EBITDA | 4% | 11% | 4% |
| EBIT (operating income) | -2% | 11% | 4% |
(Source: FAST Graphs, FactSet)
Positive growth in all fundamentals despite a recession in 2023.
Most importantly, distributable cash flow, the midstream equivalent of REIT AFFO of FCF for corporations, is expected to accelerate and approach double-digits.
Full Free Cash Flow Self Funding
| Year | Distributable Cash Flow | Free Cash Flow | Distribution | DCF Payout Ratio | FCF Payout Ratio |
| 2022 | $2,626.0 | $1,931.04 | $1,671.78 | 63.7% | 86.6% |
| 2023 | $2,849.0 | $2,360.16 | $1,707.54 | 59.9% | 72.3% |
| 2024 | $3,117.0 | $2,981.49 | $1,752.24 | 56.2% | 58.8% |
| 2025 | $3,124.0 | $2,507.67 | $1,779.06 | 56.9% | 70.9% |
| 2026 | $3,200.0 | $2,655.18 | $1,957.86 | 61.2% | 73.7% |
| 2027 | $3,187.0 | $2,789.28 | $2,033.85 | 63.8% | 72.9% |
| Annual Growth | 3.95% | 7.63% | 4.00% | 0.05% | -3.38% |
(Source: FAST Graphs, FactSet)
Rating agencies consider 82% a safe DCF payout ratio (1.2X coverage) for midstream, and anything under a 100% FCF payout ratio is considered the platinum safety standard.
Why? Because DCF is what’s left over after running and maintaining the business, while FCF is what’s left over after running, maintaining and growing the business.
In other words, a sub-100% FCF payout ratio represents a fully sustainable business model that doesn’t require any new debt or stock sales to fund a midstream’s growth plans.
OKE’s DCF payout ratio is expected to remain stable at around 64%, in-line with ENB’s 60% to 70% policy.
And its FCF payout ratio is expected to drop from a good 87% in 2022 to a very safe 73% in 2027.
What about the long-term growth prospects?
ONEOK Long-Term Growth Prospects
(Source: FactSet Research Terminal)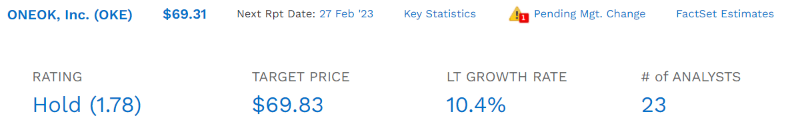
Thanks to its small size and NGL focus, OKE has the best growth prospects among blue-chip safe midstream.
DK Safe Midstream List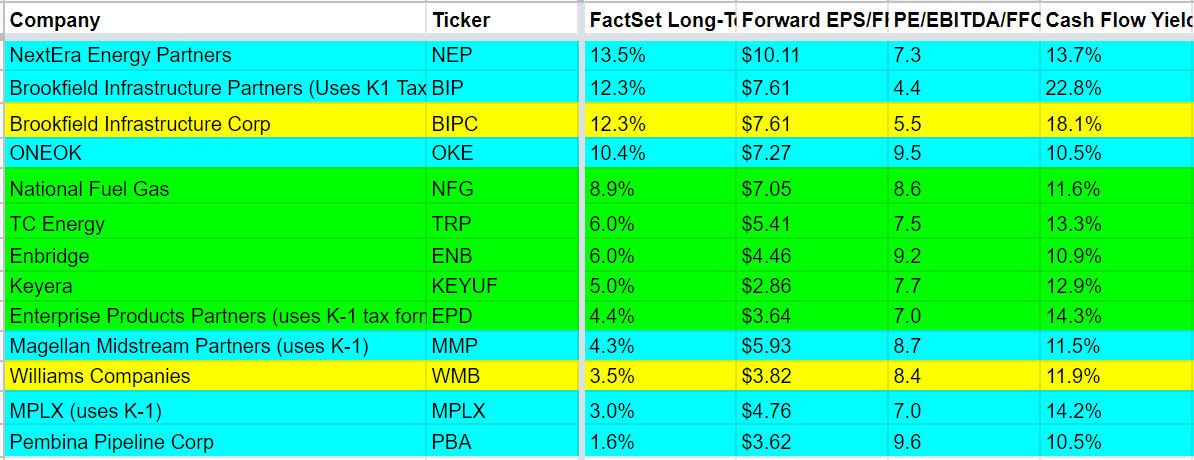
The only midstream blue-chips growing faster are NextEra Energy Partners (NEP) and Brookfield Infrastructure Partners (BIP) and they have only modest exposure to the industry. As far as pure midstreams go, OKE is the growth king.
How accurate are analysts at forecasting the growth of OKE?
FAST Graphs, FactSet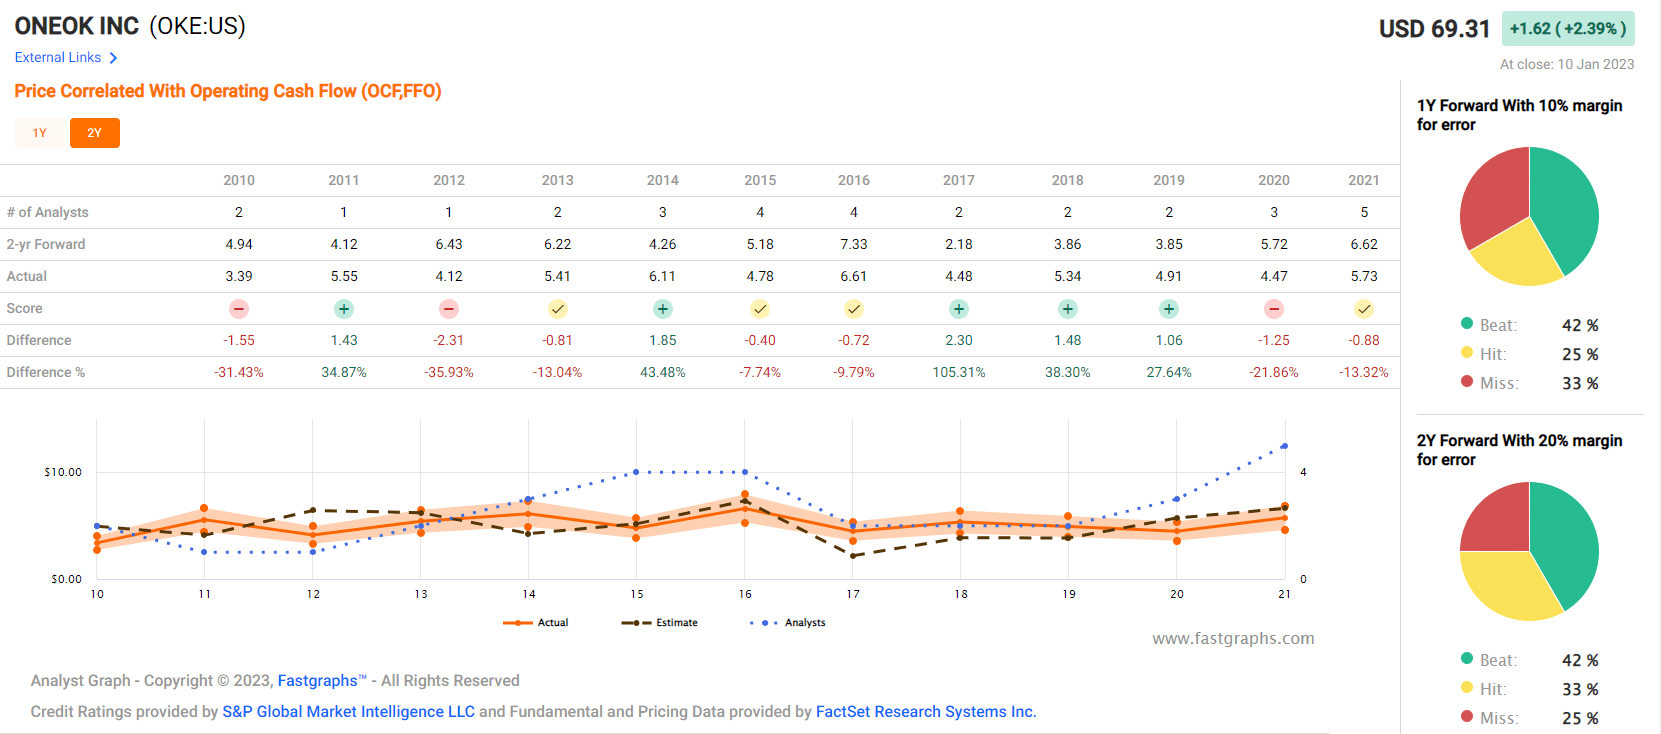
Smoothing for outliers, historical analyst margins-of-error are 15% to the downside and 40% to the upside.
- 8% to 15% CAGR margin-of-error adjusted growth consensus
FAST Graphs, FactSet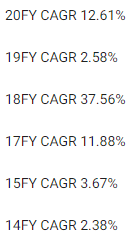
OKE’s growth rates can be volatile depending on when its projects come online and commodity prices. But for the last two decades, it grew cash flow at 13% annually.
Long-Term Consensus Return Potential
| Investment Strategy | Yield | LT Consensus Growth | LT Consensus Total Return Potential | Long-Term Risk-Adjusted Expected Return |
| ONEOK | 5.4% | 10.4% | 15.8% | 11.1% |
| Vanguard Dividend Appreciation ETF | 1.9% | 10.2% | 12.1% | 8.5% |
| Nasdaq | 0.8% | 10.9% | 11.7% | 8.2% |
| Schwab US Dividend Equity ETF | 3.4% | 7.6% | 11.0% | 7.7% |
| High-Yield Low Volatility Super SWANs | 3.8% | 6.7% | 10.5% | 7.3% |
| Dividend Aristocrats | 1.9% | 8.5% | 10.4% | 7.3% |
| S&P 500 | 1.7% | 8.5% | 10.2% | 7.2% |
| REITs | 3.9% | 6.1% | 10.0% | 7.0% |
| 60/40 Retirement Portfolio | 2.1% | 5.1% | 7.2% | 5.0% |
(Sources: DK Research Terminal, FactSet, Morningstar, Ycharts)
OKE could run circles around almost any popular investing strategy on Wall Street, beating the aristocrats, dividend growth blue-chips (VIG), and even the Nasdaq.
A conservative estimate for future returns is 11.1%, adjusting for the company’s risk of not growing as expected.
Inflation-Adjusted Consensus Return Potential: $1,000 Initial Investment
| Time Frame (Years) | 7.9% CAGR Inflation-Adjusted S&P 500 Consensus | 13.5% CAGR Inflation-Adjusted OKE Consensus | Difference Between Inflation-Adjusted OKE Consensus And S&P Consensus |
| 5 | $1,465.25 | $1,886.88 | $421.63 |
| 10 | $2,146.96 | $3,560.32 | $1,413.36 |
| 15 | $3,145.84 | $6,717.90 | $3,572.06 |
| 20 | $4,609.44 | $12,675.87 | $8,066.43 |
| 25 | $6,753.99 | $23,917.86 | $17,163.87 |
| 30 (bond market and retirement time frame) | $9,896.29 | $45,130.14 | $35,233.85 |
(Sources: DK Research Terminal, FactSet)
Over the next 30 years, during which the bond market is confident OKE will survive and thrive, it offers potentially 45X real returns, far more than the S&P.
| Time Frame (Years) | Ratio Inflation-Adjusted OKE Consensus vs. S&P consensus |
| 5 | 1.29 |
| 10 | 1.66 |
| 15 | 2.14 |
| 20 | 2.75 |
| 25 | 3.54 |
| 30 | 4.56 |
(Sources: DK Research Terminal, FactSet)
Indeed OKE offers 3X the very safe yield today and almost 5X the real return potential of the S&P over the next three decades.
Valuation: A Tad Overvalued For Now, But In A Stock Sell-Off, A Potentially Life-Changing Opportunity
FAST Graphs, FactSet FAST Graphs, FactSet FAST Graphs, FactSet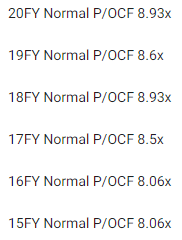
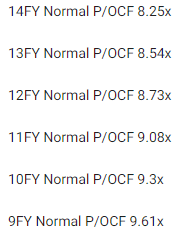
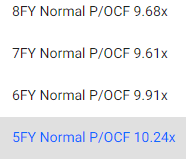
Millions of income investors have paid between 8X and 10X cash flow for OKE outside of bear markets and bubbles for the last two decades.
- 91% statistical probability that intrinsic value is within this range
| Metric | Historical Fair Value Multiples (14-Years) | 2022 | 2023 | 2024 | 2025 |
12-Month Forward Fair Value |
| 5-Year Average Yield (Pure Industry Bear Market) | 5.80% | $64.48 | $64.48 | $64.48 | $68.62 | |
| 13-Year Median Yield | 4.93% | $75.86 | $75.86 | $75.86 | $80.73 | |
| 25-Year Average Yield | 4.52% | $82.74 | $82.74 | $82.74 | $88.05 | |
| Operating Cash Flow | 9.23 | $56.76 | $67.10 | $71.35 | NA | |
| Average | $68.50 | $71.84 | $73.00 | $78.30 | $71.89 | |
| Current Price | $69.31 | |||||
|
Discount To Fair Value |
-1.18% | 3.52% | 5.06% | 11.48% | 3.58% | |
|
Upside To Fair Value (Including Dividends) |
-1.17% | 3.65% | 5.33% | 12.96% | 9.11% | |
| 2023 OCF | 2024 OCF | 2023 Weighted OCF | 2024 Weighted OCF | 12-Month Forward OCF | 12-Month Average Fair Value Forward P/OCF |
Current Forward P/OCF |
| $7.27 | $7.73 | $6.99 | $0.30 | $7.29 | 9.86 | 9.51 |
OKE is historically worth about 10X cash flow and today trades at 9.5, a 4% discount.
| Rating | Margin Of Safety For Very Low-Risk 12/13 Super SWAN Quality Companies | 2023 Fair Value Price | 2024 Fair Value Price | 12-Month Forward Fair Value |
| Potentially Reasonable Buy | 0% | $71.84 | $73.00 | $71.89 |
| Potentially Good Buy | 10% | $64.66 | $65.70 | $64.70 |
| Potentially Strong Buy | 20% | $57.47 | $58.40 | $57.51 |
| Potentially Very Strong Buy | 30% | $45.26 | $51.10 | $50.32 |
| Potentially Ultra-Value Buy | 40% | $43.10 | $43.80 | $43.13 |
| Currently | $69.31 | 3.52% | 5.06% | 3.58% |
| Upside To Fair Value (Including Dividends) | 9.05% | 10.73% | 9.11% |
OKE is a potentially reasonable buy for anyone comfortable with its risk profile, and here’s why.
ONEOK 2024 Consensus Total Return Potential
(Source: FAST Graphs, FactSet)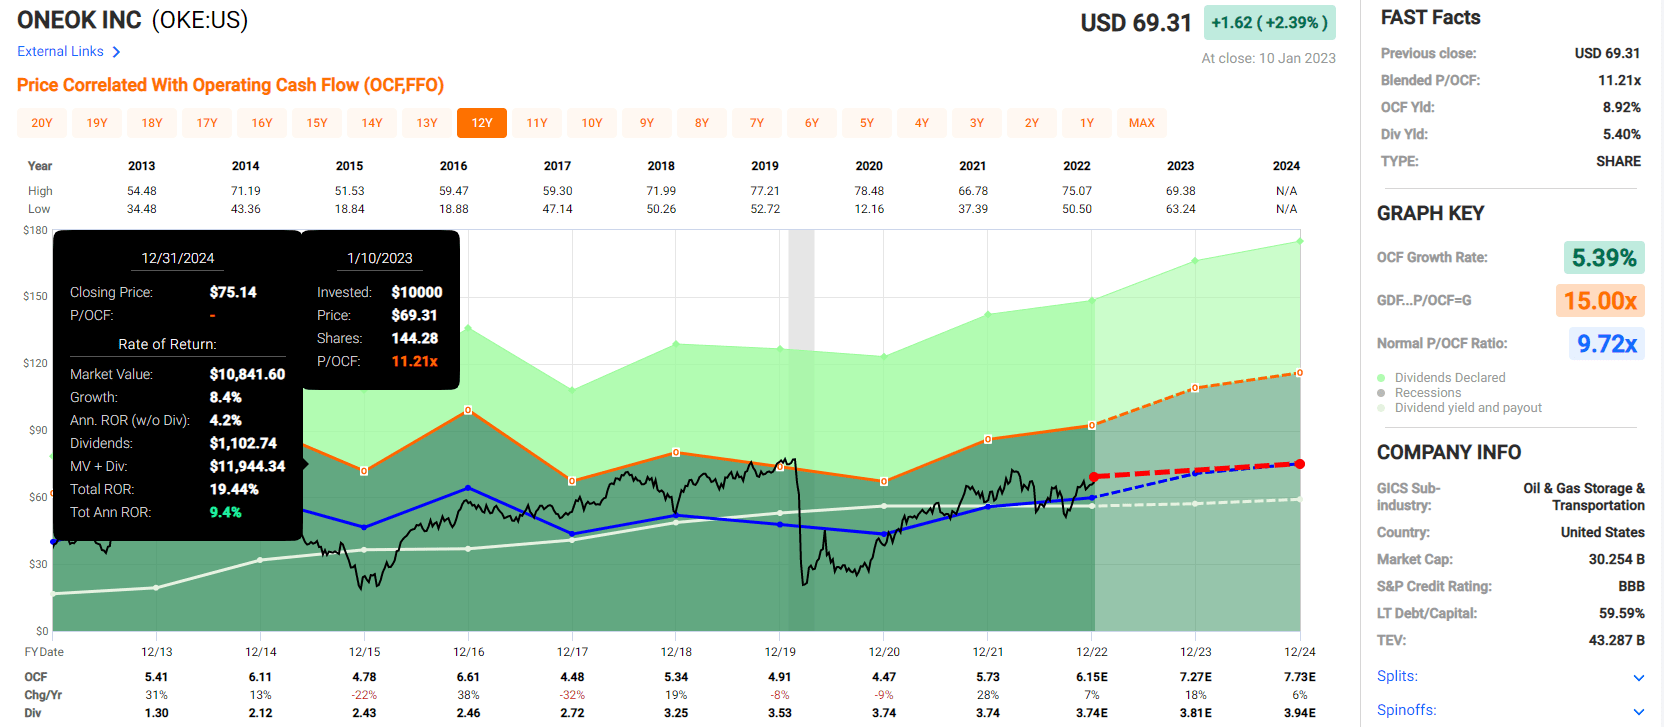
Those buying OKE today can reasonably expect about 9% to 10% annual returns over the next two years.
ONEOK 2028 Consensus Total Return Potential
(Source: FAST Graphs, FactSet)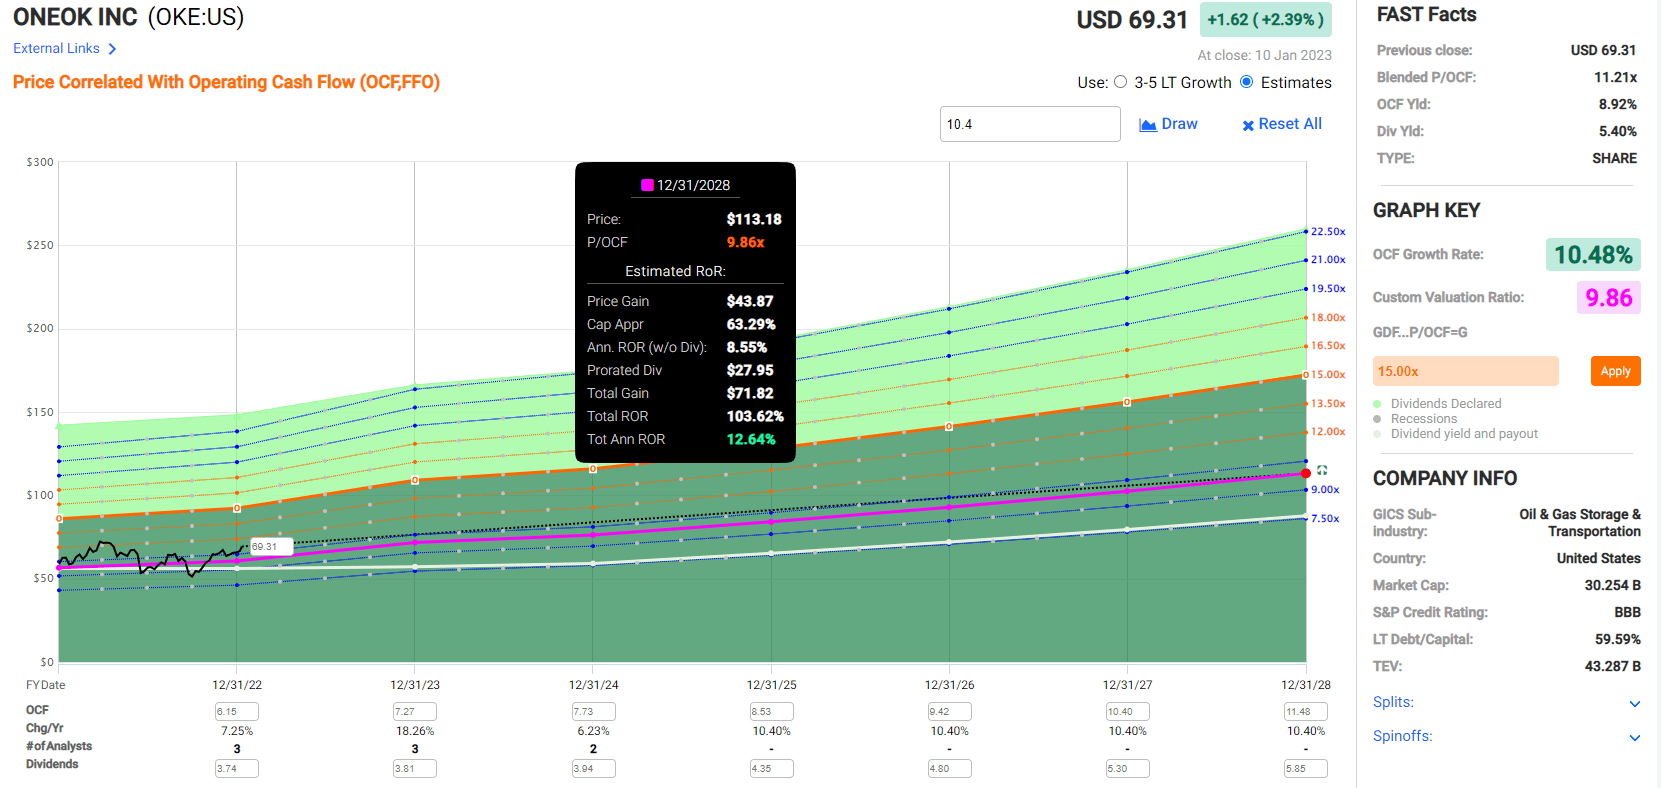
Those buying OKE today can reasonably expect to potentially double their money in five years, enjoying 12% to 13% annual returns. The five-year consensus return potential range is 9% to 19% CAGR.
- About 2.5X more than the S&P 500
ONEOK Investment Decision Score
Dividend Kings Automated Investment Decision Tool 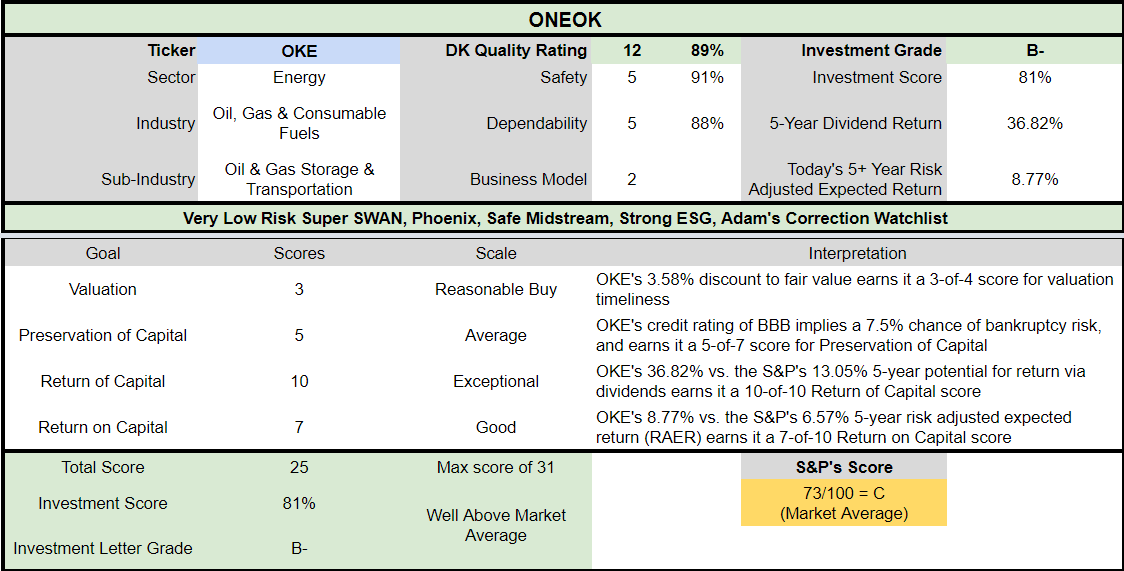
OKE is a potentially good high-yield opportunity for anyone comfortable with its risk profile. Look at how it compares to the S&P 500.
- 4% discount to fair value vs. 1% premium S&P = 5% better valuation
- 5.4% potentially very safe yield vs. 1.7% (3X higher and potentially safer)
- approximately 15.8% long-term annual return potential vs. 10.2% CAGR S&P
- about 33% higher risk-adjusted expected returns
- 3X higher income potential over five years
Risk Profile: Why ONEOK Isn’t Right For Everyone
There are no risk-free companies, and no company is right for everyone. You have to be comfortable with the fundamental risk profile.
ONEOK Risk Profile Summary
- high reliance on natural gas liquids: 50% of cash flow and the core growth driver
- if global NGL demand growth slows, OKE’s total return potential could fall significantly
- relatively higher commodity sensitivity than more utility-like peers such as ENB
- interest rate risk: if borrowing costs rise high enough, fast enough, its growth could underperform current expectations
- regulatory risk: certain assets are exposed to potential volume losses from the Dakota Access Pipeline
- project execution risk: completing projects on time and on budget isn’t easy if it faces lawsuits from environmentalists
- green energy transition risk: OKE has 20 to 40 years to replace fossil fuel revenue with alternative revenue sources
- industrial accident risk: oil spills can cost up to $1 billion to clean up
How do we quantify, monitor, and track such a complex risk profile? By doing what big institutions do.
Long-Term Risk Management Analysis: How Large Institutions Measure Total Risk Management
DK uses S&P Global’s global long-term risk-management ratings for our risk rating.
- S&P has spent over 20 years perfecting their risk model
- which is based on over 30 major risk categories, over 130 subcategories, and 1,000 individual metrics
- 50% of metrics are industry specific
- this risk rating has been included in every credit rating for decades
The DK risk rating is based on the global percentile of how a company’s risk management compares to 8,000 S&P-rated companies covering 90% of the world’s market cap.
OKE scores 89th Percentile On Global Long-Term Risk Management
S&P’s risk management scores factor in things like:
- supply chain management
- crisis management
- cyber-security
- privacy protection
- efficiency
- R&D efficiency
- innovation management
- labor relations
- talent retention
- worker training/skills improvement
- occupational health & safety
- customer relationship management
- business ethics
- climate strategy adaptation
- sustainable agricultural practices
- corporate governance
- brand management
HR’s Long-Term Risk Management Is The 95th Best In The Master List 81st Percentile In The Master List)
| Classification | S&P LT Risk-Management Global Percentile |
Risk-Management Interpretation |
Risk-Management Rating |
| BTI, ILMN, SIEGY, SPGI, WM, CI, CSCO, WMB, SAP, CL | 100 | Exceptional (Top 80 companies in the world) | Very Low Risk |
| ONEOK | 89 |
Very Good, Bordering On Exceptional |
Very Low Risk |
| Strong ESG Stocks | 86 |
Very Good |
Very Low Risk |
| Foreign Dividend Stocks | 77 |
Good, Bordering On Very Good |
Low Risk |
| Ultra SWANs | 74 | Good | Low Risk |
| Dividend Aristocrats | 67 | Above-Average (Bordering On Good) | Low Risk |
| Low Volatility Stocks | 65 | Above-Average | Low Risk |
| Master List average | 61 | Above-Average | Low Risk |
| Dividend Kings | 60 | Above-Average | Low Risk |
| Hyper-Growth stocks | 59 | Average, Bordering On Above-Average | Medium Risk |
| Dividend Champions | 55 | Average | Medium Risk |
| Monthly Dividend Stocks | 41 | Average | Medium Risk |
(Source: DK Research Terminal)
OKE’s risk-management consensus is in the top 11% of the world’s best blue chips and is similar to:
- 3M (MMM): Ultra SWAN dividend king
- BlackRock (BLK): Ultra SWAN
- Royal Bank of Canada (RY): Ultra SWAN
- Intuit (INTU): Ultra SWAN
- Northrop Grumman (NOC): Ultra SWAN
The bottom line is that all companies have risks, and OKE is very good, bordering on exceptional, at managing theirs, according to S&P.
How We Monitor OKE’s Risk Profile
- 23 analysts
- three credit rating agencies
- 26 experts who collectively know this business better than anyone other than management
- the bond market for real-time fundamental risk assessment
When the facts change, I change my mind. What do you do, sir?” – John Maynard Keynes
There are no sacred cows at iREIT or Dividend Kings. Wherever the fundamentals lead, we always follow. That’s the essence of disciplined financial science, the math behind retiring rich and staying rich in retirement.
Bottom Line: Get Ready To Buy 5.4% Yielding ONEOK If It Sells Off And Your Retirement Will Thank You
Are stocks likely to sell off in the coming weeks? That’s what history and the best available data indicate.
S&P Potential Bear Market Bottoms
| Earnings Decline In 2023 | 2023 S&P Earnings | X 25-Year Average PE Of 16.8 | Decline From Current Level |
| 0% | $217.84 | $3,666.25 | 6.5% |
| 5% | $206.95 | $3,482.93 | 11.1% |
| 10% | $196.06 | $3,299.62 | 15.8% |
| 13% | $189.52 | $3,189.64 | 18.6% |
| 15% | $185.16 | $3,116.31 | 20.5% |
| 20% | $174.27 | $2,933.00 | 25.2% |
(Source: DK S&P 500 Valuation Tool, Bloomberg Blue-Chip Consensus)
During the 2023 recession, earnings are expected to decline by 0% to 20% depending on its severity.
And that’s why the stock market could fall between 7% and 25% more before we finally bottom, most likely sometime in the first half of the year.
OKE is unlikely to go up in a falling market; almost no stocks do.
Let me be clear: I’m NOT calling the bottom in OKE (I’m not a market-timer).
Super SWAN quality does NOT mean “can’t fall hard and fast in a bear market.”
Fundamentals are all that determine safety and quality, and my recommendations.
- over 30+ years, 97% of stock returns are a function of pure fundamentals, not luck
- in the short term; luck is 25X as powerful as fundamentals
- in the long term, fundamentals are 33X as powerful as luck
While I can’t predict the market in the short term, here’s what I can tell you about OKE.
- the industry growth leader
- the 2nd best long-term risk management in midstream (ENB is #1 at 96th percentile global risk management according to S&P)
- a strong balance sheet that’s getting stronger each year
- a potentially safe 5.4% yield with a 1.45% risk of a cut in a severe recession
Take this incredible company, offering nearly 16% long-term return potential and a potentially safe 5.4% yield today, and now imagine what kind of blue-chip bargain it could become.
Imagine a possibly safe 6% or even 7% yield with double-digit growth potential, a strong balance sheet, and 89th-percentile risk management.
That’s the kind of opportunity I love bringing my subscribers and readers because that’s how you can make your own luck on Wall Street.
It’s how you can stop dreaming of a rich retirement and make it a reality.
It’s how retiring a millionaire becomes a matter of time, not luck, no matter what the market throws at us in the future.
Simply put, OKE at fair value or better ($72) is one of the smartest long-term high-yield blue-chip investments you can add to a diversified and prudently risk-managed portfolio.
Be the first to comment