

SeventyFour/iStock via Getty Images
Omega Healthcare Investors, Inc. (NYSE:OHI), incorporated in 1992 and headquartered in Hunt Valley, MD, is a REIT that owns and manages skilled nursing and assisted living facilities (SNFs/ALFs) in the United States.
I believe that investors who are looking for a stable income source should consider some other vehicle because OHI hasn’t performed very well in the past, it is uncertain when the market it serves will recover, and its dividend coverage is currently inadequate.
Additionally, the shares are not trading at a large enough discount to make the risks here worth an investment. However, investors should acknowledge the REIT’s portfolio and liquidity strengths and monitor OHI because a better price may reveal an opportunity.
Portfolio
Based on the last investor presentation released in March, Omega Healthcare has 862 properties spread across 42 states and the U.K. This is mostly concentrated in the West and the U.K.; it has the largest exposure to Texas at 10.4% and the U.K properties account for 6.9% of the REIT’s investments:
Investor Presentation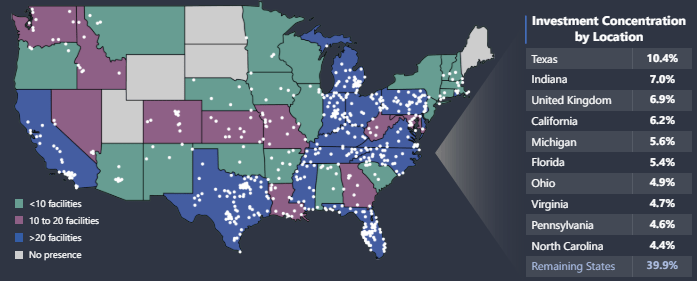
Still, this is a widely diversified portfolio of SNFs and ALFs. Additionally, SNFs account for 71% of the portfolio while the remaining 29% is senior housing:
Investor Presentation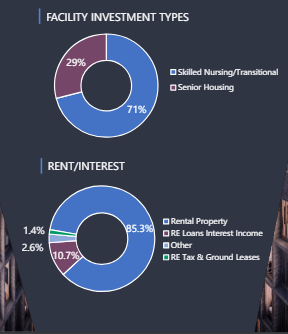
As you can see, the majority of revenue comes from rental income, but there is a significant portion (10.7%) for which RE loan investments are responsible.
What I don’t find as diversified is its tenant base as they have significant exposure to a couple of operators with the biggest one being Communicare at 11%:
Investor Presentation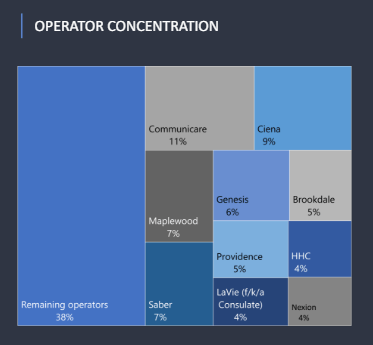
So 10 of its tenants make up the majority of the rental income, which introduces a risk to profitability and should be accounted for by investors.
Performance
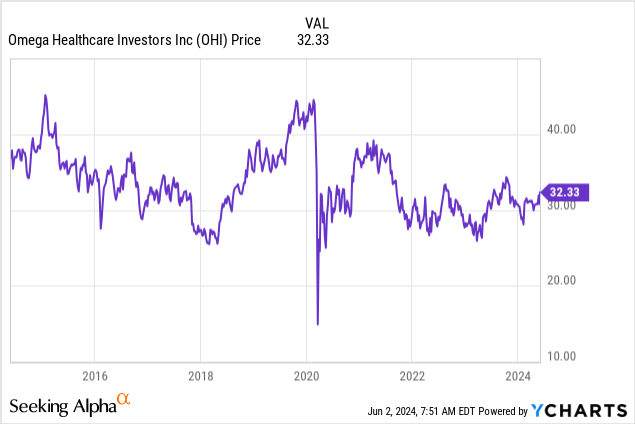
Now, the price performance of OHI has been underwhelming in the last 10 years:
While revenue has had a steady growth, FFO per share hasn’t grown during this period:
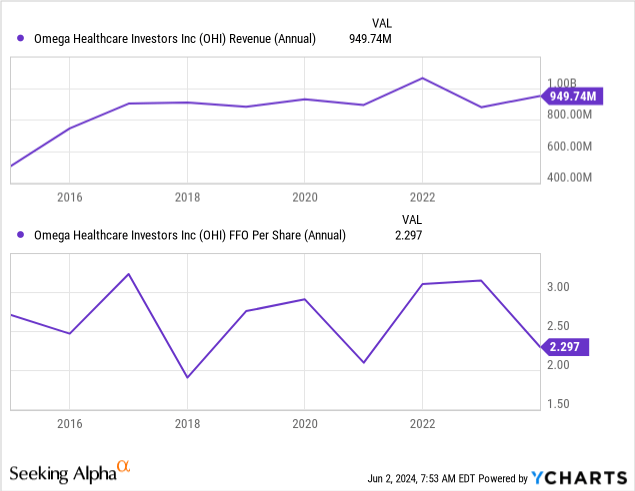
The price performance is therefore not surprising given the volatile nature of FFO. More recent results are not very good either; below I compare the annualized figures taken from the last quarterly report with the average ones from the last 3 fiscal years and, as you can see, rental revenue and cash NOI have remained practically flat, with only AFFO noting some growth:
| Rental Revenue Growth | -0.65% |
| Cash NOI Growth | -0.77% |
| AFFO Growth | 11.25% |
Things look a little bit better when you compare the most recent results with the previous year’s ones, however. Rental revenue increased by 9.29% YoY, interest income surged by 26%, cash NOI increased by 9.59%, and AFFO saw a 3.87% YoY growth.
It’s important to note though that the company has had issues with collecting rent from its tenants recently. Maplewood, one of its biggest tenants, short-paid during the second quarter of 2023 and still hasn’t paid the rent due since then. In the first quarter of 2024, it also short-paid (36.5% of contractual rent wasn’t paid). In 2023, Omega Healthcare applied a security deposit to cover some of the rent that wasn’t paid in 2023, indicating low confidence that Maplewood is going to repay it. This deposit is now exhausted. The REIT has had similar troubles with LaVie, Guardian, and Agemo, although these are not as big contributors to rental revenue as Maplewood.
Further, with 79.1% of its portfolio leased, Omega has a lot of room for improvement. Consider that other healthcare REITs average about 90% these days. On the bright side, the weighted average lease term here is 9.4 years and only 4.4% of leases expire in 2024 and the next 2 years. However, note that 14.4% of them expire in 2027.
Leverage & Liquidity
Its solvency profile is very good, though. Only 55.9% of its assets are funded by debt which consists of a credit facility, secured borrowings, and senior notes as well as other unsecured borrowings. The debt/EBITDA ratio was low at 6.2x based on the last quarterly results; similarly, the interest coverage at 3.7x was also reflective of the REIT’s strong liquidity. Moreover, Omega had about $360 million in cash and equivalents at the end of March which is about 4% of total assets. The debt also weight-averaged an interest rate of 4.38%, which I’d consider very low these days.
Last, the maturity schedule seems good overall, except for the 2025 maturities which amount to 30% of the debt. The rest (up to 2033) are lower than 14% of the debt.
Dividend & Valuation
OHI currently pays a quarterly dividend of $0.67 per share, resulting in a forward yield of 8.28%. While the yield is quite high, I don’t believe it is safe from a cut these days because the payout ratio is 117.91% based on AFFO from the last quarterly report. The REIT needs to make more progress with stabilizing its rental income and FFO to make this carry less weight.
Also, the payment record isn’t very attractive, indicating slow growth:
Seeking Alpha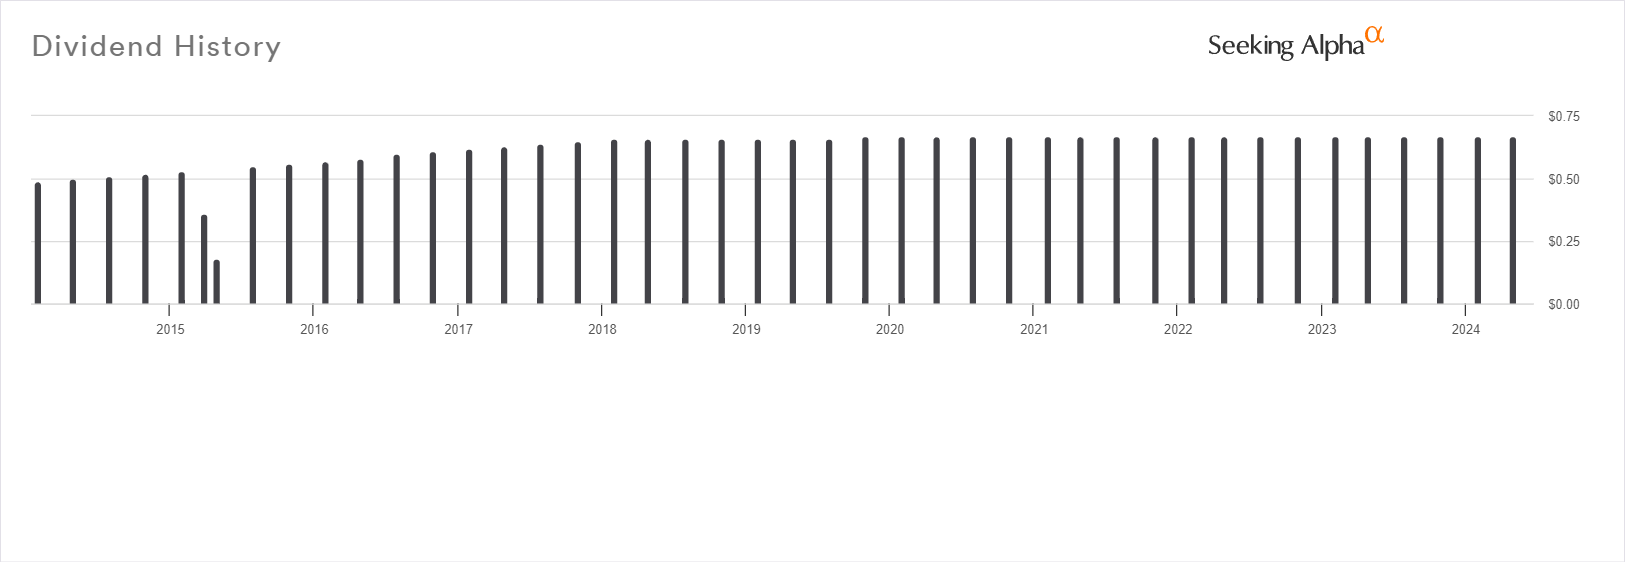
Furthermore, OHI is trading at an implied cap rate of 7.22%, which is higher than the average of 6.75% reported by JLL for the fourth quarter of 2023. Based on the seniors housing average as the more appropriate rate, NAV is currently at $35.35 per share; with the current price at $32.33, the discount suggested here is 8.55%. This seems to be fair considering the risks associated with a potential investment here.
Risks
However, such a discount is unfortunately not large enough to provide investors with a wide enough margin of safety. For this reason, the upside may be limited and that represents an opportunity risk at the least.
The dividend may also be cut and that could increase selling pressure for OHI as many could be holding it as an income vehicle.
Verdict
Therefore, I don’t think that the prospects outweigh the risks here and I’m rating OHI a hold until it is either more clear that the dividend is safe or the price drops significantly to suggest a better upside.
What do you think? Do you own this REIT or did you ever intend to? Let me know. Also, please leave a comment if this article helped you; it means a lot! Thank you for reading.
Be the first to comment