

monkeybusinessimages/iStock via Getty Images
Q2 recap and thesis
Omega Healthcare Investors (NYSE:OHI) reported strong Q2 results last week. Net income came in at $92 million (or $0.38 per common share), an 5.7% improvement from the same period in 2021. AFFO for the quarter dialed in at $185 million (or $0.76 per common share on 243 million shares) beating the consensus estimates and also its Q1 2022 by $0.02. Although the AFFO is lower than the same period last year ($207 million) by about 10%. The financial results continue to face headwinds from nonpayment by a few operators.
Despite these lingering headwinds, overall, I see the negative impacts of the pandemic finally fading in the rearview. The market has lost direction for the stock for close to a year after since late 202. Its stock prices have been trapped in a narrow window between $27.5 to $30 while fundamentals remained stable, which is always a blessing for patient investors. And more specifically, I see Q2 as the turning point for patient investors to start reaping the benefits from improvement in both fundamentals and market sentiments, as detailed next.
OHI and our patience test
As detailed in our free blog article:
The stock market is a place where people with patience trade their patience for money, and people without patience pay money to learn to be patient. It is absolutely true. And we use the so-called consolidate window as a simple test of patience to screen for stock ideas. We’ve had many successes with this test (more than failures anyway) including Lockheed Martin, British American Tobacco, et al.
And now we see OHI as a good example of a stock passing this test after following it for more than 1 year. As you can see from the chart below, its stock price has been trapped in a narrow consolidation window between $27.5 to $30.0 since last September as highlighted in the green box. At the same time, its fundamentals kept improving, a situation we love seeing. Now with the Q2 earnings report, I am seeing signs for the stock to finally break out and these signs include improving operations, stronger AFFO, and capital allocation flexibilities, as to be elaborated on next.
Seeking Alpha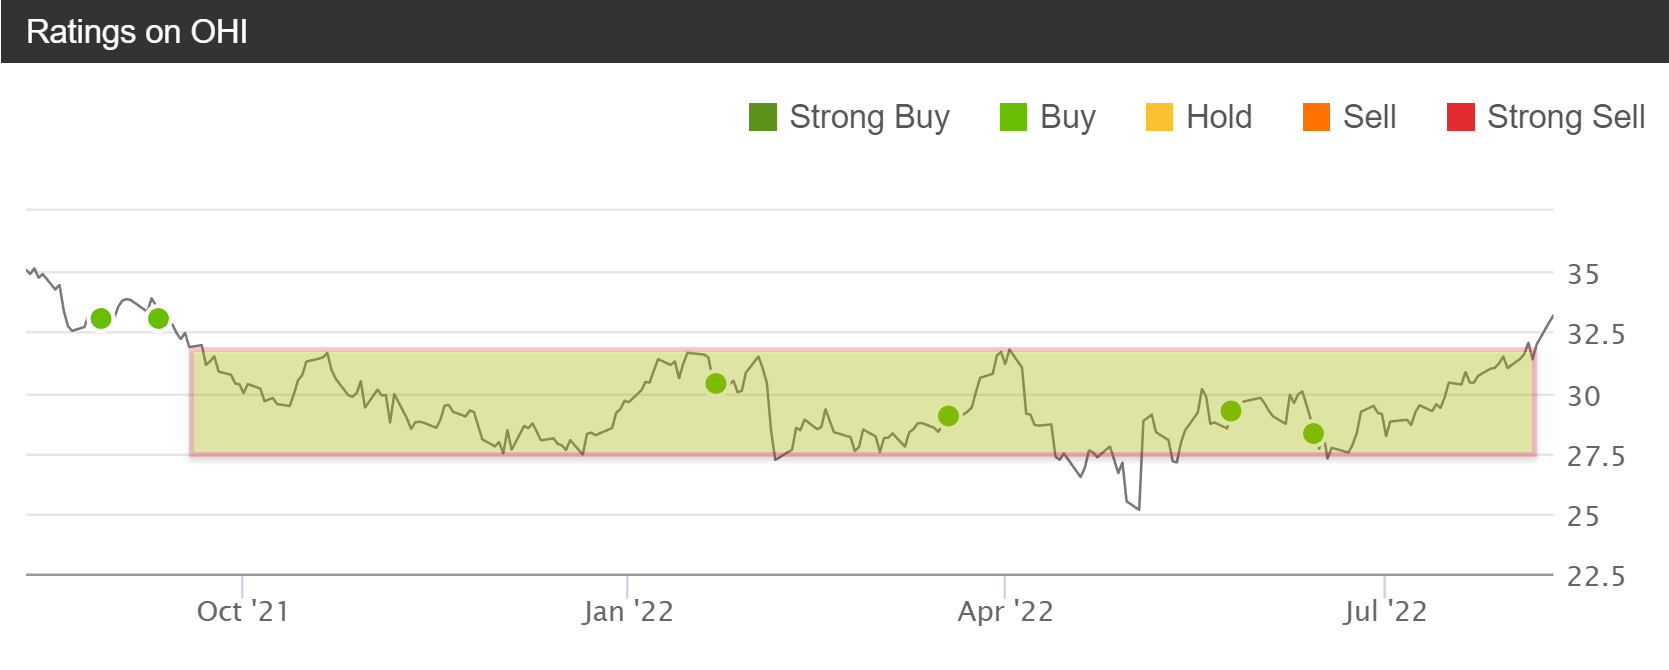
Financial strength and balance sheet management
As of June 30, OHI has about $165 million of cash or equivalent on its ledger. Its total liabilities stand at $5.58 billion, almost unchanged from Dec 31, 2021 ($5.53 billion). The debt is well laddered. Overall, the balance sheet stays well managed. As a matter of fact, its financials are strong enough that the firm has enough flexibility to engage in share buybacks as CFO Bob Stephenson commented during the ER (abridged and emphases added by me):
Moving to our balance sheet. It remains strong, thanks to the steps we’ve taken throughout 2021 and the first half of 2022 to further improve our liquidity, capital stack maturity ladder and overall cost of debt. In the second quarter, we repurchased 4.2 million shares of our common stock for $115 million while maintaining our first quarter leverage ratio. At June 30, we had $38 million of outstanding borrowings on our revolving credit facility, and we also had $165 million in cash…. At June 30, 98% of our $5.4 billion in debt was fixed, and our net funded debt to adjusted annualized EBITDA was 5.3x, the same as our first quarter, and our fixed charge coverage ratio was 4.2x.
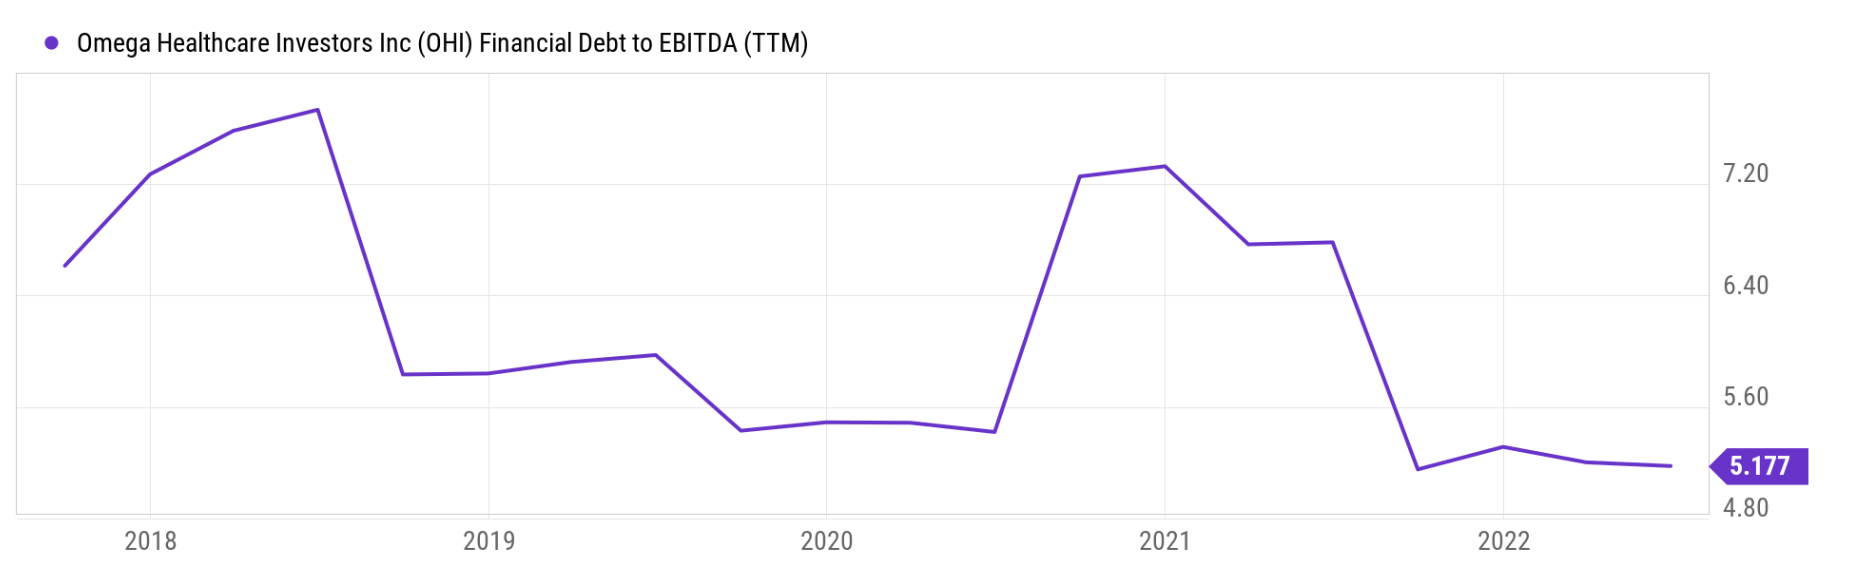
To put the financial strength under perspective, the second chart below shows its historical leverage ratio (i.e., debt to adjusted EBITDA ratio). As you can see, its leverage ratio varied from as low as about 5x to as high as 7.3x. Currently, its leverage of 5.2x is near the lowest level in the past 5 years.
OHI Q2 investor presentation Seeking Alpha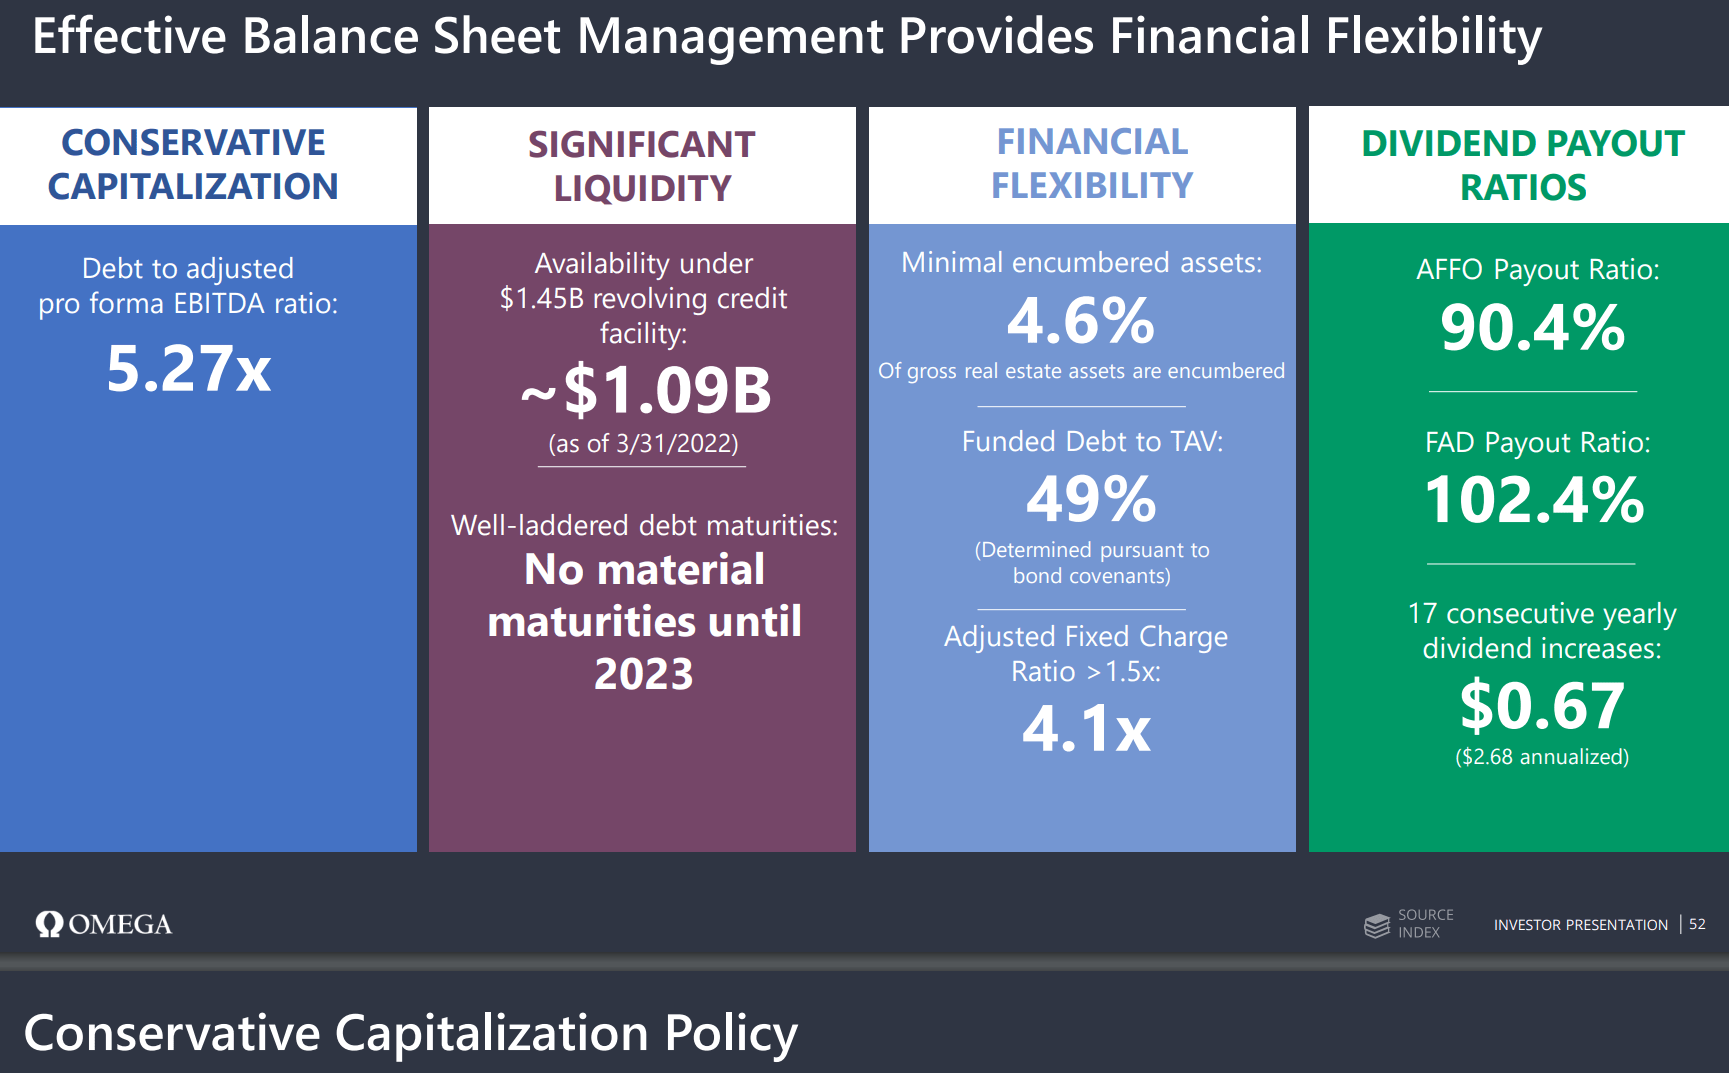
Share repurchases
As just mentioned, the financials are strong enough that the firm started a $500M share repurchase program this year. In Q1, it repurchased 0.981 million shares of its common stock for $27.3 million. And in Q2, the repurchase expanded to 4.2 million shares for $115 million. While its leverage ratio was maintained at a stable (and multiyear low) level.
OHI Q2 earnings press release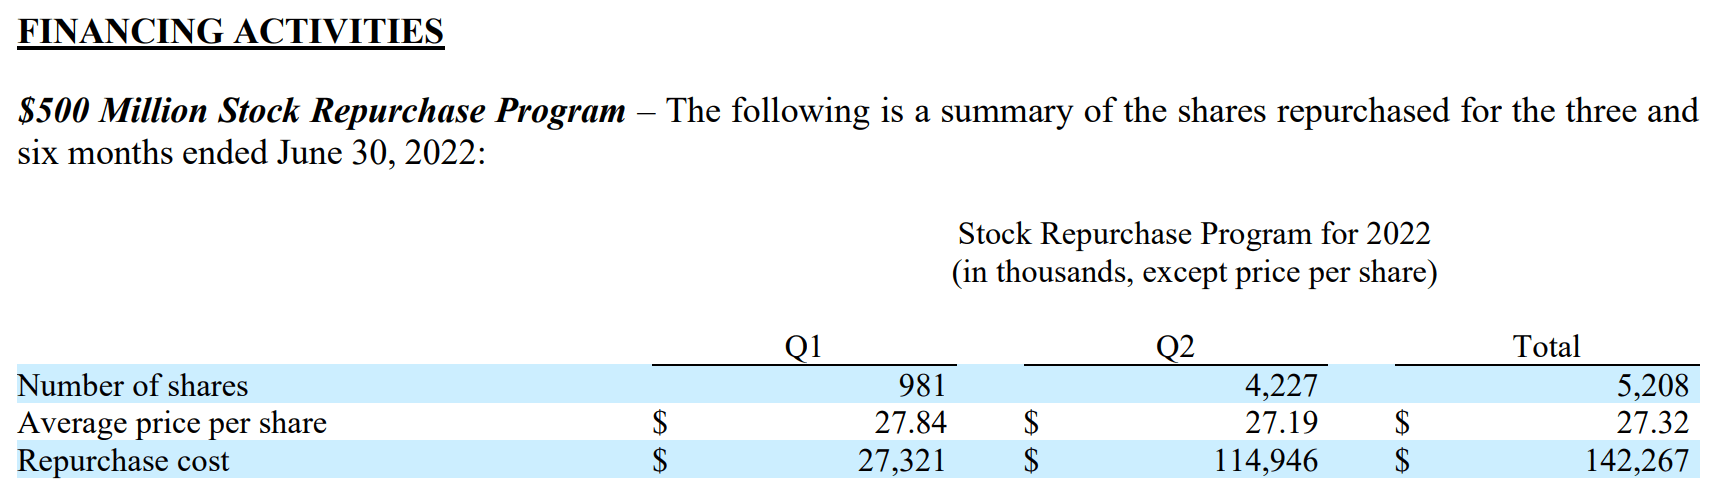
Again, to me, this is a strong sign of the improvement in business fundamentals. As you can see from the top panel of the following chart, the firm has been a net issuer of equity in the past, especially during 2021 when it issued more than $300M of new equity. As a result, as you can see from the bottom panel, its share counts have been continuously diluted. The diluted weighted average shares outstanding was 206.8M shares in 2017 and reached 246.1M by end of 2021, an annual dilution of about 4.4%. Now as its financials improve, investors can finally expect the trend to reverse.
Seeking Alpha
Return projections
Based on the above analysis of the business fundamental, it is relatively straightforward to project the return in the next few years. Here let’s consider a conservative scenario assuming the following return drivers:
1. a modest 2% growth rate – essentially only considering inflation adjustment
2. 1.25% share repurchases. This is based on its current $500M repurchase program, its current market cap, and the assumption that the program spreads out over 5 years.
3. Dividend on the current 8% level (assuming dividend increase would keep the dividend yield approximately at the current level).
4. No change in valuation multiples.
Based on the above return drivers, the annual return should be in double-digits, around 11.3% a year.
Author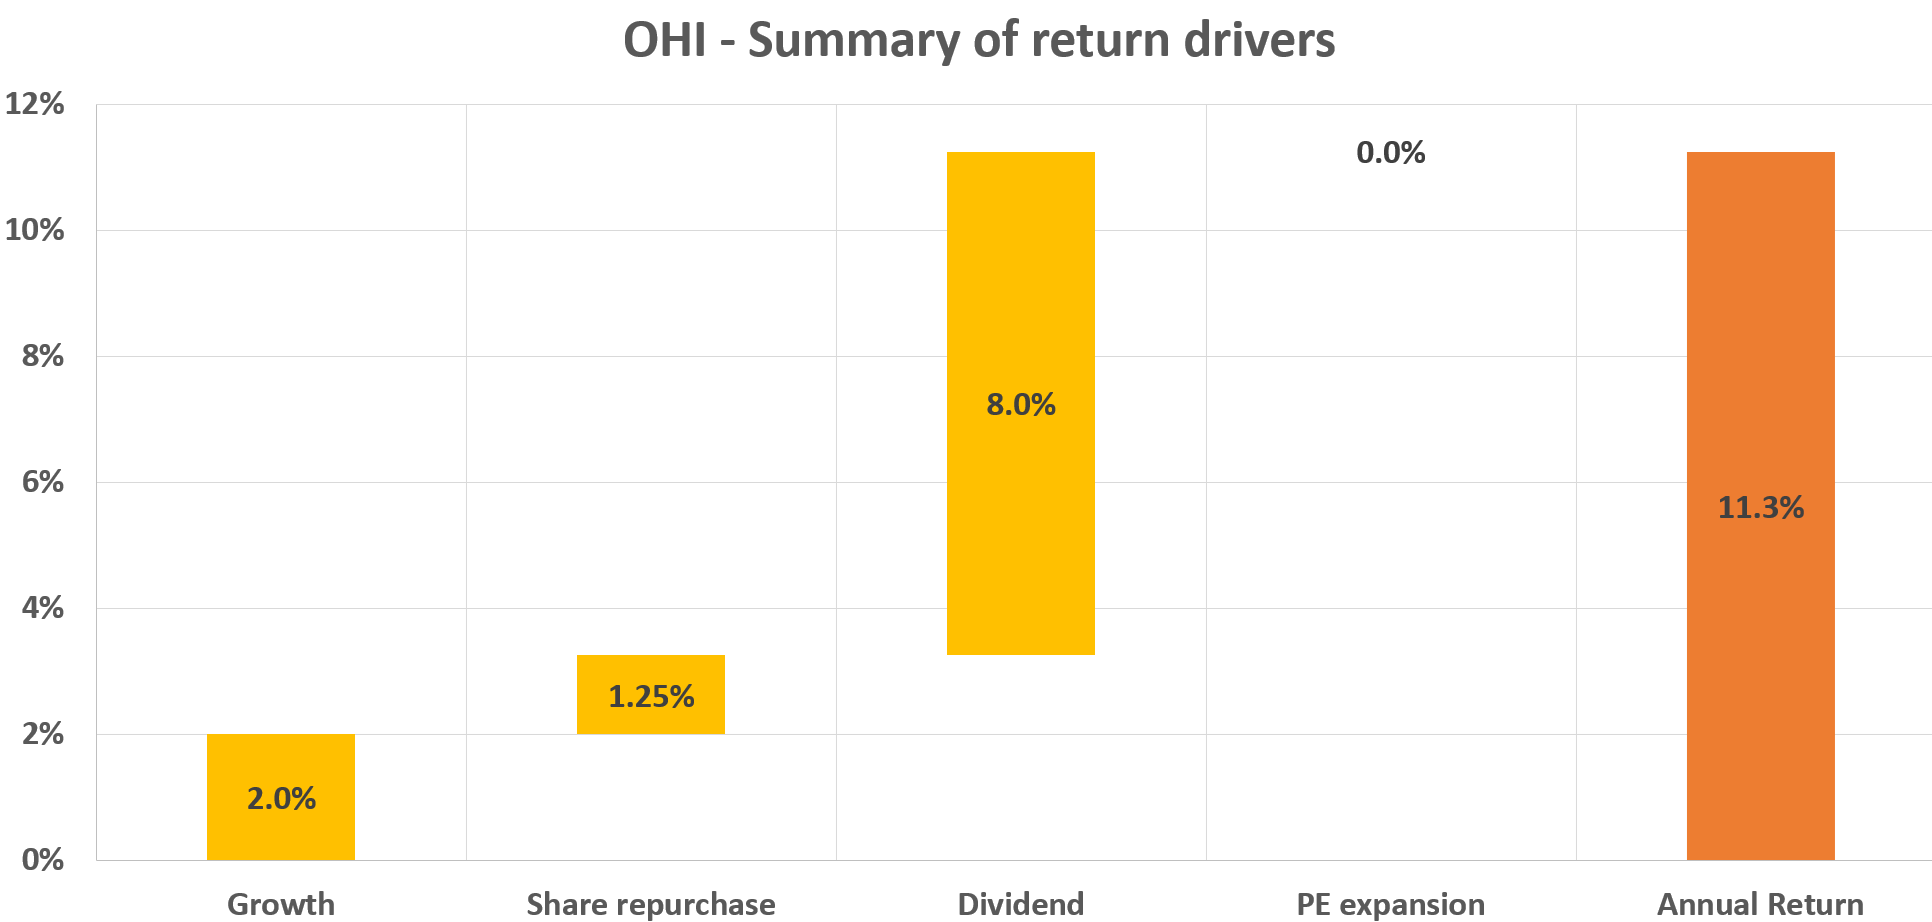
Final thoughts and risks
Finally, a word about the last assumption regarding its valuation multiples. I feel it should be in the ballpark. And if inaccuracies occur, it should err on the side of caution. As you can see from the chart below, its P/CFO multiples have been on average 12.0x in the long term. Its current P/CFO multiple is 12.6x on a TTM basis, essentially on par with its average. While in terms of FW earnings, its P/CFO ratio is only 11.2x (assuming $2.94 of AFFO per share based on the consensus estimates from Seeking Alpha).
Seeking Alpha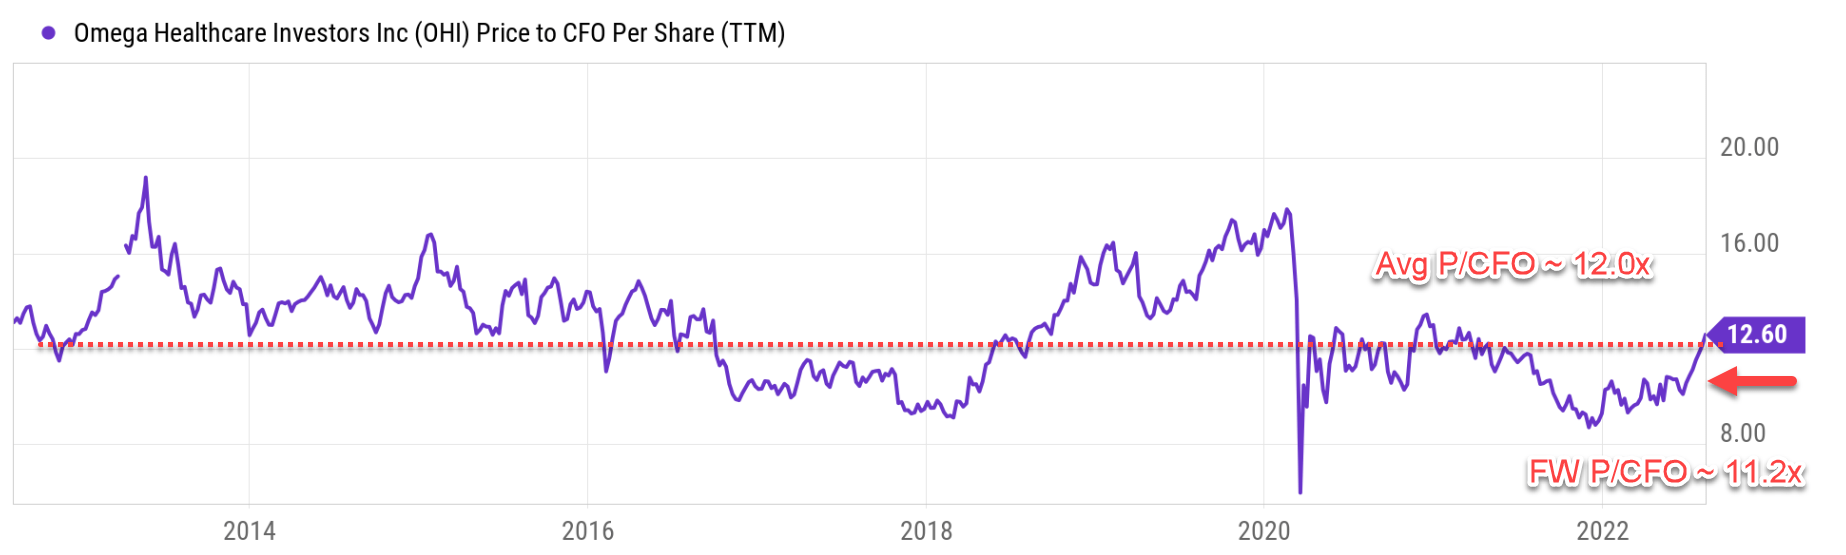
Finally, risks. Besides macroscopic risk (e.g., a recession), OHI still faces some lingering issues with some operators having trouble paying their rents. For example, in January 2022, an operator (representing 3.4% of its Q1 2022 rent) failed to pay its first quarter due. Similar issues are expected to persist as CEO Taylor Pickett commented (abridged and emphases added by me):
…Q2 saw sequential improvement in both Adjusted FFO and FAD, as some restructured operators returned to paying their contractual rent obligations. However, our financial results continue to be impacted by nonpayment of rent by a few operators and, with both facility occupancy and profitability still meaningfully below pre-pandemic levels, the risk of further operator issues remains.
Be the first to comment