

jetcityimage
At the moment I consider Ollie’s Bargain Outlet Holdings (NASDAQ:OLLI) to be a hold. The company had a tough year during 2021/2022, nonetheless, it was able to produce profitable results and albeit weak, it managed to finish with a positive free cash flow (FCF). The company saw its margins deteriorate along with bigger-than-usual inventory cash outflows, which did not compare well to the significant and positive growth it had during 2020/2021. If the company’s management can steer OLLI back to a 40% gross margin and 10% net profit margin, I believe we could start seeing OLLI with higher free cash flows and back to its growth path. The picture would then change as OLLI would enjoy excess cash (similar to what happened during 2020/2021) which it would have to deploy through share buybacks, dividends or funding accelerated growth.
What does OLLI do?
Ollie’s Bargain Outlet Holdings is a chain of discount retail stores with 462 locations (as of Oct-22) across 29 states in the United States. With the motto “Good stuff cheap” OLLI offers its customers a treasure hunt feeling by offering products up to 70% below department and specialty stores. This deal-driven philosophy creates a sense of urgency which leads to customers wanting to take advantage of opportunities that may not be there in the near future and spending more than anticipated. The business model has proven successful for 40 years, with growth since its foundation in 1982. In 2010 the company achieved its 100th store opening, this number would be doubled 5 years later and more than quadrupled by 2022 when it opened its 450th store. The driver of this growth comes from the economics of OLLI’s stores, with a $1m ($250k capex) initial investment the company is able to recoup its money in ~2 years. This enables the company to turn a profit and expand with new stores with its own capital.
Profitability Machine
Let’s start with the basics. OLLI’s balance sheet is the forte of its castle. With essentially no debt, the company’s current assets ($724m) comfortably cover total liabilities ($687m) as of Q2 2022. Additionally, the company enjoys a strong liquidity position with $218m in cash and equivalents (management targets a cash position of ~$200m), which gives the company flexibility and enough firepower to fund growth, repurchase shares, etc.
Such a strong balance sheet is propelled by the profitability machine OLLI is. Since the company went public, OLLI has turned a profit every year. This profit is driven by its opportunistic buying from retailers and manufacturers which consequently leaves the company with a 40% gross margin (which is what management consistently aims to hit every quarter). This opportunistic buying comes about by taking advantage of imbalances in retailers’ demand and manufacturers’ supply. In case of a surplus, manufacturers need to make up for the costs associated with the goods, as such they sell at a deep discount. OLLI is able to find opportunities in these pockets.
Going back to the financials, OLLI has a relatively low SG&A (approx. ~25% of total sales) which is optimized by growth, hence as the company grows the percentage should shrink. Further to this, OLLI has low depreciation and amortization and no interest payments which have led the company to achieve a double-digit profit margin since 2018 (Profit margin decreased to 9% in 2022). The beauty of OLLI’s financials is the high free cash flow conversion it has historically been able to achieve. As capital expenditures only account for less than 3% of revenues, the company is able to transfer most of its profits into its balance sheet. Please see below the historical performance of OLLI since it went public.
Finally, it should be noted that OLLI strives during recessions or difficult economic environments. As an OLLI former chief financial officer, Jay Stasz said during an investor call: “We feel like recession resistant. In 2008, we had about a flat comp. We did see people kind of trading down to maybe try Ollie’s. And then what we realized in 2009 is that those people stuck around, and we had a strong comp. Our comp was about 7.9% positive in 2009.”. More recently, during the pandemic, consumers turned to OLLI driving same stores sales up by 53% and 15% in the second and third quarters, respectively. However, the company had a tough time dealing with supply chain disruptions and higher inventory levels during 2021/2022. OLLI’s cash flow was significantly impacted by changes in inventory with usual levels around the $20m to $40m mark, however, during 2021/2022 the inventory cash outflows stood at $114m. This left most of the cash flow dry. OLLI was still able to produce a FCF of $10m. Not what we like to see but for sure not a bad result during a difficult market environment.
Historical Performance (Capital IQ and Annual Reports)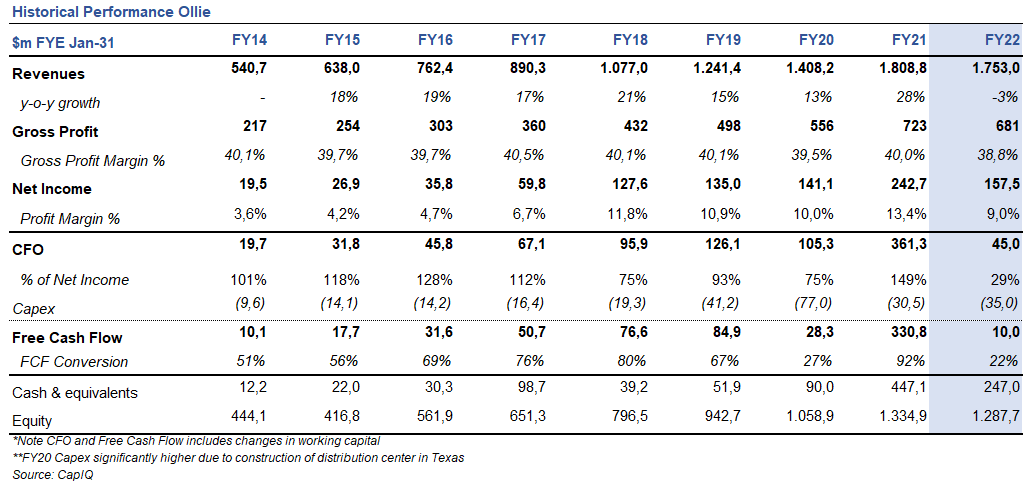
What drives profitability? OLLI’s Army, may be OLLI’s hidden MOAT
OLLI is not a membership store, nonetheless, it offers customers the opportunity to join the OLLI Army in order to receive extra perks like discounts, events, etc. The OLLI Army has been of great success, evidenced by its significant growth since 2006 when it had around 500k members, this number has ballooned to a whopping 11.6 million members as of 2020 (not bad for a discount retail store). Why is this number important? Well, OLLI Army members spend approx. ~40% more in each store visit than non-OLLI members.
It is also important to note here the incremental percentage of sales the OLLI’s Army has come to account for, in 2014 OLLI’s Army accounted for 55% of total revenues, this number increased to 70% by 2017 and north of 80% in 2022. We can derive from these numbers that OLLI’s Army members are fervent loyalists of the company. Now, in order to be an OLLI Army member, the person must have bought in the store in the last 24 months, from this the company records a ~95% retention ratio. But why are these members so loyal? Well as mentioned earlier OLLI offers a steep discount (up to 70%) in many of its products. An analyst at KeyBanc, put these claims to a test, comparing the prices of 32 items from OLLI with their prices on Amazon. He found that one, The Beloved Christmas Quilt, a paperback, was more than 70% less. Eight were 60% to 67% off, and OLLI on average was 42% cheaper. Talk about cheap!
But how can OLLI keep increasing its MOAT? Well, OLLI’s MOAT is a combination of its ability to grow which enables the company to take advantage of bigger and better deals, and the ability of the company to offer these buying opportunities to its OLLI army loyalists. Given manufacturers and retailers need to unload excess inventory in a single deal, OLLI’s growth and ability to pick more and better deals will enable it to present a better offering to customers.
We like runways and OLLI has a long runway ahead
Even though OLLI has experienced significant growth in the last 12 years (going from 100 stores in 2010 to +450 stores in 2022), the company still has a long runway for growth. OLLI has a presence in 29 states yet, it has 10 or fewer stores in 13 states. It opened its third distribution center located in Texas just two years ago in 2020 and is still growing at a moderate pace with ~45 store openings per year. Management has presented a study that suggests OLLI could open 1,050 stores across the U.S., which still gives the company the room to almost triple its store count. This does seem achievable as the company has increased store openings year after year, for example in 2015 the company opened 27 stores, fast forward 5 years to 2021 and the number has grown to 46 store openings per year.
Management has mentioned the company will keep growing at a moderate rate, yet just by historical numbers, store openings per year should keep increasing as the company gets bigger. It is important to highlight OLLI’s cash balances as of the end of Q2 2022, with $218m in cash the company has no problem funding its own growth.
Peers
Peer Comparison (Annual reports)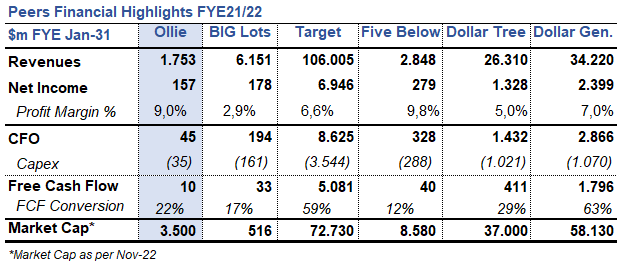
The discount retail industry is comprised of big and small players with somewhat different business models. The big players include Target (TGT), Dollar Tree (DLTR), and Dollar General (DG). These are massive companies one can find everywhere in the United States. Although these are industry peers, OLLI is not really a relevant competitor to them just because of the size difference. On the other hand, you have Big Lots (BIG) and Five Below (FIVE). Big Lots is going through a rough patch, while Five Below is thriving and has increased its net profit margin compared to previous years. During 2021/2022, OLLI did not compare well to its peer, however, it is worth pointing out that OLLI’s net profit margin is the second best of the group. If management can get margins back on track and at similar levels to the previous 3 years, we could see a much different picture with OLLI leading most financial metrics.
Risks
E-commerce is a threat to all retailers, OLLI has not entered the e-commerce realm as management believes it is almost impossible to replicate what they do in online stores. However, in a fast-paced changing world, this is always a risk.
Along with many companies, OLLI had a difficult time managing inventory levels during the past quarters. It is important for management to learn from these lessons and become more efficient, so that next time they are better prepared and able to keep cash flows intact.
OLLI could turn to more aggressive financial policies like for example the issuance of debt. Should management add leverage to the company we would see a completely different picture. Nonetheless, the company has not incurred debt since it went public as such it is not expected to do so.
The Bottom Line:
OLLI is able to generate significant FCF which is expected to grow in line with its store count each year. Even though OLLI did not perform well during the previous quarters, investors should look at this from the bigger picture. The company will keep increasing its store count and this will have a snowball effect which will see its free cash flow increase year after year. Management will have to deploy the cash in excess in some manner. This deployment will most probably be by share buybacks, dividends, or funding growth. The combination of steady growth in earnings per share with a more aggressive share buyback program could help OLLI enhance its EPS or start paying attractive dividends.
However, the company currently has weaker fundamentals than in previous years, the gross margin has dipped below 40% and the profit margin is no longer above 10%. This has been caused by higher inventory levels which impact both the income statement through the cost of goods sold and the cash flow statement through changes in inventory. In the previous quarter, OLLI showed an improvement with changes in inventory, however gross margin decreased to 31%, so it remains to be seen if it can turn back to its previous levels. This is why I am still not convinced about OLLI, financials need to show improvement before it can become an interesting stock to buy.
Be the first to comment