

Susan Vineyard/iStock via Getty Images
The ProShares K-1 Free Crude Oil Strategy ETF (BATS:OILK), the “Fund,” is an exchange traded fund (“ETF”) that provides exposure to the crude oil futures market to investors without them having to manage a futures market account. Futures market accounts require close monitoring and meeting margin requirements. It also does not issue a K-1 form, streamlining tax reporting.
The investment objective of the Fund is to track the performance of the Bloomberg Commodity Balanced WTI Crude Oil Index (the “Index”) before fees and expenses.
The Fund charges an expense ratio of 0.67% and has assets under management of about $54 million.
Seeking Alpha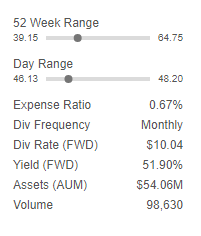
Seeking Alpha has graded the expense ratio a “D+”.
Seeking Alpha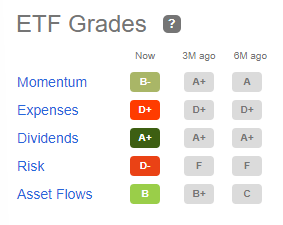
The most recently published holdings of OILK are listed below by ProShares.
ProShares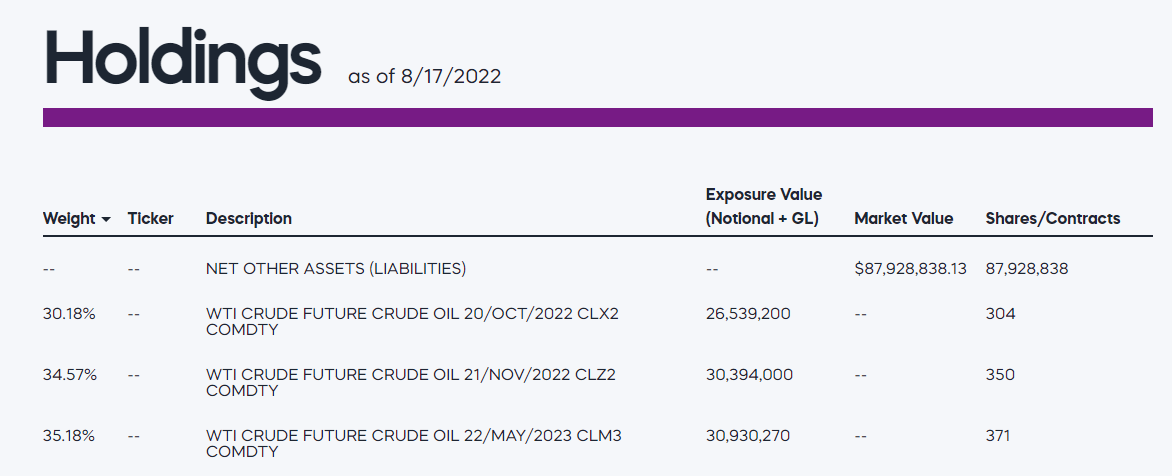
The Index
The underlying Bloomberg Index is actually a fairly complex calculation involving three separate schedules of NYMEX crude oil futures contracts and is generally described below. A more detailed calculation of the Index Methodology is provided here.
ProShares states:
ProShares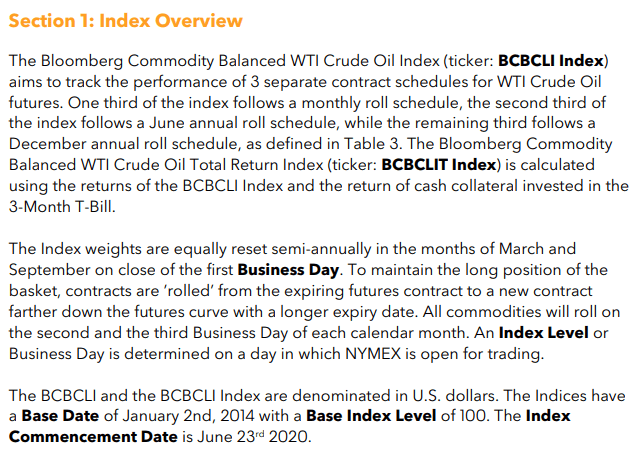
It is noteworthy that the Index was first published on June 23, 2020. That’s because it was shortly after the unprecedented event when the nearby or prompt NYMEX crude future price fell below zero on April 20, 2020, closing at -$37.63/bbl. That means sellers had to PAY buyers to take their oil.
NYMEX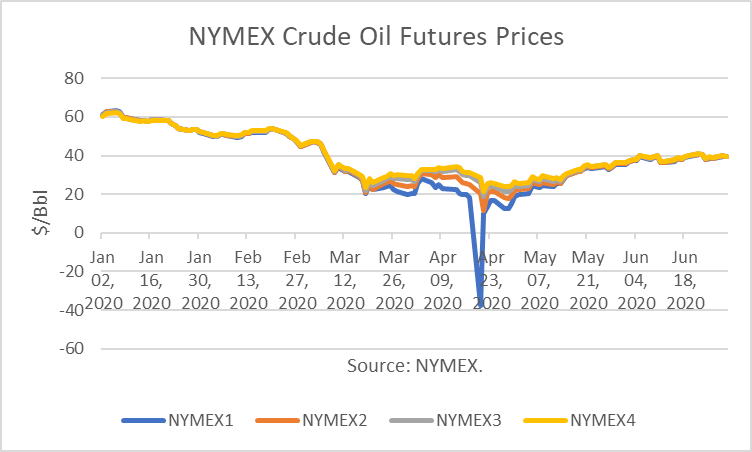
That was due to an oil storage containment problem at Cushing, Oklahoma, the delivery location for the futures contract. As indicated above, the prices of the next three delivery months did not drop below $0/bbl.
Crude oil inventories or stocks in the Midwest, defined as PADD 2 by the Energy Information Administration, had reached storage capacity, and so buyers taking delivery of the oil had to have had storage available. That rules out typical speculators who do not take delivery but rather close contracts prior to expiration.
EIA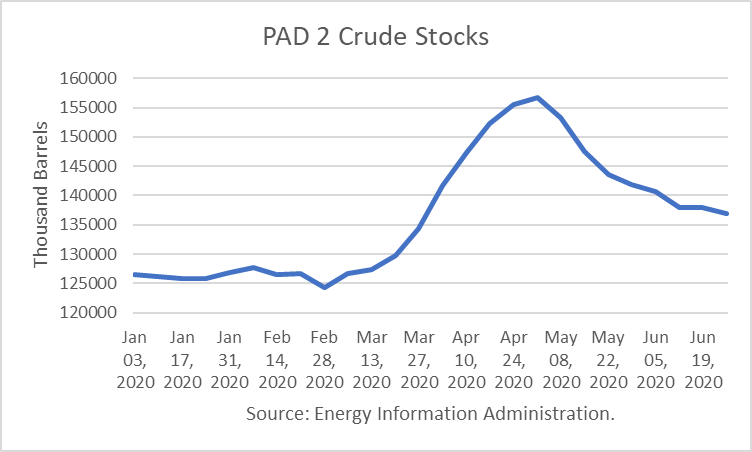
The storage build was due to the oil price war initiated between Saudi Arabia and Russia over production quotas, which drove oil prices into a collapse and created an incentive for buyers to store oil at cheap prices. Tanker rates also spiked higher as traders chartered “floating storage” options.
Bloomberg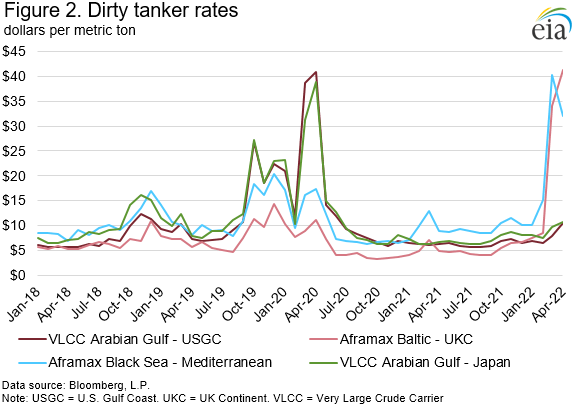
OILK Correlations
In a recent article, it was stated that OILK will “fully capturing the upward trajectory of crude oil.” Prior to April 2020, that used to be the case. However, since June 2020, when the Bloomberg Index Methodology was published, it is not.
I analyzed the correlation between OILK and NYMEX crude oil futures contracts since OILK’s inception at the end of February 2016. The correlation is just 34% to 35% for the full period through April 2022 for the 4 nearby contracts.
|
NYMEX1 |
NYMEX2 |
NYMEX3 |
NYMEX4 |
|
|
OILK |
34% |
34% |
35% |
35% |
BRS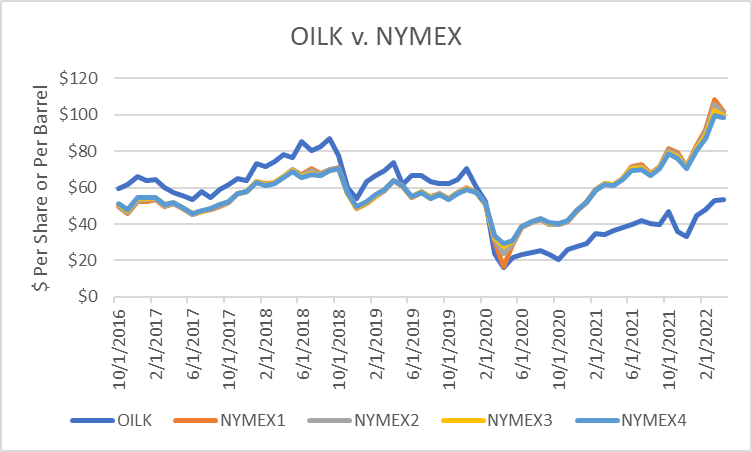
But there is a clear break in the relationship starting around June 2020. When I correlated two time periods (March 2016 to May 2022 and June 2020 to April 2022), I found that each period had strong (95% to 97%) correlations to NYMEX contracts.
|
NYMEX1 |
NYMEX2 |
NYMEX3 |
NYMEX4 |
|
|
OILK |
34% |
34% |
35% |
35% |
|
10/16 to 4/20 |
95% |
95% |
95% |
94% |
|
5/20 to 4/22 |
97% |
97% |
97% |
97% |
Such a result would imply that OILK was based on one index methodology in the early period and another in the latter period, though I could not immediately find any documentation online. A rationale for such a change was the drop in the nearby NYMEX contract to below $0/bbl in April 2020.
The Bloomberg Index is based on deferred futures contracts which would most likely avoid such an event in the future. However, Bloomberg covers its base with the following “Extraordinary” disclosure, should crude oil prices drop to or below $10/bbl.
ProShares
Regression Results
I performed linear regressions between OILK and the next nearby “NYMEX” for the two periods defined above. The r-squared for the first period was 88%, meaning that was the percentage in which the dependent variable (“OILK”) could be explained by the independent variable (“NYMEX”).
The actual monthly average of OILK is plotted below v. the fitted value. The regression model enables the calculation of the fitted value.
Yahoo Finance, BRS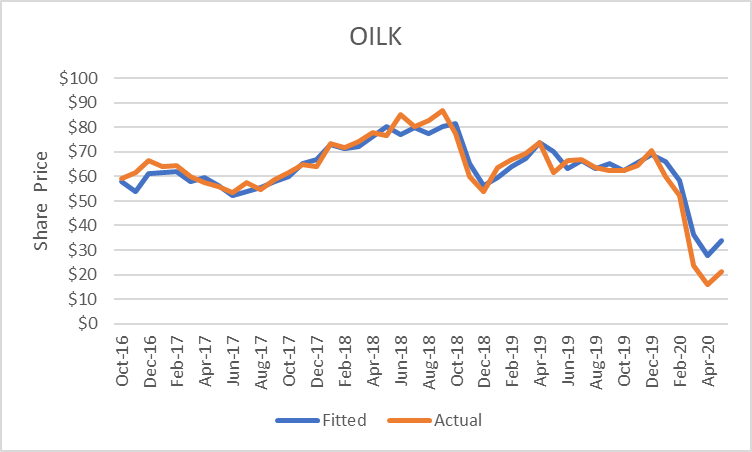
During that period, the coefficient of NYMEX was 1.15. That is the multiplier of the NYMEX price that best fits the actual price.
The r-squared for the regression of OILK v. NYMEX for the latter period (June 2020 to April 2022) was 91 %. I plotted the actual v. fitted values below.
Yahoo Finance, BRS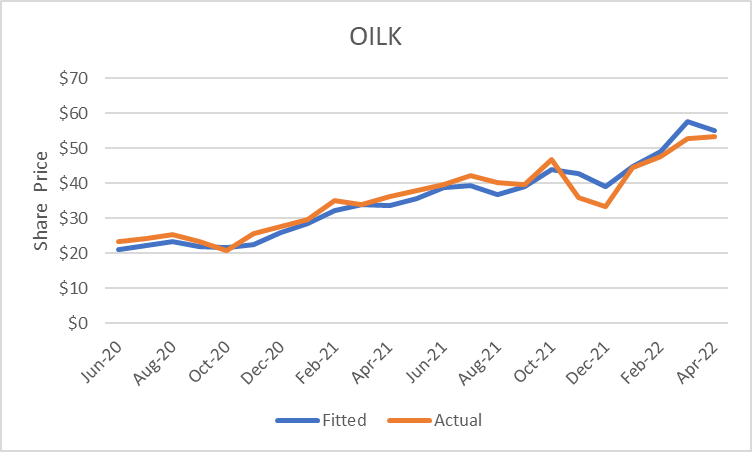
However, the coefficient of NYMEX in that regression was 0.546, less than half of the coefficient in the first regression. That implies that a much larger position (roughly double) would be needed to fully capture “the upward trajectory of crude oil.”
Clearly, OILK’s fund management must have changed to an index methodology that did not involve nearby NYMEX contracts due to the April 2020 fiasco because deferred futures contracts are not as volatile as the nearby contract.
OILK Projections
I used my regression model from the second timeframe and NYMEX closing futures prices on August 17, 2022, to project future values of OILK through December 2023. Crude oil futures prices are in a backwardated market structure, meaning deferred contract prices are below the nearby contract prices. Therefore, the price projection is for lower OILK shares prices based on that methodology.
BRS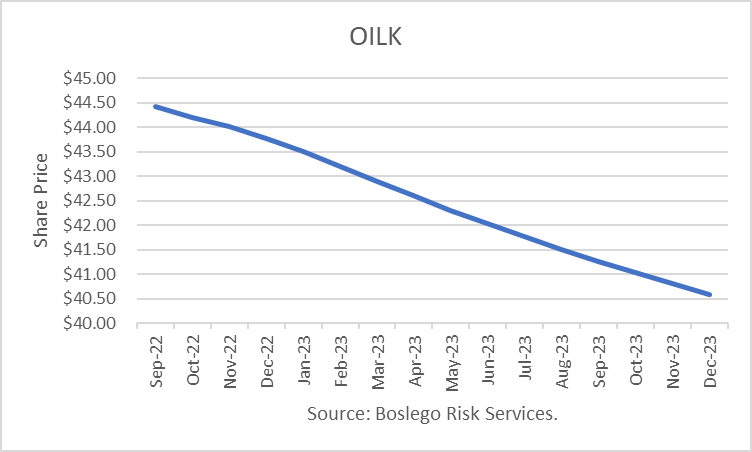
The Energy Information Administration released its Short-Term Energy Outlook for August, and it shows that OECD oil inventories likely peaked at 3.212 billion in July 2020. In July 2022, it estimated stocks rose by 40 million barrels to end at 2.728 billion, 108 million barrels lower than a year ago.
For 2022, OECD inventories are now projected to build by 173 million barrels to 2.810 billion. For 2023 it forecasts that stocks will build by another 17 million barrels to end the year at 2.826 billion.
EIA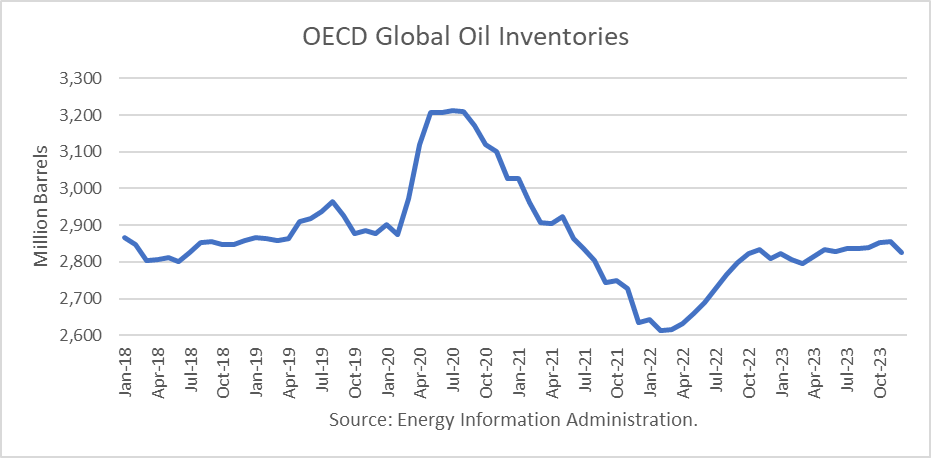
Oil Price Implications
I updated my linear regression between OECD oil inventories and WTI crude oil prices for the period 2010 through 2020. As expected, there are periods where the price deviates greatly from the regression model. But overall, the model provides a reasonably high r-square result of 82 percent.
BRS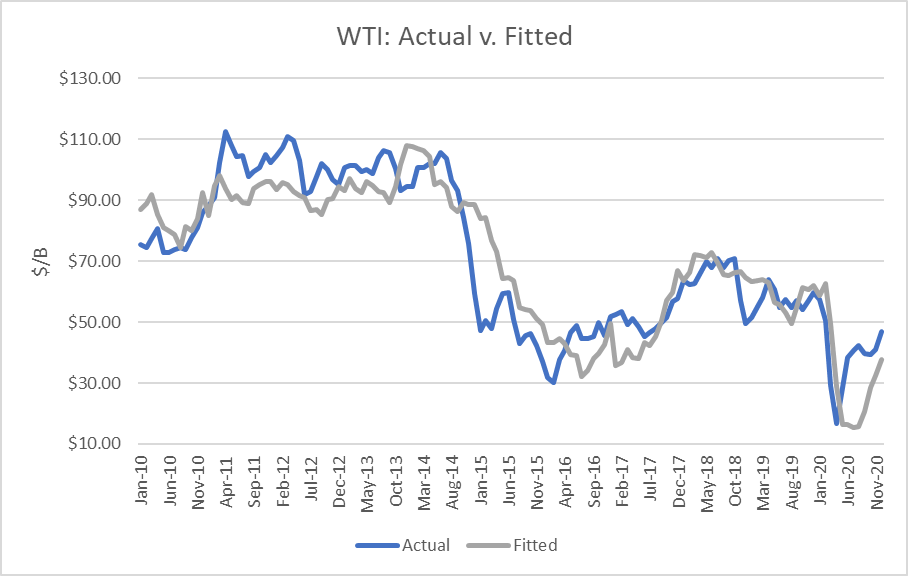
I used the model to assess WTI oil prices for the EIA forecast period through 2022 and 2023 and compared the regression equation forecast to actual NYMEX futures prices as of August 10th and the EIA’s STEO price forecast in August. The result is that oil futures prices and EIA’s assessments are presently overpriced through December 2023, as depicted below.
EIA, NYMEX, BRS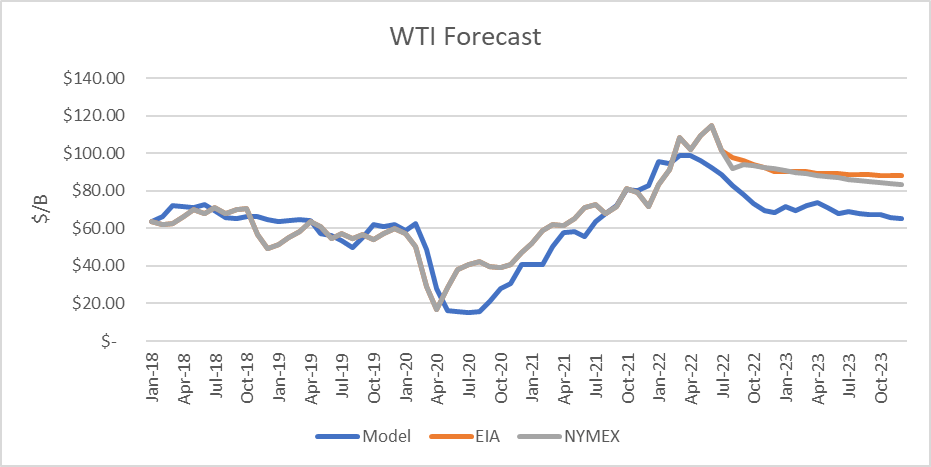
Using the BRS projections above, I forecast the future values of OILK from the regression equation.
BRS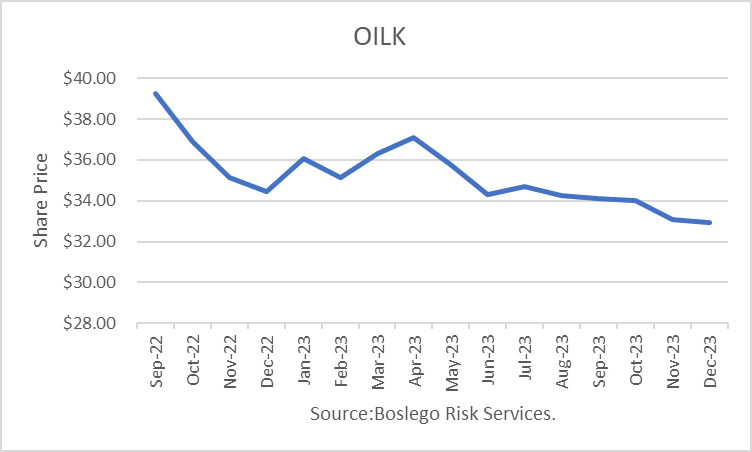
Performance
Since inception in late September 2016, OILK has lost 14.9 %.
BRS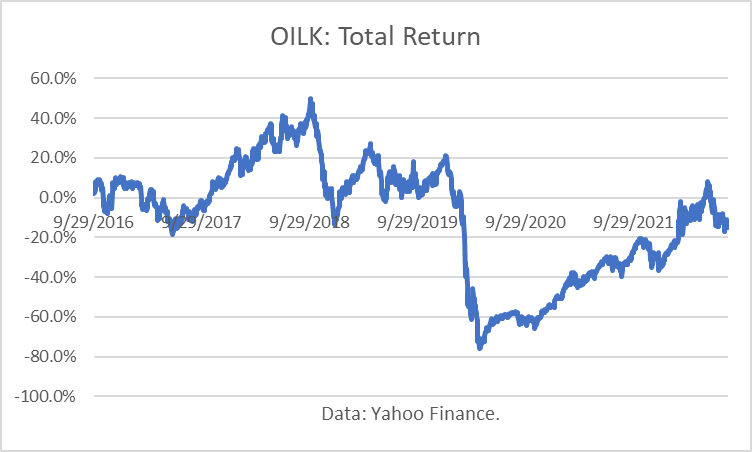
Perhaps even more importantly, OILK has had a Maximum Drawdown of 83.8 %. That should disqualify OILK from consideration as a long-term investment.
BRS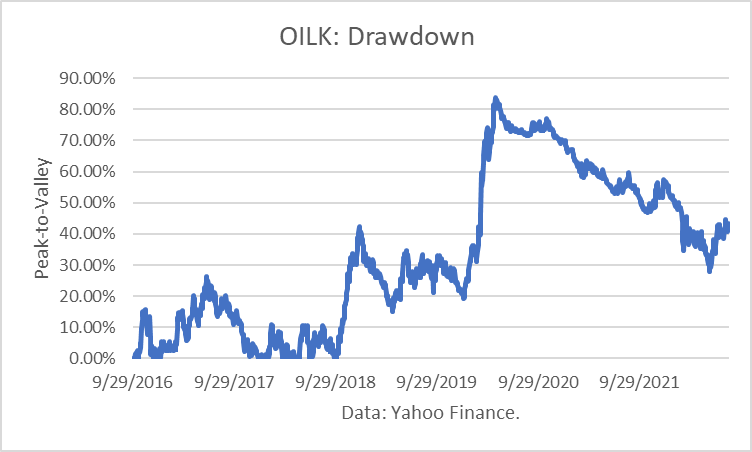
As a short-term investment, OILK has posted a total return of 57.48% over the past year, as of this writing, compared to a loss of 1.17% in the S&P500TR.
Seeking Alpha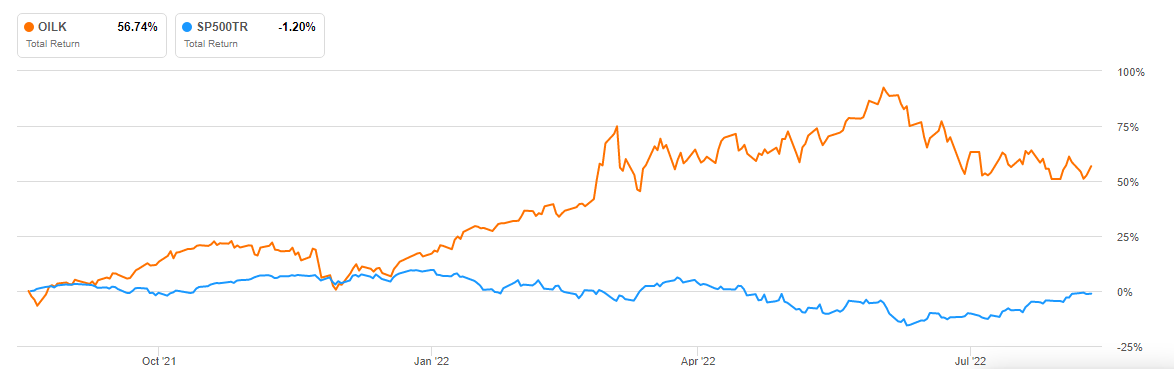
However, a long position in UGA, The United States Gasoline ETF, was up by 74% in the same comparison. I recently published my analysis of that ETF in an article on Seeking Alpha titled, UGA: Making The Long Case With Behavioral Finance.
Seeking Alpha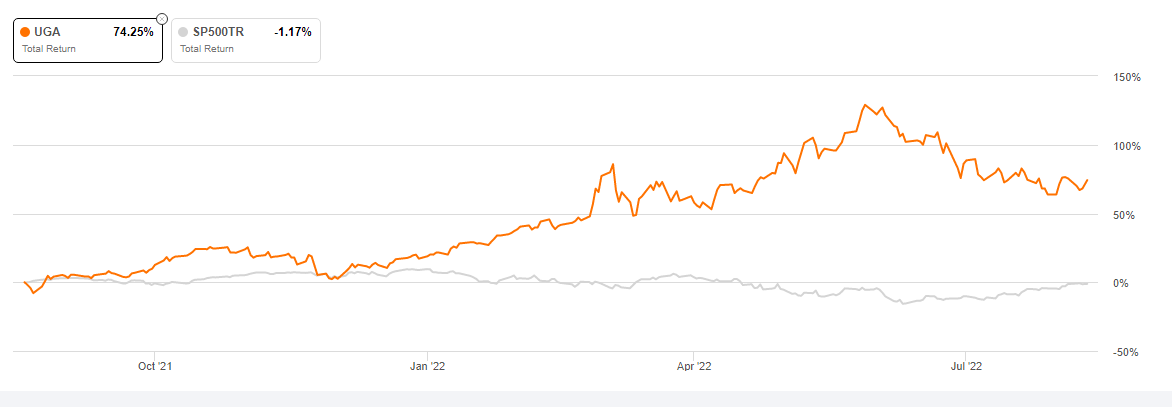
In my Seeking Alpha Marketplace service, Boslego Risk Services (“BRS”) I began reporting on my Model Portfolio of NYMEX energy futures contracts, WTI crude oil (“CL”), RBOB gasoline (“RB”), heating oil (“HO”), and natural gas (“NG”).
I compared my results through August 16th to OILK and the NYMEX CL October contract (“NYMEX”) through August 16th. My BRS result for crude only was +13.3%, as compared to -10.9 % for OILK and -14.9% for October crude.
Yahoo Finance, BRS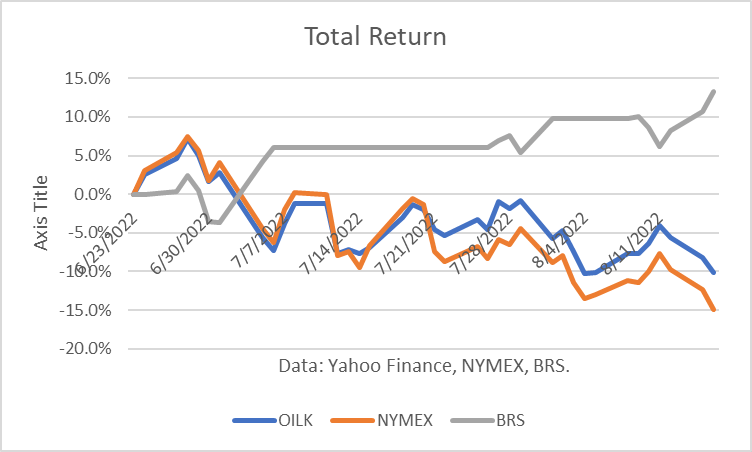
The Maximum Drawdown (“MD”) reflects the largest peak-to-valley drop over the period. For BRS, the MD was 7.5%, whereas OILK was 16.2% and NYMEX was 20.9%.
Yahoo Finance, NYMEX, BRS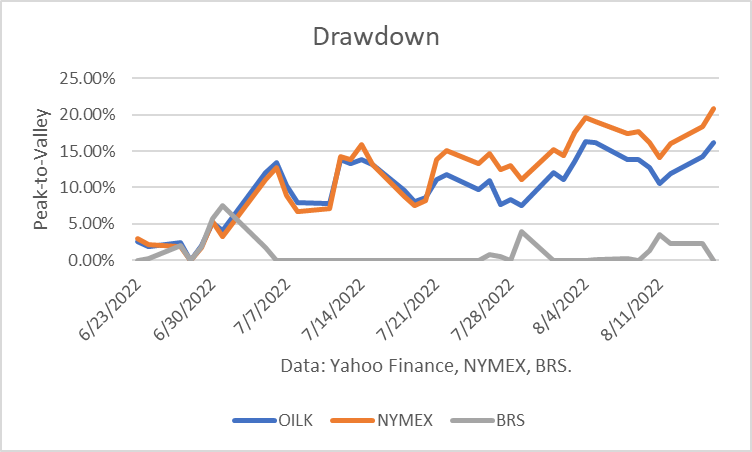
Conclusions
Given NYMEX futures prices and projections from my model, I conclude that OILK is overvalued at the recent price of $48.66/share. However, a risk premium is being priced in, and it may take a few more months for oil prices to drop to the more fairly-valued levels I project.
Be the first to comment