

WTI – US Crude Oil Price Setup:
WTI – US Crude Oil reached a fresh yearly high after catalyzing off of a combination of a reduction in US Crude inventories and the approval of the larger US Fiscal Stimulus package. An increase in demand for the major commodity provided bulls with renewed optimism, allowing them to push through the critical level at 5204.3, formed by the 76.4% Fibonacci retracement level of the 2020 move.

Recommended by Tammy Da Costa
Get Your Free Oil Forecast
WTI – US Crude Oil Monthly Chart

Chart prepared by Tammy Da Costa, IG
Meanwhile, short-term price action remains within the confines of a bullish channel, after bears failed to break below current support, allowing buyers to run with the trend. A break above the upper Bollinger Band, combined with a Commodity Channel Index (CCI) reading of 227, indicates that although the bullish trend has prevailed, prices remain in oversold territory, potentially hindering further gains.
WTI – US Crude Oil Daily Chart

Chart prepared by Tammy Da Costa, IG

Recommended by Tammy Da Costa
Learn the Core Fundamentals of Oil Trading
WTI – US Crude Oil Sentiment
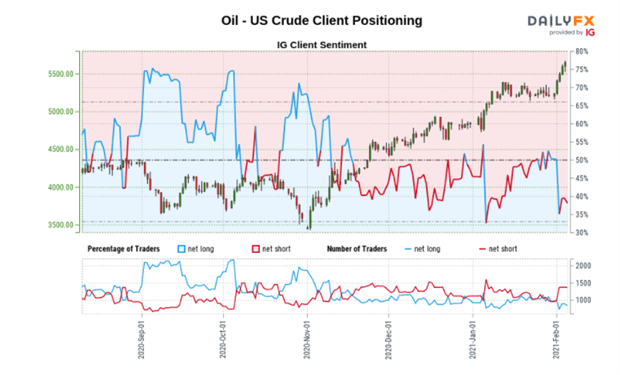
| Change in | Longs | Shorts | OI |
| Daily | -3% | -3% | -3% |
| Weekly | -11% | 36% | 13% |
At the time of writing, retail trader data shows 38.10% of traders are net-long with the ratio of traders short to long at 1.62 to 1. The number of traders net-long is 7.44% lower than yesterday and 8.33% lower from last week, while the number of traders net-short is 6.00% lower than yesterday and 28.60% higher from last week.
We typically take a contrarian view to crowd sentiment, and the fact traders are net-short suggests Oil – US Crude prices may continue to rise.
Traders are further net-short than yesterday and last week, and the combination of current sentiment and recent changes gives us a stronger Oil – US Crude-bullish contrarian trading bias.
— Written by Tammy Da Costa, Market Writer for DailyFX.com
Contact and follow Tammy on Twitter: @Tams707
Be the first to comment