

FangXiaNuo/E+ via Getty Images
REIT Rankings: Office
This is an abridged version of the full report published on Hoya Capital Income Builder Marketplace on July 20th.
Hoya Capital
The ‘Return to the Office’ is here – but it’s underwhelming. Despite 80% of employees currently in post-pandemic work arrangements, office utilization rates have remained 40-60% below pre-pandemic levels. Office leasing activity has remained surprisingly resilient at just 10% below pre-pandemic levels, however, but corporations won’t pay for half-empty space indefinitely. Recession concerns have slammed office REITs over the past two months on expectations that unused office space will be first on the chopping block for executives looking to curtail expenses. Within the Hoya Capital Office REIT Index, we track the 23 office REITs, which account for roughly $80 billion in market value and comprise 5-7% of the market-cap-weighted REIT Indexes.
Hoya Capital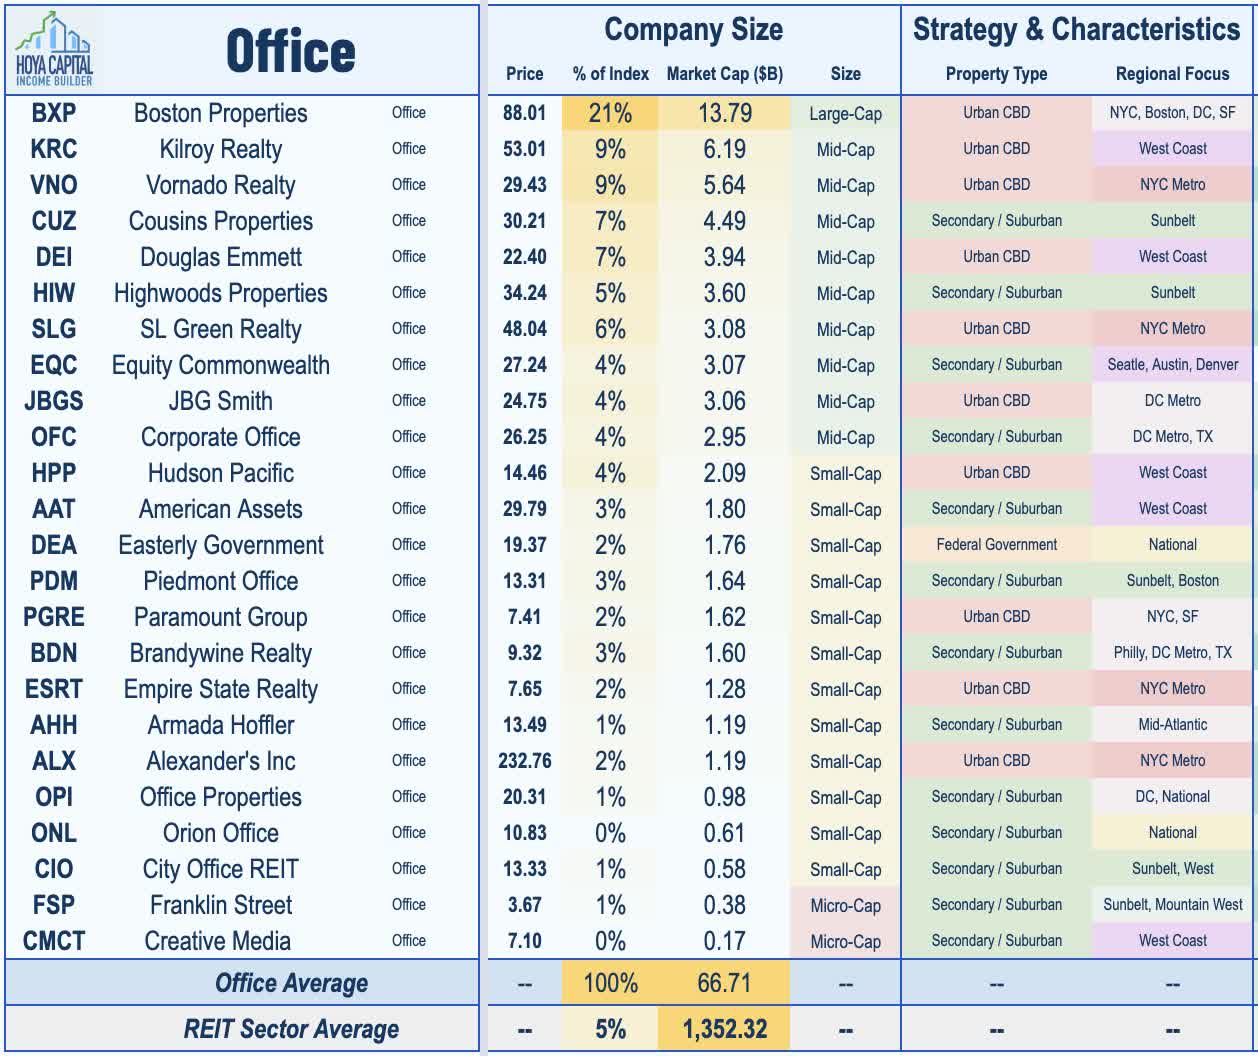
Since early in the pandemic, we’ve held the view that the Work-From-Home era is truly a “new normal” – a catalyst that accelerated a pre-destined trend of lower office utilization rates – and that the return to the office would be particularly slow in cities with longer average commute times and heavier reliance on public transit. Consistent with that expectation, utilization rates have recovered only a fraction of pre-COVID levels, particularly in dense coastal markets with longer and more transit-heavy commutes. According to recent data from Kastle Systems, office utilization levels remain at 45% or less in seven of the ten largest office markets including New York, Chicago, San Francisco, and Los Angeles. Sunbelt and secondary markets, however, have seen far higher utilization rates throughout the pandemic with Austin, Houston, and Dallas recovering to around 60% while rates are closer to 75% in several Sunbelt markets including Raleigh, Charlotte, Atlanta, and Phoenix.
Hoya Capital
Recently-updated data from the American Community Survey show that over the course of a 5-day work week, remote work employees in cities with particularly brutal commutes “save” an average of 6.5 hours per week and a hundred dollars in transportation costs. Workers in the upper quartile of commute times in these cities – those with commute times of nearly three hours per day in New York City, for instance – save nearly two full working days by working from home. Recent surveys from WFH Research confirmed that the lack of a commute is far and away the top benefit of working from home and the survey found that WFH employees reallocated 40% of this “saved” time towards extra work. That “bonus” time allocated towards work seems to explain all of the reported productivity gains of WFH found across most surveys – offsetting the drag from a generally less productive home environment compared to the office.
Hoya Capital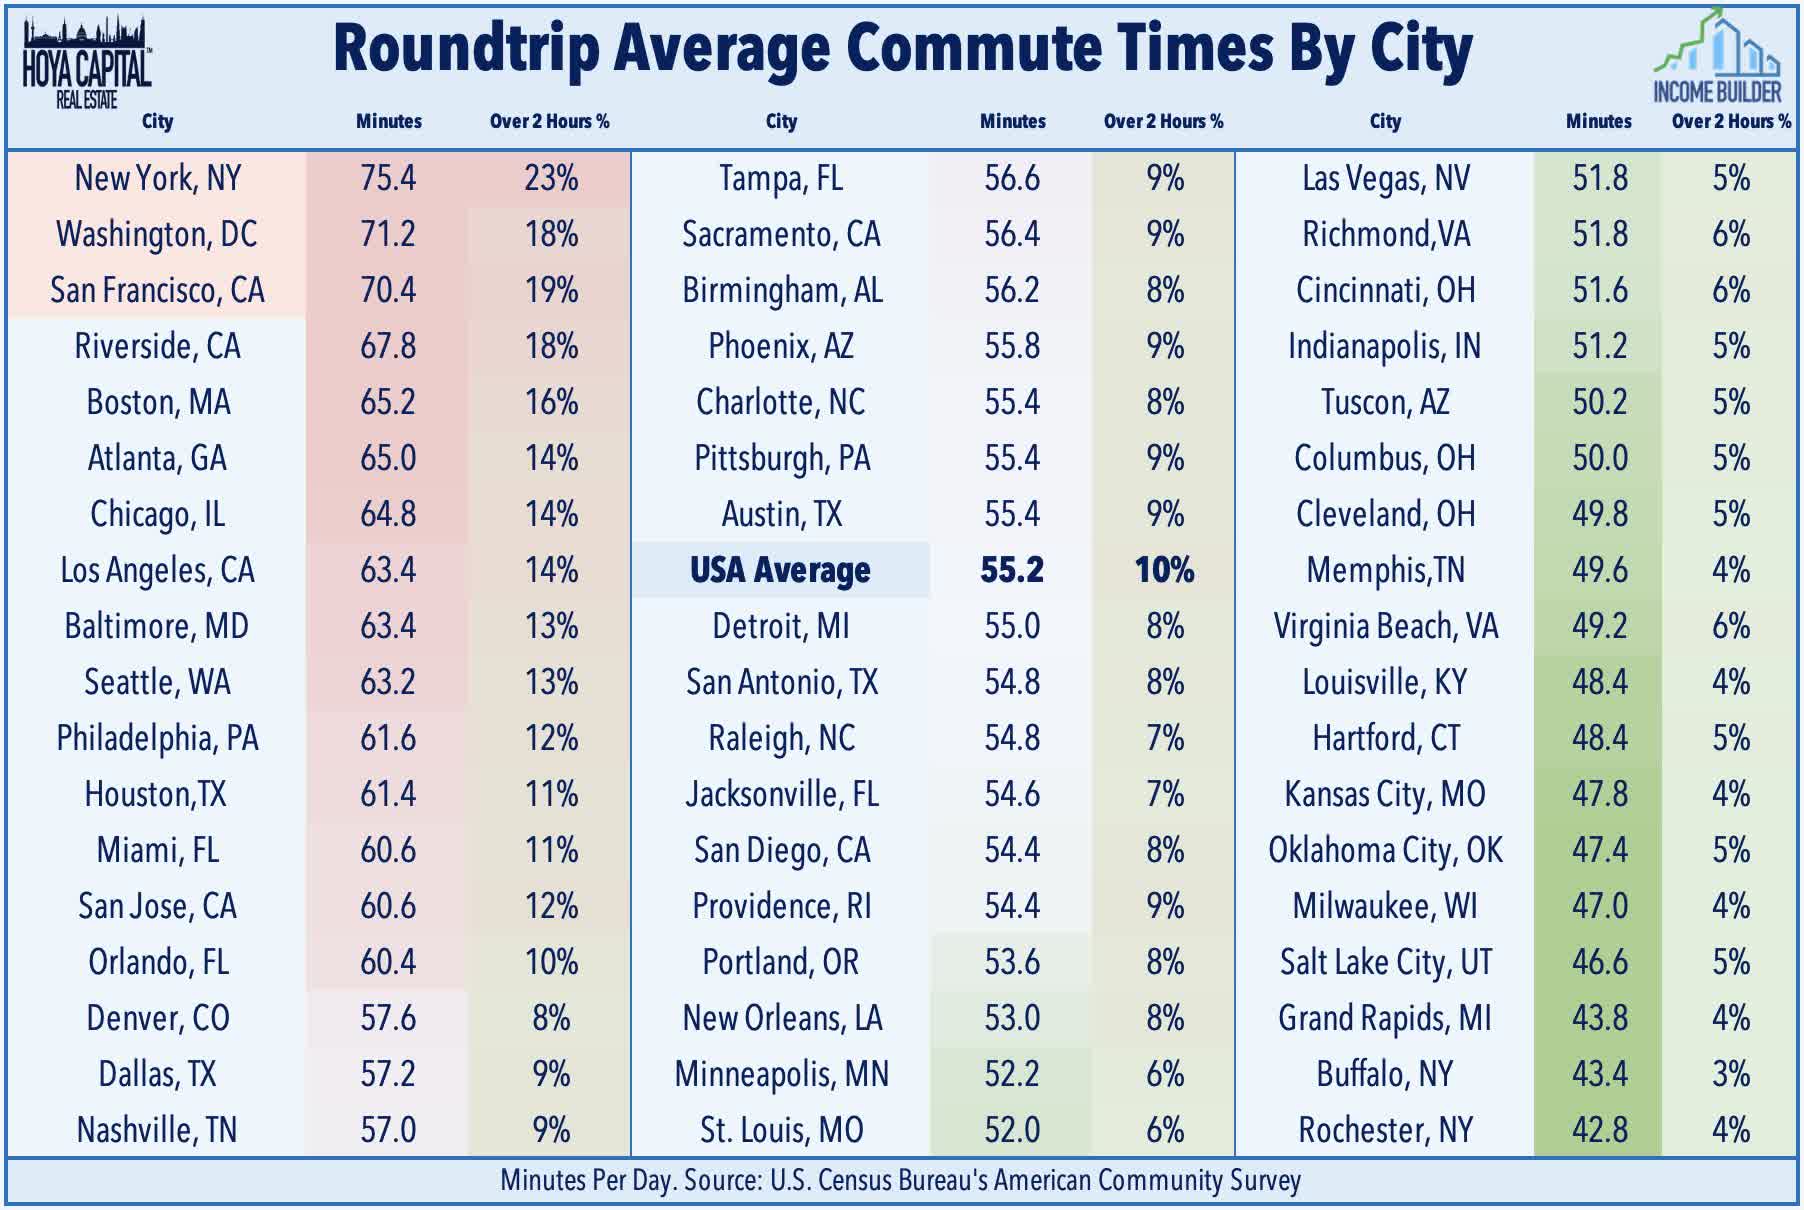
Importantly, data continues to show that the office isn’t necessarily the problem – it’s the commute. A consistently small share of employees want to do away with the office entirely – averaging 10-20% across most surveys – and younger people are itching to get back to the office at rates nearly twice that of older cohorts. A recent survey from KPMG found that less than one in five workers would prefer to be fully remote – a sentiment shared by employers as well. A recent Hogan survey noted that employees cited challenges with collaboration (36%), distractions at home (25%), and difficulty with motivation (16%) as the top challenges of the fully-remote environment. Consistent with this framework, in markets with shorter average commutes, the productivity and social benefit of the office environment are “worth” the commute time.
Hoya Capital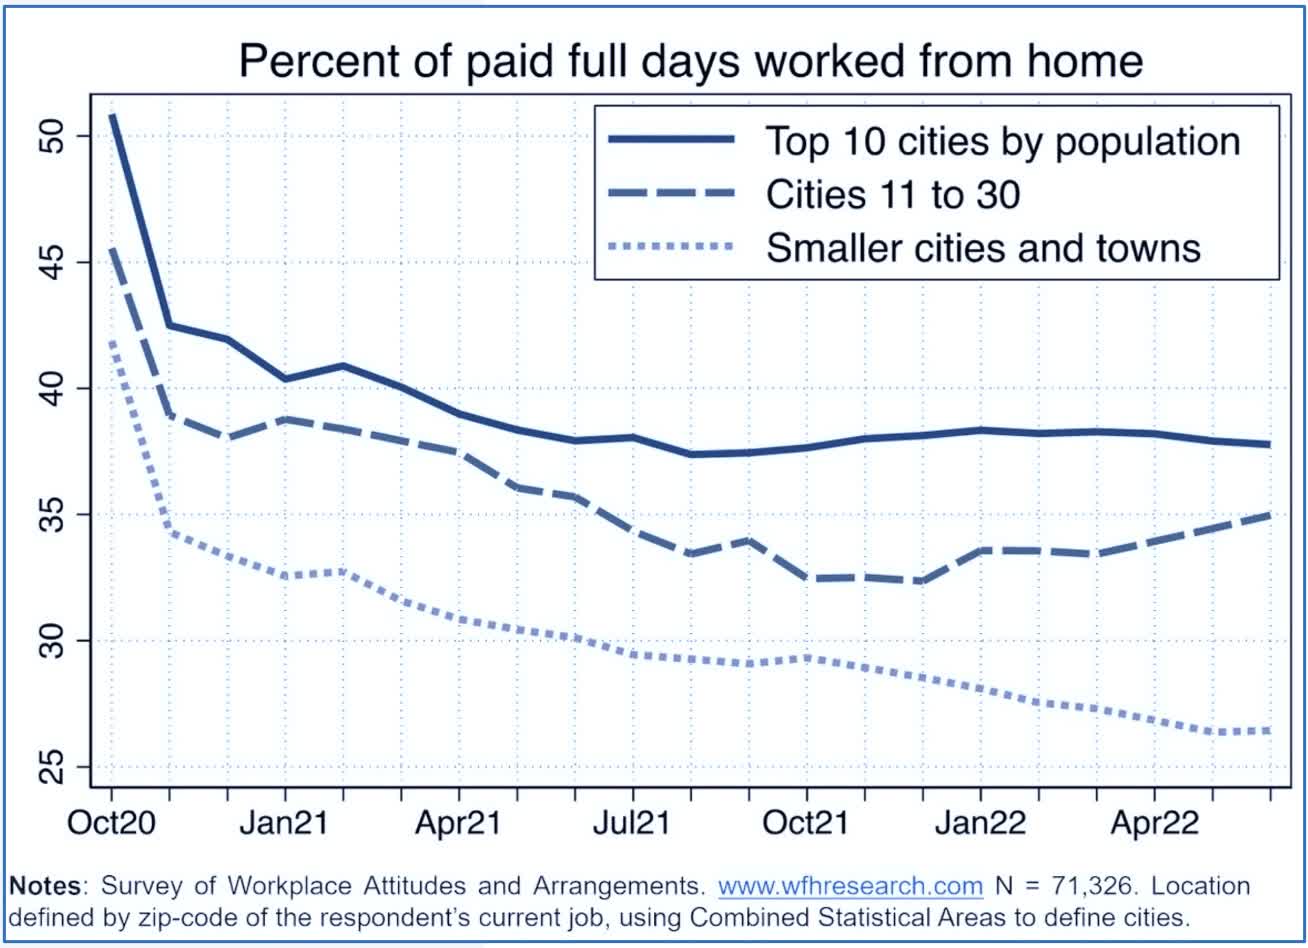
Industry and tenant mix has also become an increasingly important factor that explains the variance in office utilization rates and also captures some of the effects of commute times. Certain industries are far more WFH-friendly than others, particularly the technology and financial services industries, where WFH Research finds that employers expect just 2.2 to 2.5 office days per employee per week under their post-COVID plans. These office utilization rates are roughly half that of other office-using industries that expect their employees to report to the office 3-4 times per week. Markets with longer, transit-heavy commutes along with a WFH-disrupted industry mix heavy in technology and financial services will continue to face sustained headwinds.
Hoya Capital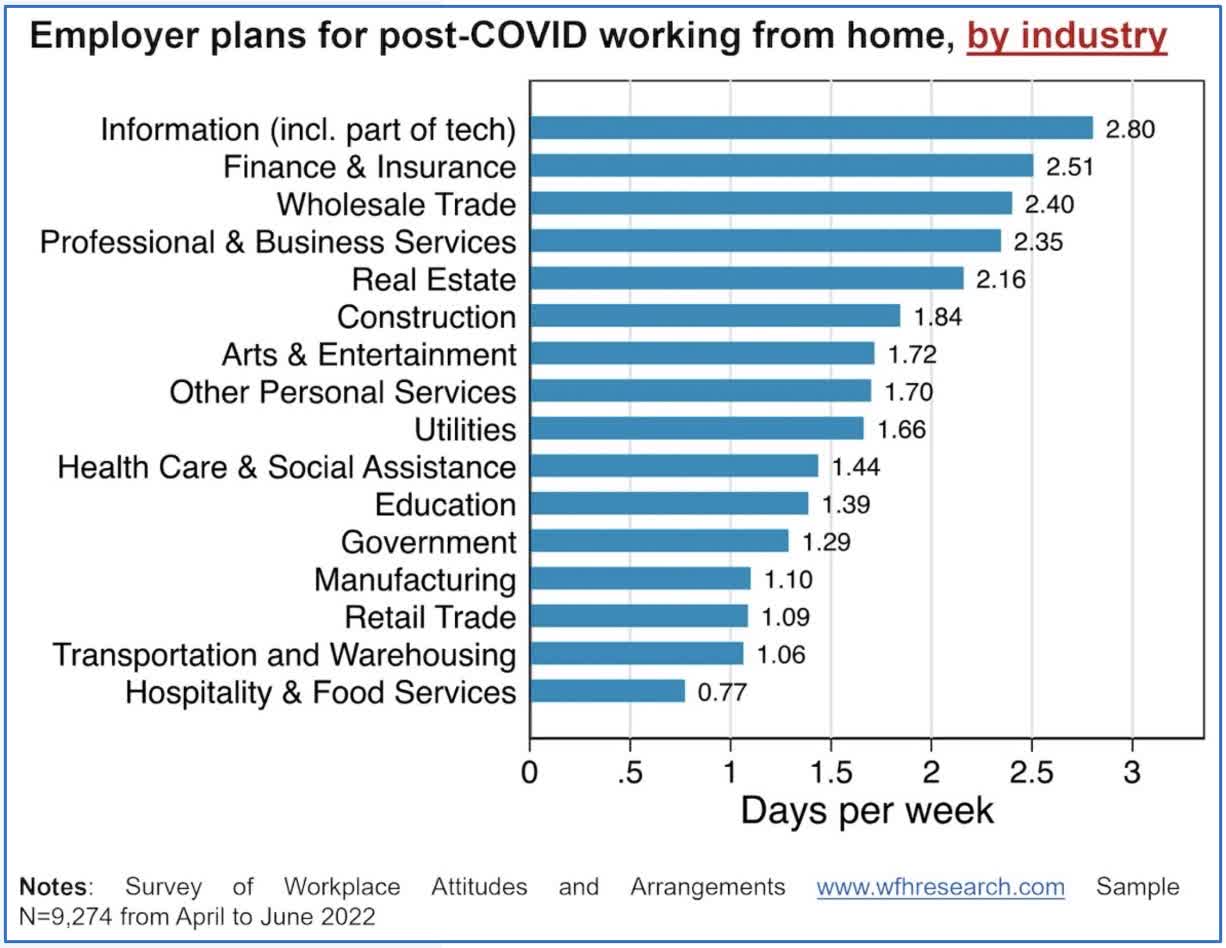
While the highest-quality “trophy” buildings in these dense coastal markets will continue to see demand from top-tier tenants, Class B and C properties will likely face persistently elevated vacancy rates. We expect a 15-20% decline in office space per employee by the end of 2030 as many corporate tenants in low-utilization markets significantly reduce their footprint in these regions and adopt more formalized “hybrid” work dynamics that utilize a combination of in-office, remote, and shared office space structure. Even before the pandemic, utilization rates and space per employee were on a downward decline, consistent with our belief that the pandemic simply accelerated – rather than temporarily altered – the pre-existing trends of increased workplace efficiency and technological disruption powered by Zoom (ZM), Slack (WORK), Alphabet (GOOG), Microsoft (MSFT), and Amazon (AMZN).
Hoya Capital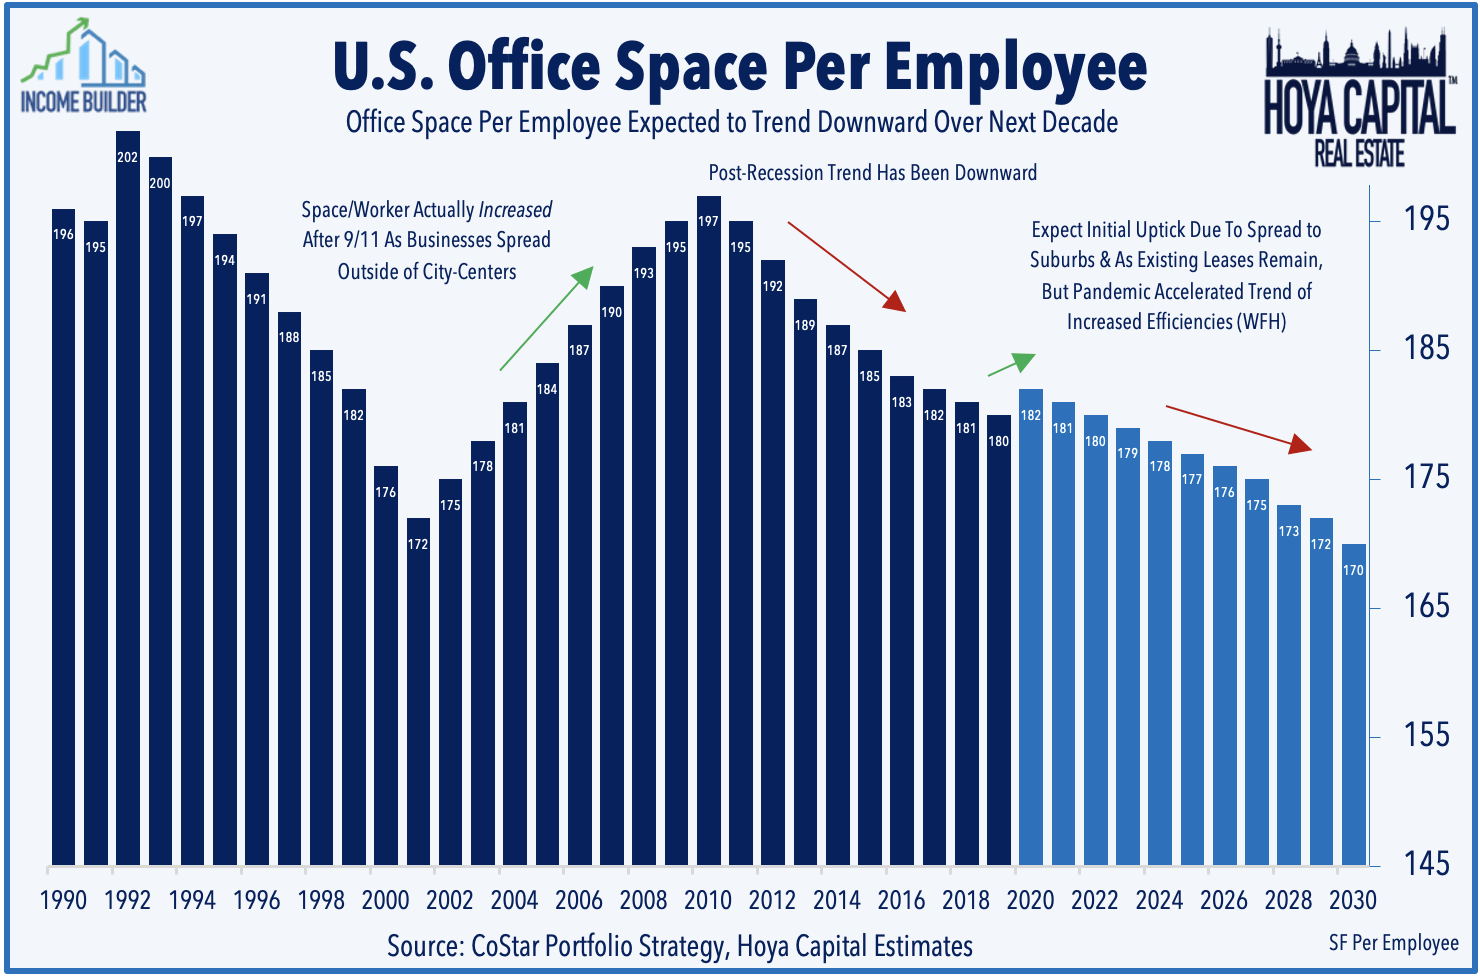
That said, corporate decision-makers have, so far, been hesitant to make permanent strategic decisions to reduce their office footprints. Consistent with the surprisingly solid results from office REITs in the prior two quarters, Jones Lang LaSalle (JLL) Research noted in their recent Office Report that leasing activity was within 25% of pre-pandemic norms despite the far-steeper 50%+ decline in utilization rates. JLL noted that gross leasing activity totaled 47.2 million square feet – 75.5% of pre-pandemic norms – but strength from secondary markets is largely offsetting more significant weakness from coastal “gateway” markets. Secondary markets are registering activity at 87.3% the rate of an average 2019 quarter compared to the 65.4% recovery rate in gateway markets. Four markets-San Diego, Miami, Silicon Valley and Raleigh- experienced leasing volumes above their pre-pandemic norms in Q2.
Hoya Capital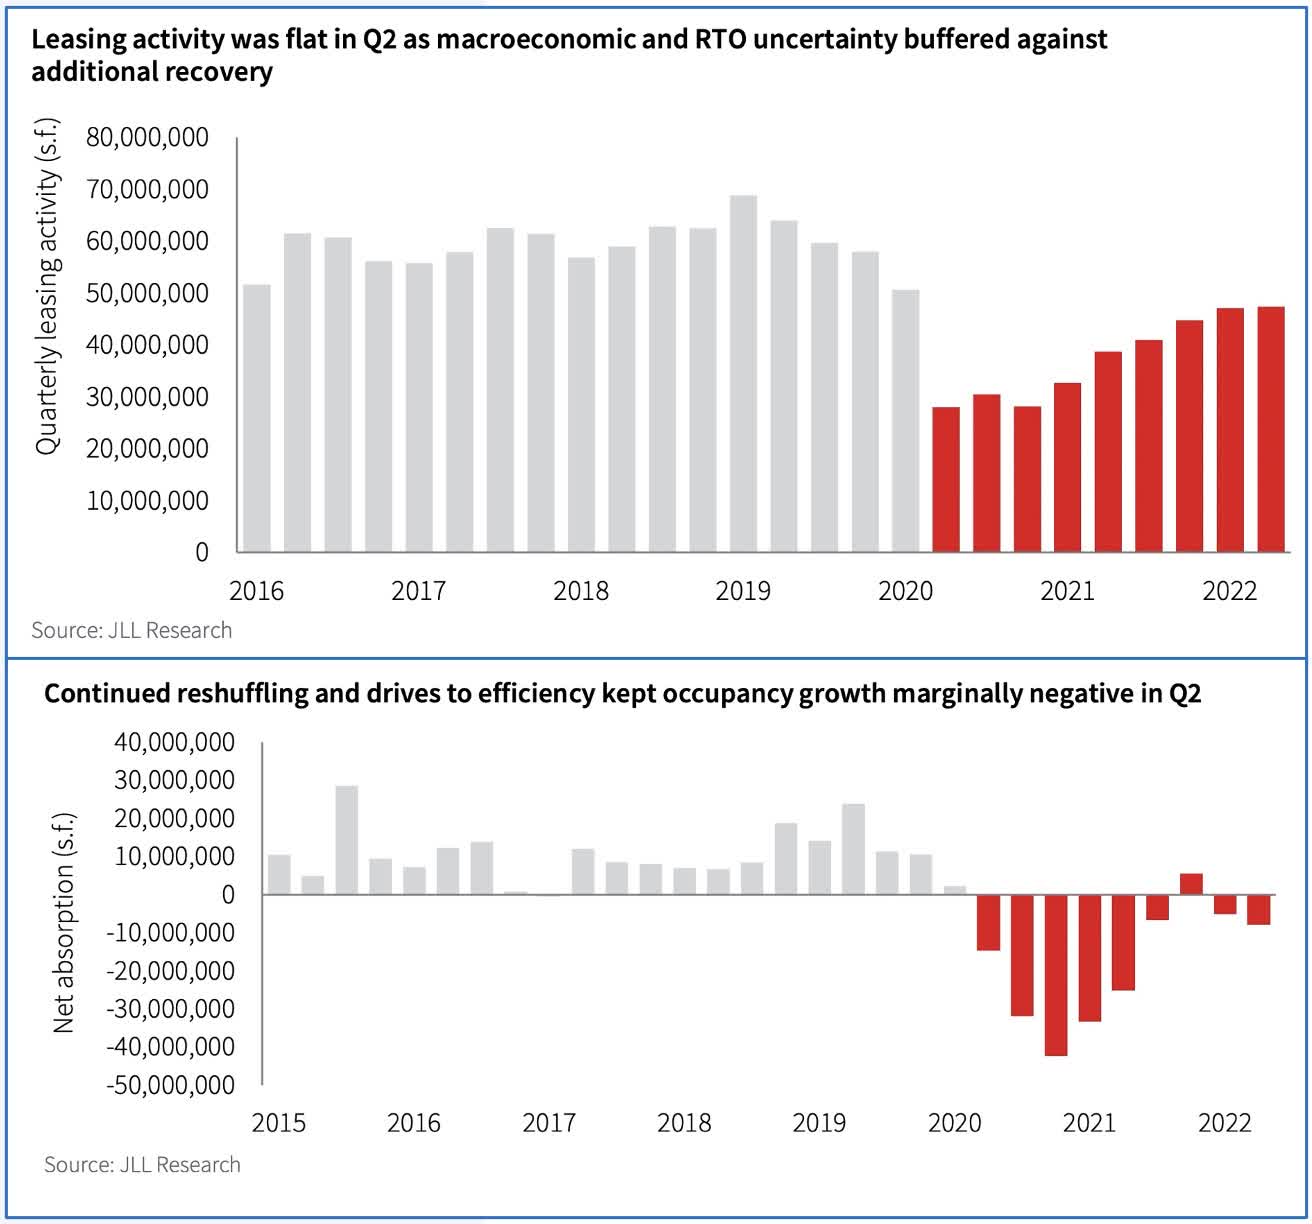
The recently quarterly US Office Marketbeat from Cushman & Wakefield further highlighted the “highly uneven” recovery. The firm noted two bright spots, seeing strong demand in life sciences markets buoyed by demand for both lab and office space – San Jose, San Diego, Boston, Northern New Jersey and San Mateo County – and also seeing strong demand in large Sunbelt markets with strong job growth and appeal for growing tech firms – Dallas, Atlanta, Austin and Miami. At the national level, effective market rents have declined by 13.3% since peaking in Q2 2020, but renewal spreads remain roughly flat to slightly positive, reflecting the long-duration nature of office leases. For REITs in Q1, the average occupancy rate declined 30 basis points from the prior quarter to 87.5% while cash leasing spreads moderated to a 2.2% year-over-year rate.
Hoya Capital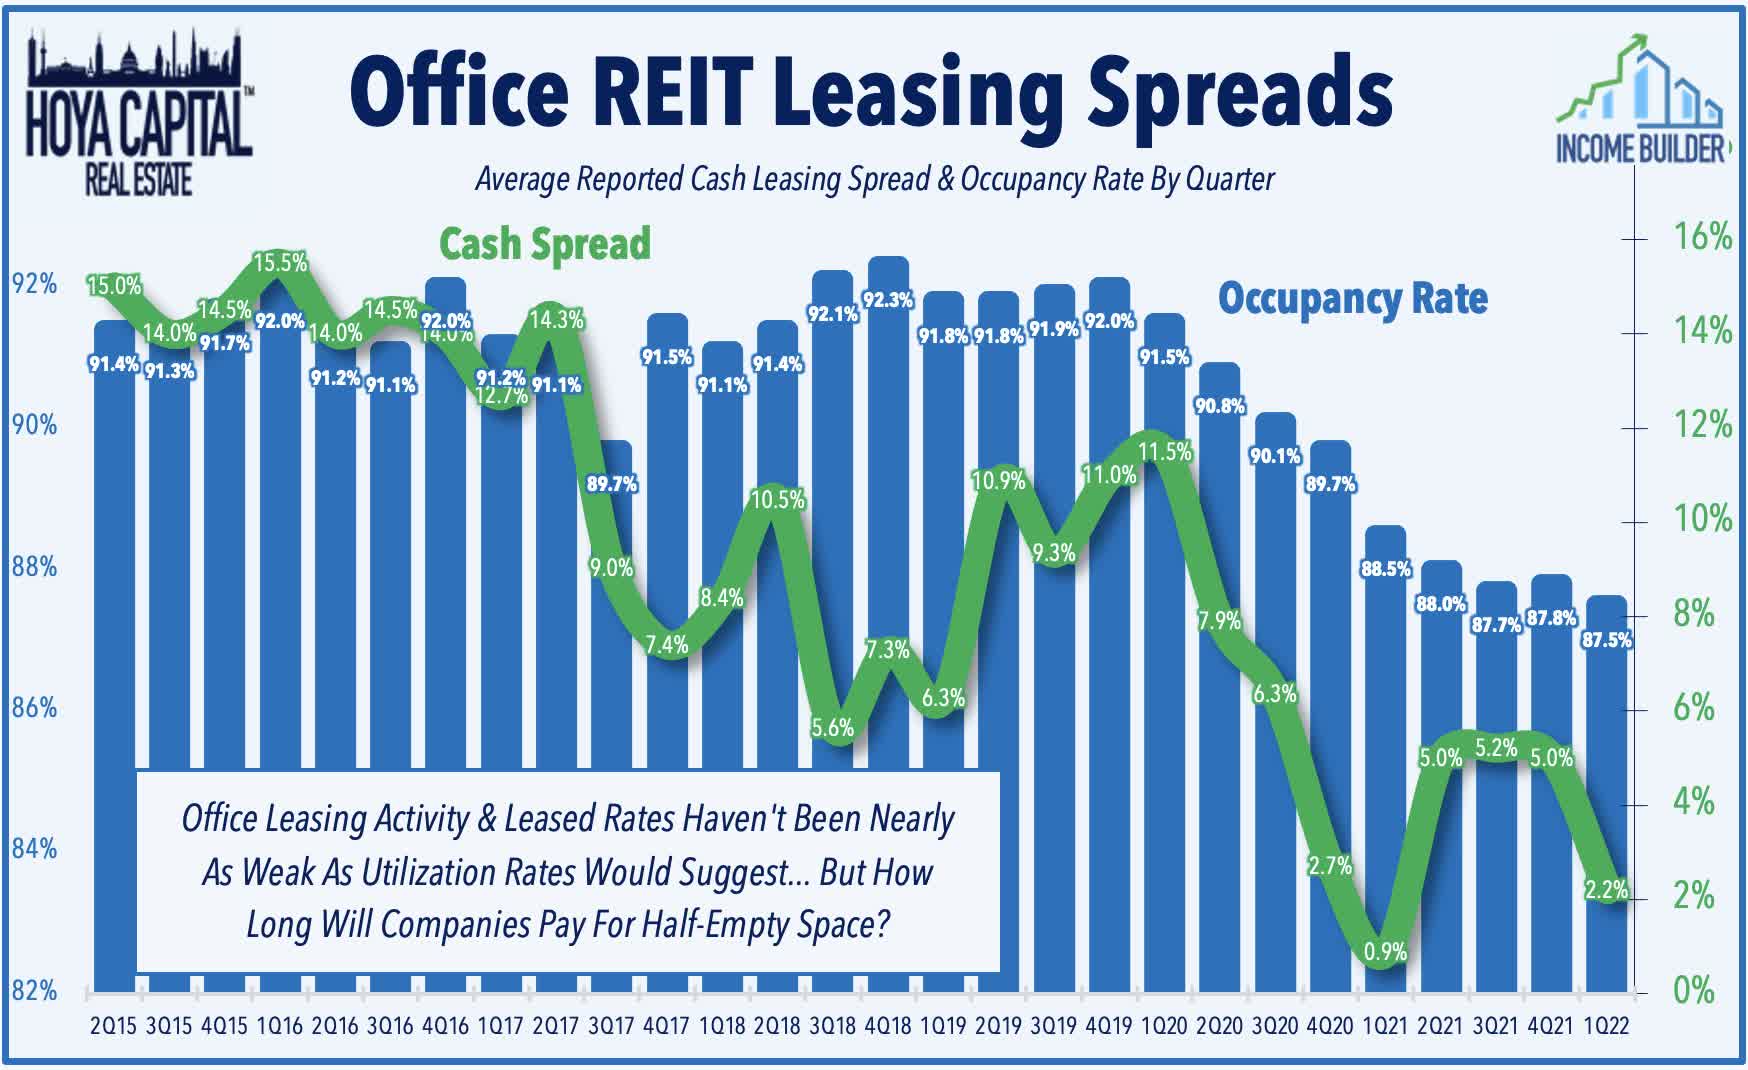
Hoya Capital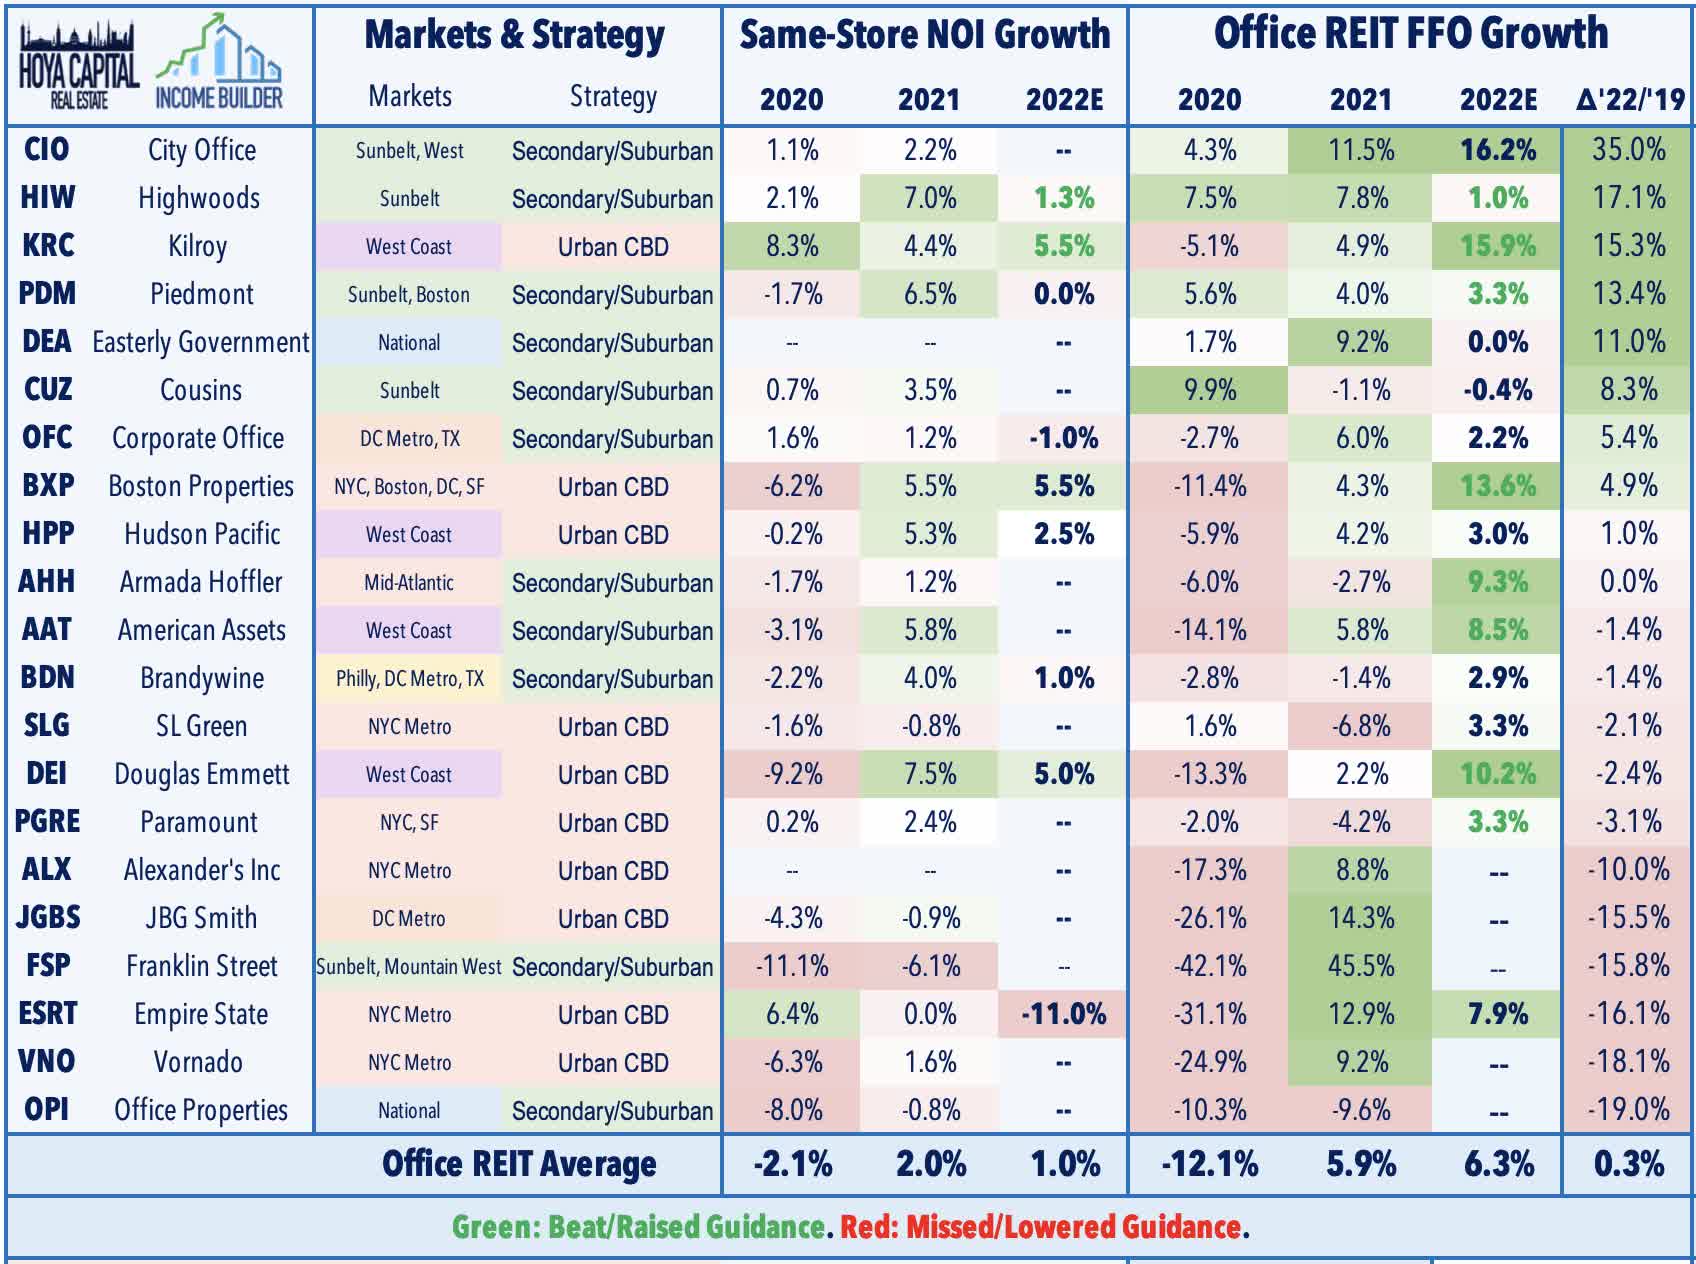
Office REITs Stock Price Performance
After riding the ‘reopening rotation’ and inflation trade to strong gains in early 2022, recession concerns have weighed heavily on the office REIT sector in recent months. Having led the gains in the REIT sector through the first quarter, office REITs have seen a sharp reversal since early April and are the single-worst-performing property sector over the past quarter. The market-cap-weighted Hoya Capital Office REIT Index is lower by 23% for the year – underperforming the 19.0% decline from the market-cap-weighted Vanguard Real Estate ETF (VNQ) and the 16.0% decline from the S&P 500 ETF (SPY).
Hoya Capital
The underperformance this year comes after an equally disappointing 2021 in which office REITs gained 23.3% for the year, significantly lagging the 41.3% total returns from the All Equity REIT Index. Diving deeper into the performance of these individual REITs, every office REIT besides Equity Commonwealth (EQC) is lower for the year while seven REITs are off by 30% or more. Among the laggards this year are Orion Office (ONL) – which spun out from Realty Income (O) following their merger with Vereit. Despite the bifurcating fundamentals between Sunbelt-focused office REITs and coastal-focused REITs, the stock performance trends haven’t necessarily reflected these trends, and we see compelling value in several of the Sunbelt-heavy REITs that trade at historically deep discounts across most metrics.
Hoya Capital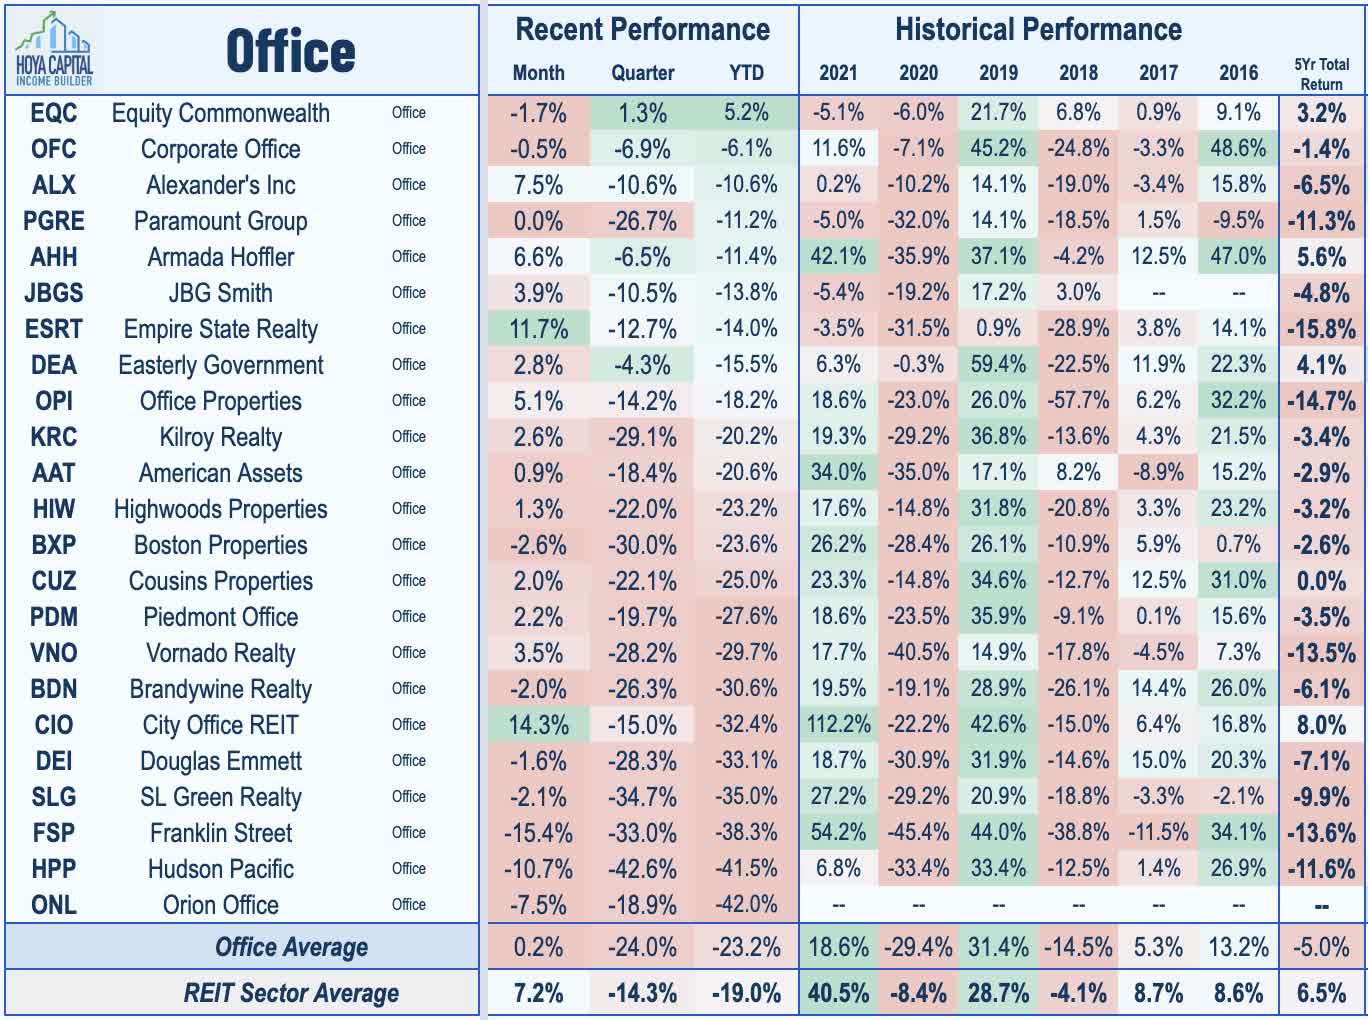
Deeper Dive: Office REIT Fundamentals
The office sector is typically segmented into two categories. Urban CBD (“Central Business District”) or ‘Gateway’ REITs hold portfolios that are concentrated in the six largest U.S. cities: New York City, Chicago, Boston, Los Angeles, San Francisco, and Washington, D.C., a segment that has been hit especially hard by the pandemic. Secondary/ Suburban REITs, which have generally outperformed throughout the pandemic, hold portfolios concentrated in the Sunbelt regions and/or in secondary markets. Even in the best of times, office ownership is a tough, capital-intensive business with relatively low operating margins and high capital expenditure needs, as tenants tend to have quite a bit of negotiating power relative to landlords. This is particularly true given the ample available supply – a supply overhang that will linger for much of the next decade.
Hoya Capital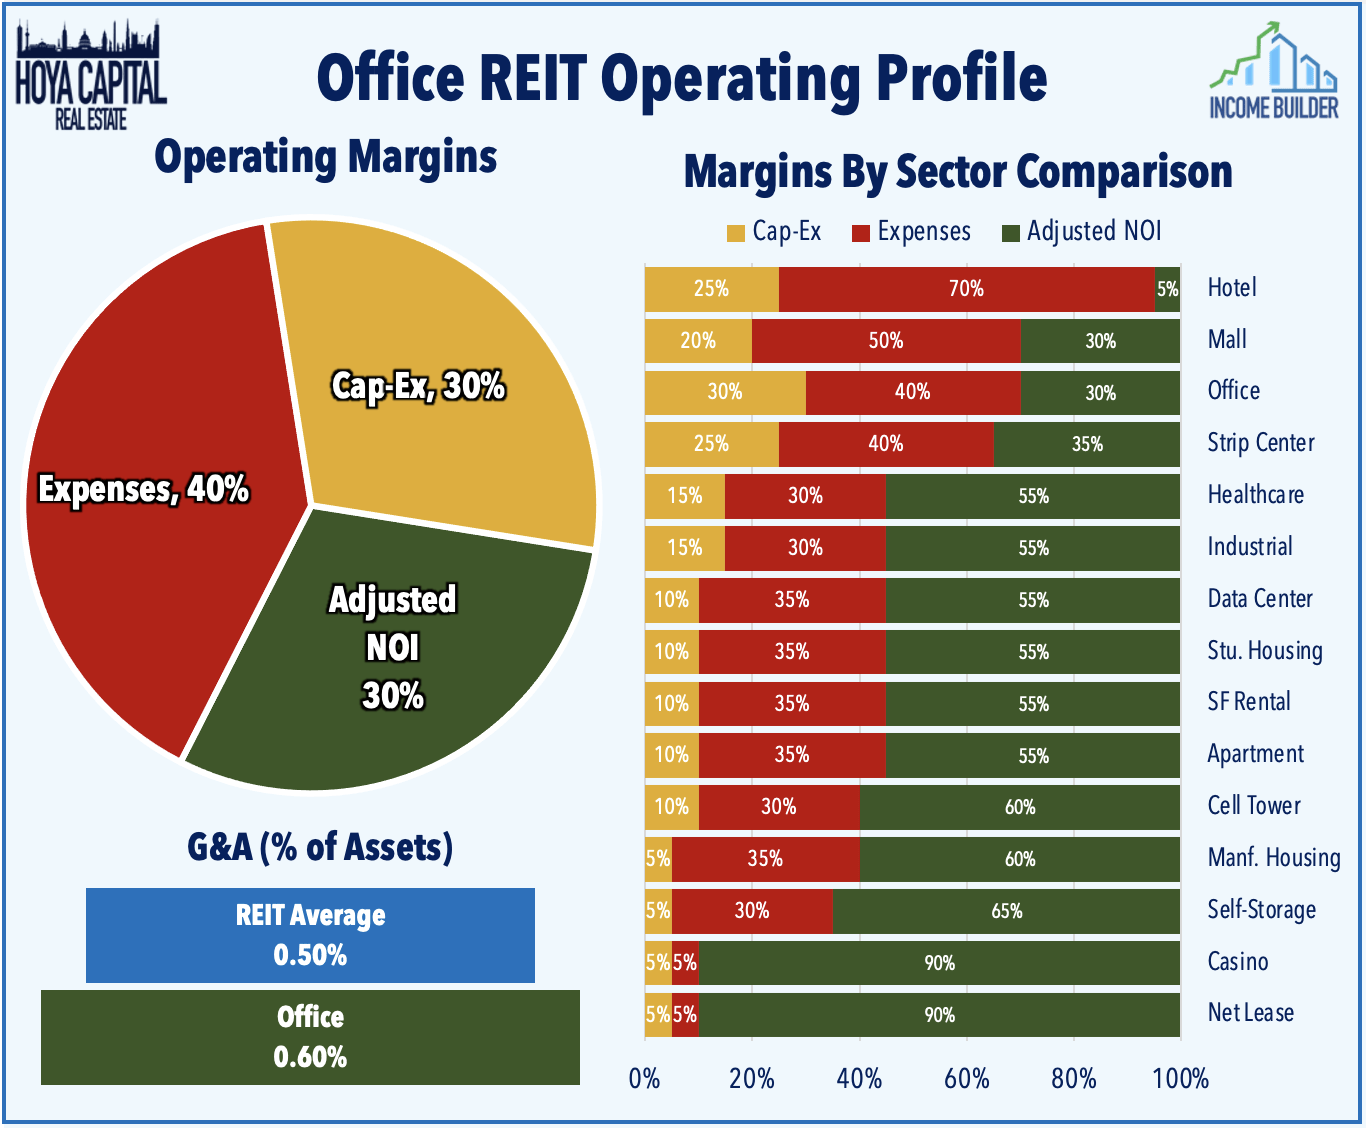
Given the high degree of fixed costs incurred in managing an office property – whether fully occupied or mostly vacant – operating leverage is quite high. Thus, small changes in occupancy and market fundamentals can have significant negative impacts. Office REITs were finally hitting their stride right before the pandemic, powered by a seemingly unstoppable streak of job growth that reached over 115 consecutive months. The office REIT sector tends to outperform later in the economic cycle and respond more slowly to economic inflection points given the typically long-term lease structure inherent in office leases, which average 5-10 years for suburban assets and 10-20 years for CBD assets. Same-store NOI growth for office REITs averaged -0.2% in 2020 but bounced back into positive territory in 2021 with 3.9% growth.
Hoya Capital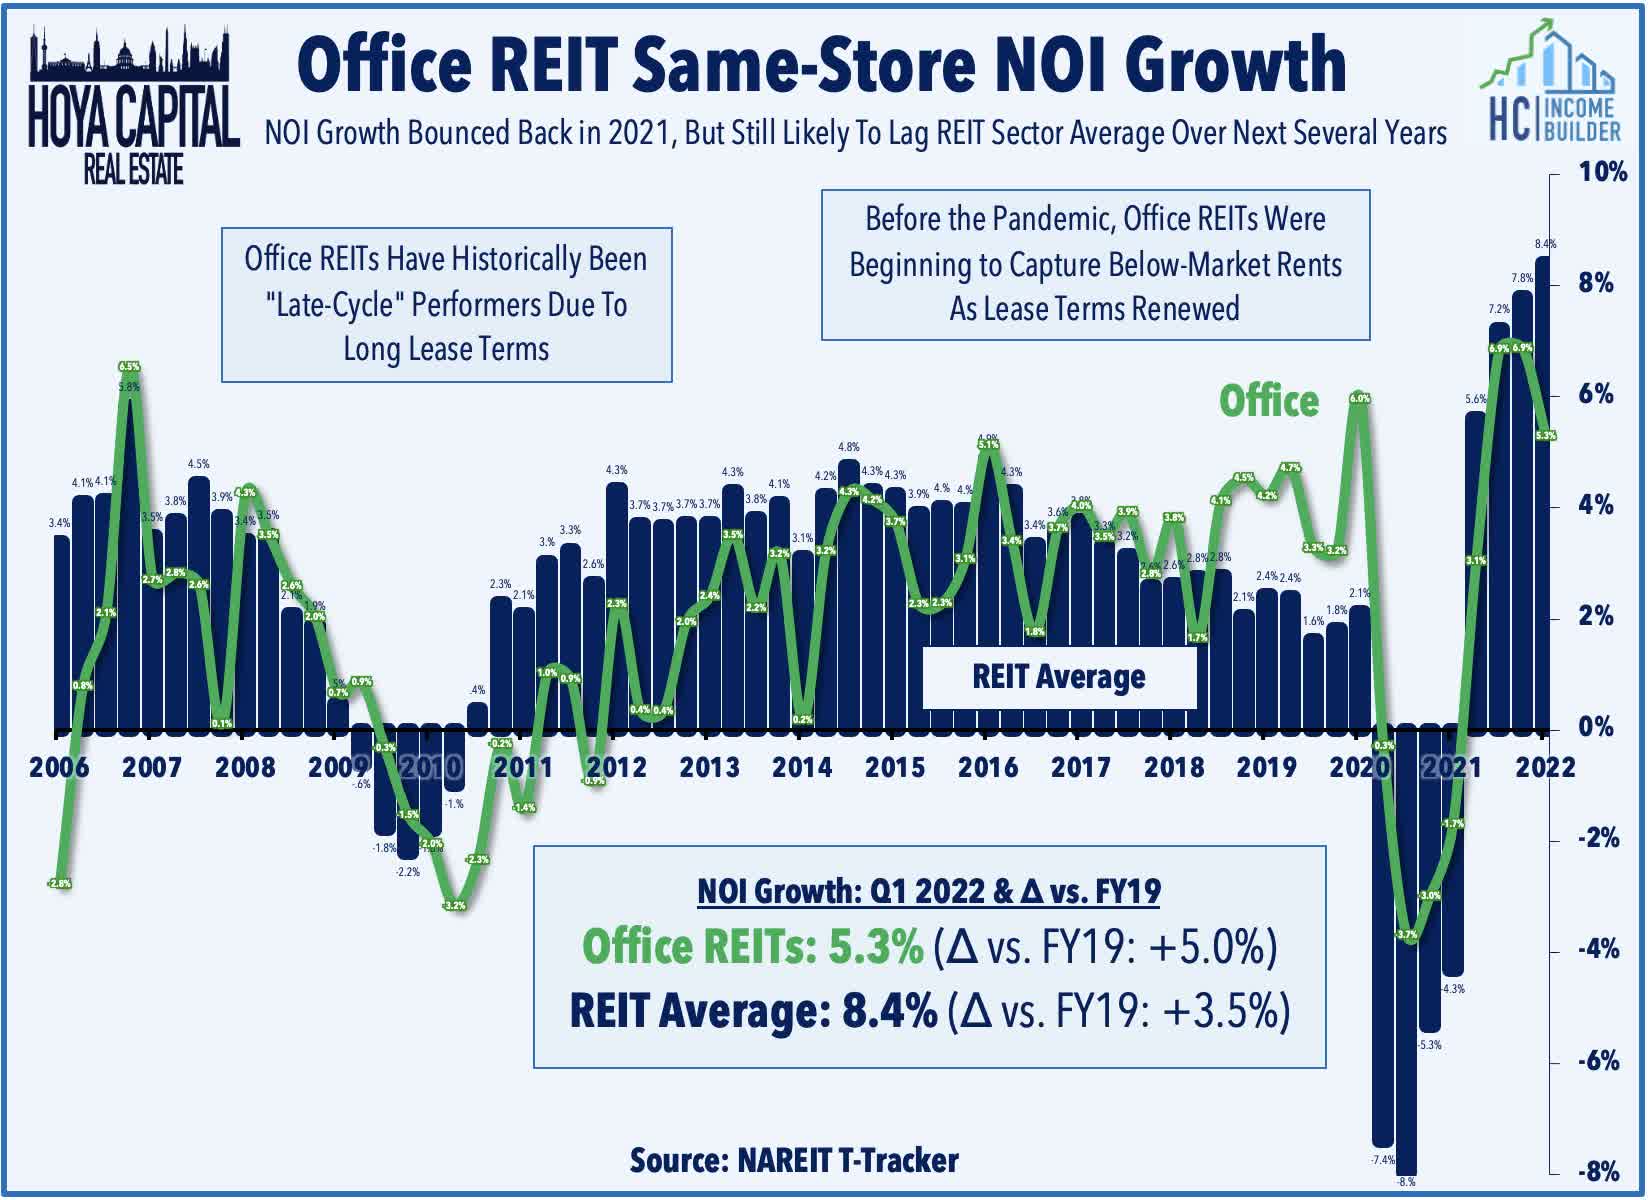
Power to the tenants. More than other REIT sectors, office REITs have a relatively small roster of tenants, and given the ongoing supply overhang from the combination of weak demand and continued supply growth, we project that most landlords will have soft pricing power for the foreseeable future. Occupancy rates across the office sector have declined more sharply than any other major property sector since the pandemic began, but have stabilized in recent quarters. In CBRE’s 2022 U.S. Real Estate Market Outlook report, the real estate brokerage firm forecast that the national office vacancy rate will reach its highest level since 1993 in 2022 due to elevated levels of new supply, which will keep market conditions decidedly in favor of tenants.
Hoya Capital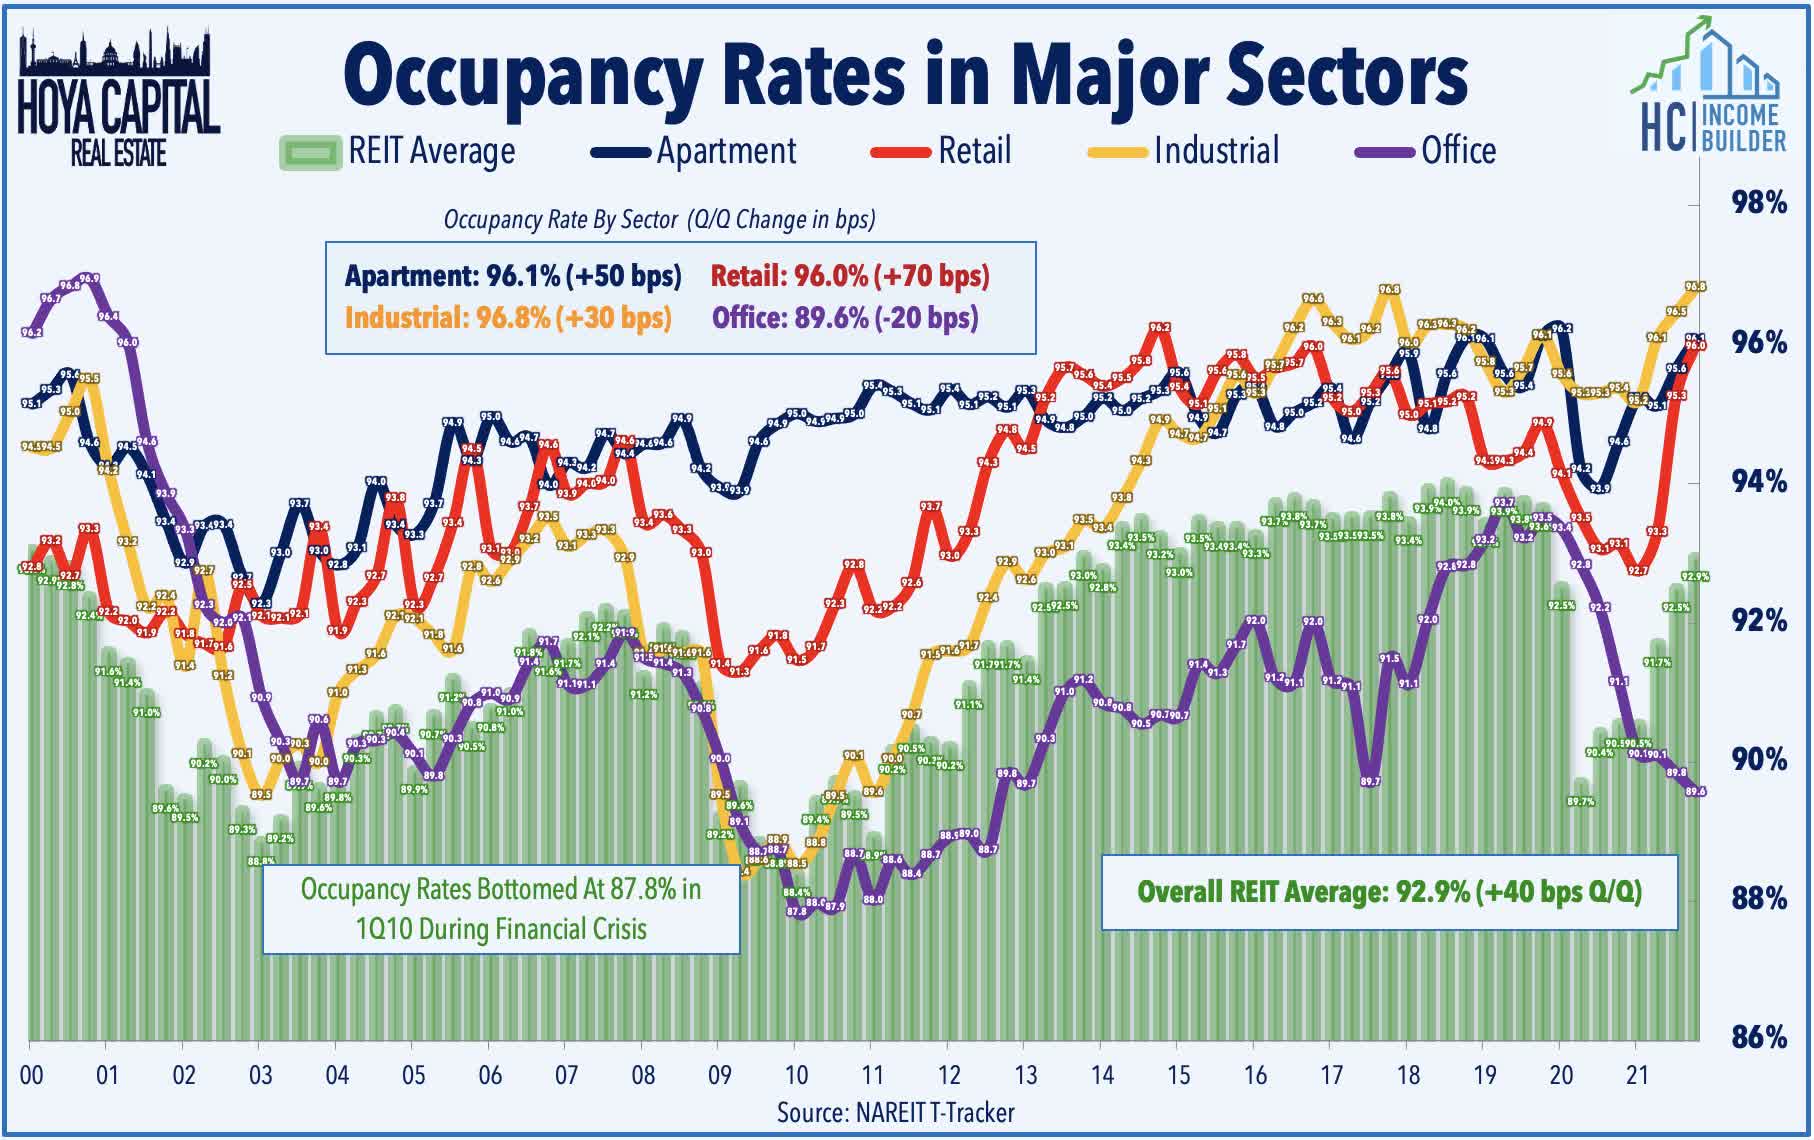
On that note, the broader supply dynamic has been a persistent headwind in many major markets as construction spending on office development ramped up after the 2016 elections, spurred by the passage of corporate tax reform and strong job growth of key office-using sectors. The office pipeline increased to a new cycle-high in late 2019 right before the start of the pandemic, and after a slight pullback during the pandemic, office REITs were again some of the more active developers across the REIT space. According to NAREIT T-Tracker data, the office development pipeline stands at $15.7 billion, up sharply from the 2012 level of $2 billion, representing 15% of office REIT market value which is by far the highest relative pipeline in the REIT sector.
Hoya Capital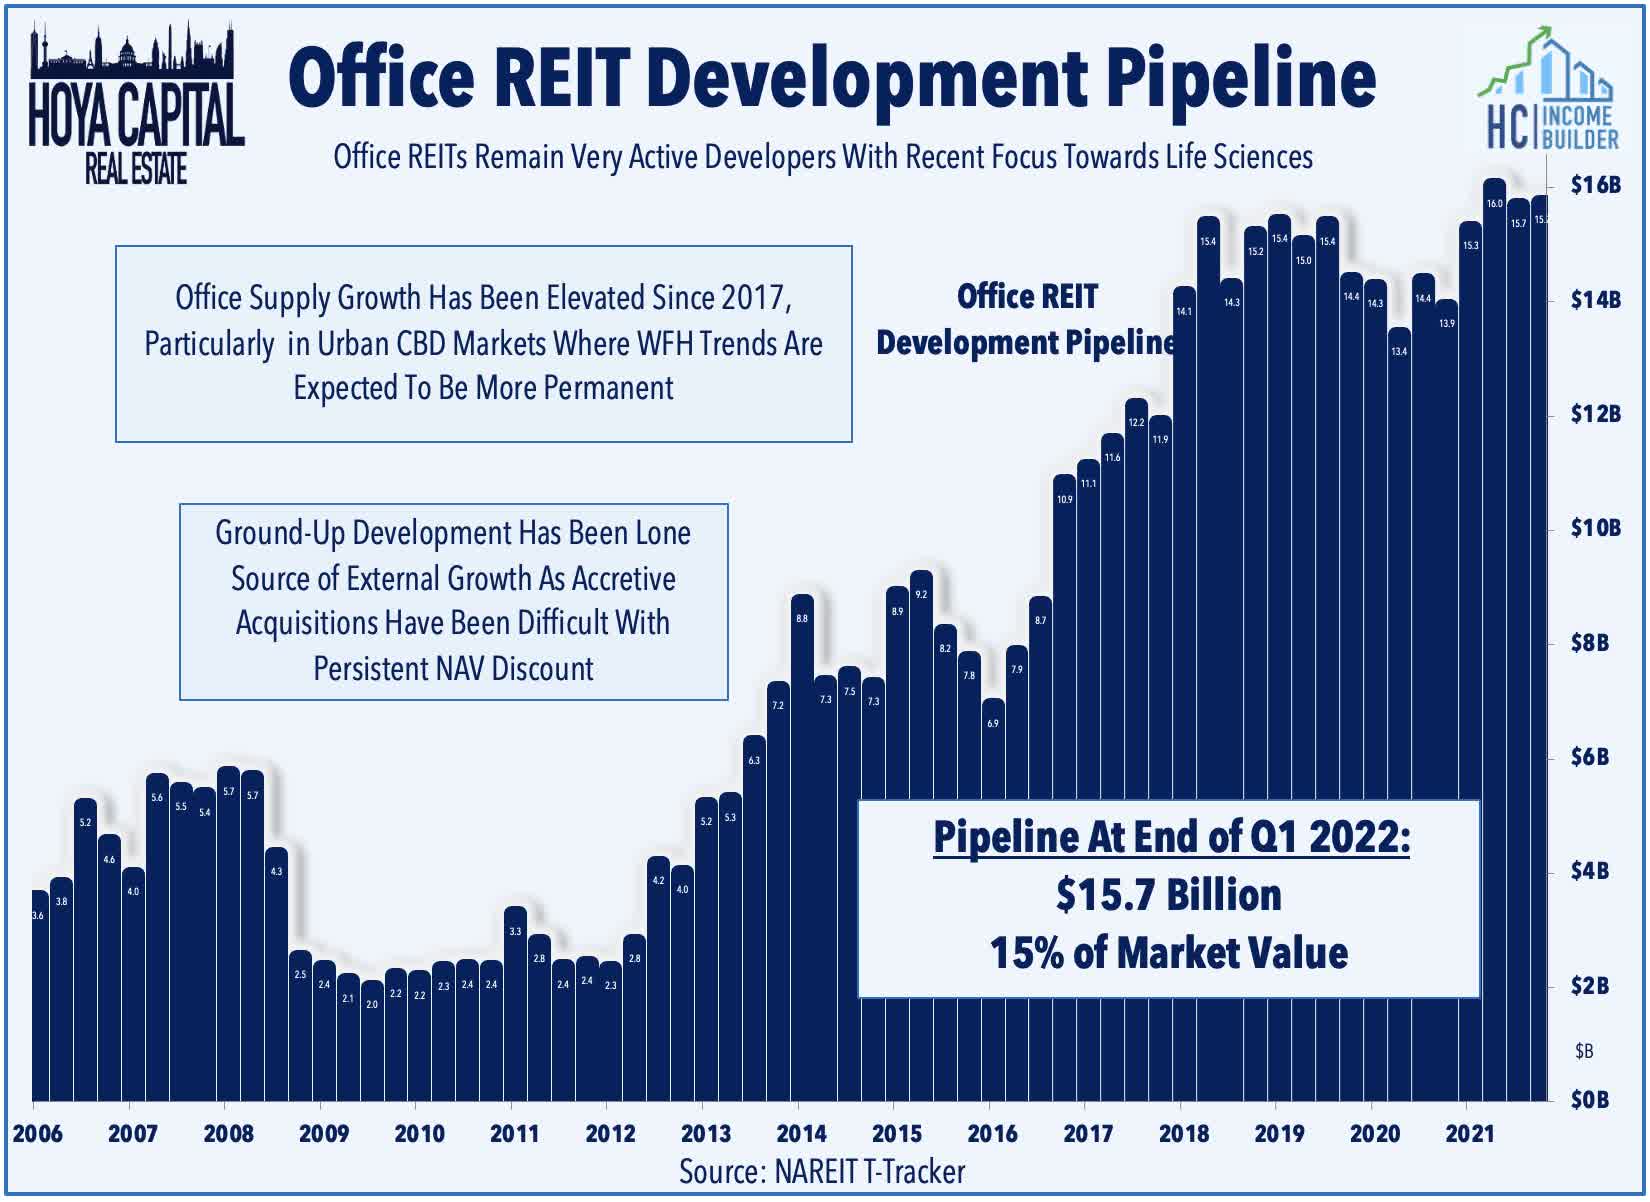
Ground-up development has been the lone source of external growth for office REITs over the past half-decade as accretive acquisitions have been made quite difficult by the persistent valuation discounts relative to private market valuations. As noted above, private market pricing has remained notably firm in recent quarters, underscored by several major transactions including Google’s $2.1 billion deal to buy a Manhattan office building, consistent with recent data from CBRE (CBRE) which showed that cap rates have “remained stable or compressed across most of the top 25 markets” since the start of the pandemic. Office REITs had been showing signs of life on the acquisition front in recent quarters, particularly the Sunbelt-focused REITs with a more attractive cost of capital, recording $13.3 in acquisitions in 2021, the highest since 2017.
Hoya Capital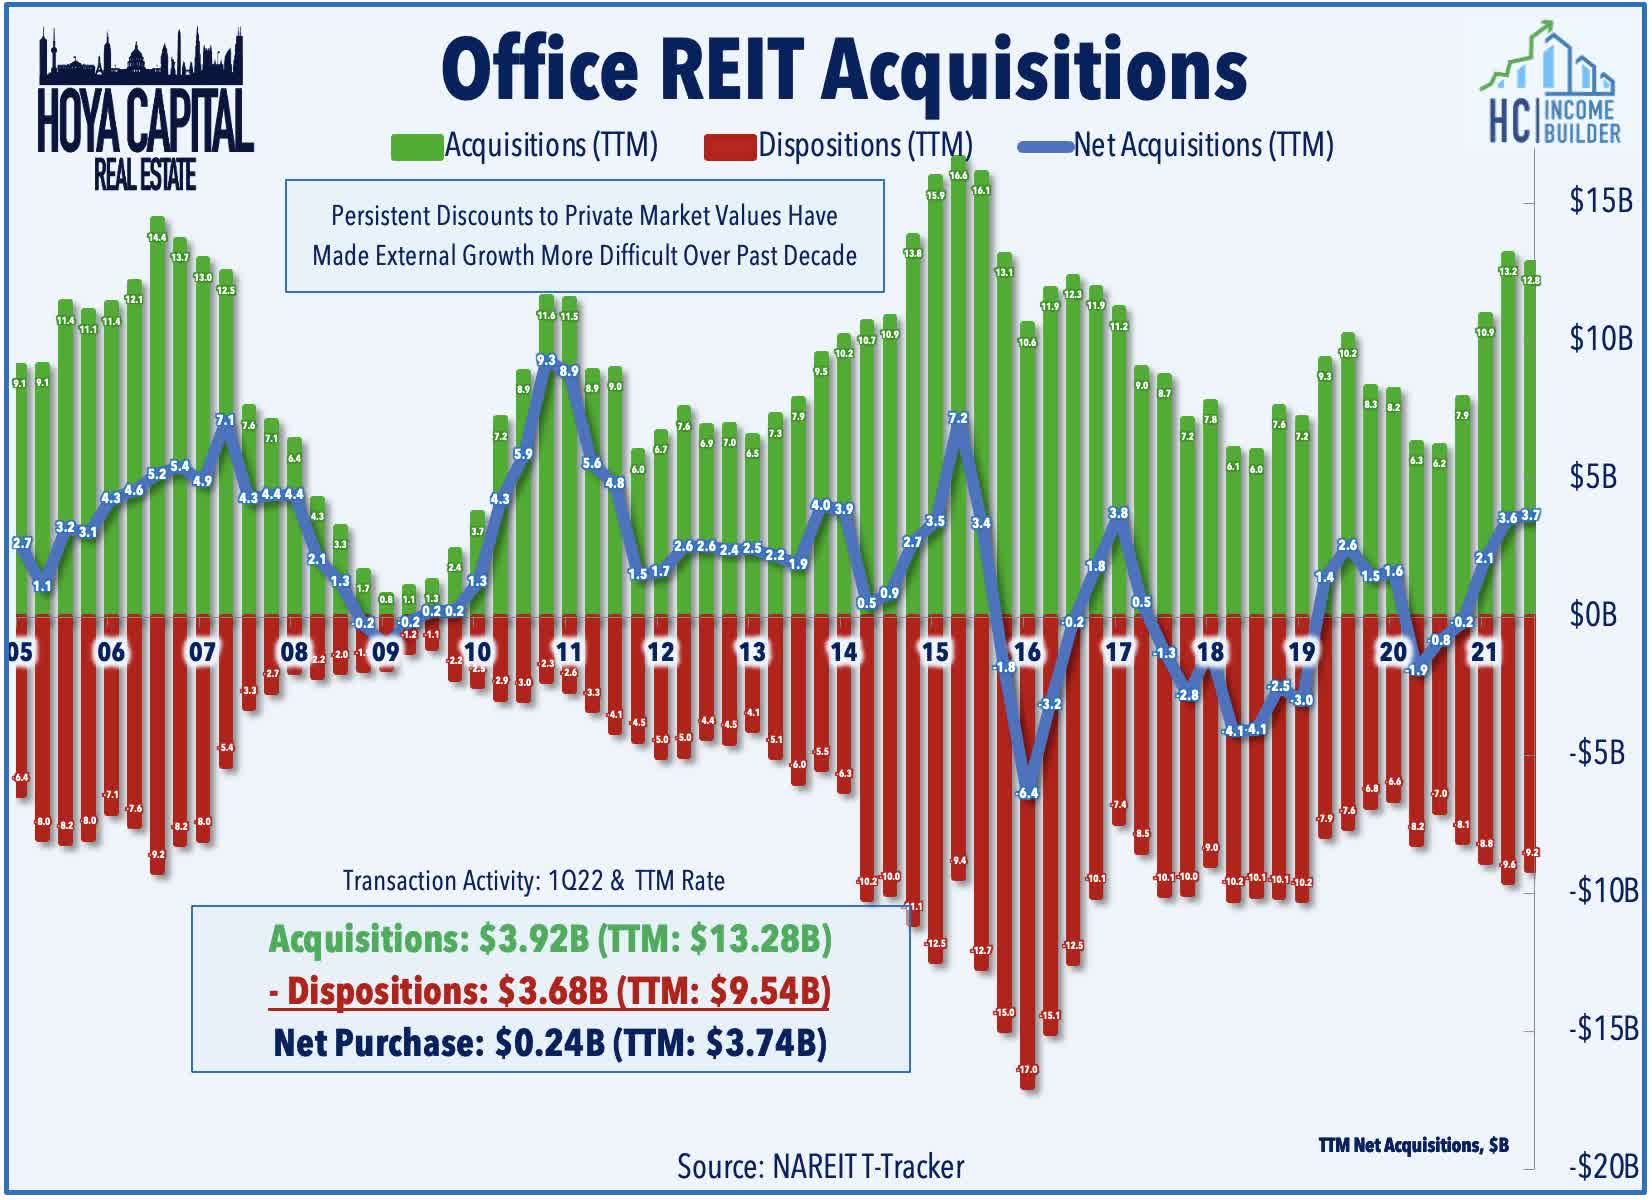
Several office REITs have taken advantage of the steep NAV discounts to create significant shareholder value. Last year, Columbia Property Trust was acquired by PIMCO at a healthy premium, underscoring our belief that the sector is long overdue for a wave of consolidation and asset sales. Elsewhere, Mack-Cali Realty rebranded itself as Veris Residential (VRE), reflecting the company’s exit from the office sector through a series of asset sales as it transitions into a pure-play multifamily REIT. This move follows a similar strategic shift from Washington REIT (WRE), which sold its office portfolio to Brookfield (BAM) for $766M as WRE shifts its focus to multifamily.
Hoya Capital
Office REITs Dividend Yields
While the growth outlook remains muted, office REIT dividend yields have swelled over the past year amid this post-pandemic pullback. Eleven office REITs boosted their payouts in 2021 – part of a historic wave of more than 130 dividend hikes across the REIT sector in 2021 – but we’ve seen just two additional hikes this year. Current payout ratios suggest that these distribution levels are quite sustainable, as a whole, but several REITs with weaker balance sheets are at higher risk for a potential dividend cut if fundamentals weaken. Office REITs now rank toward the top of the REIT sector, paying an average yield of 5.1% compared to the market-cap-weighted REIT sector average of 3.3%, despite paying out just 50% of their available Funds from Operations.
Hoya Capital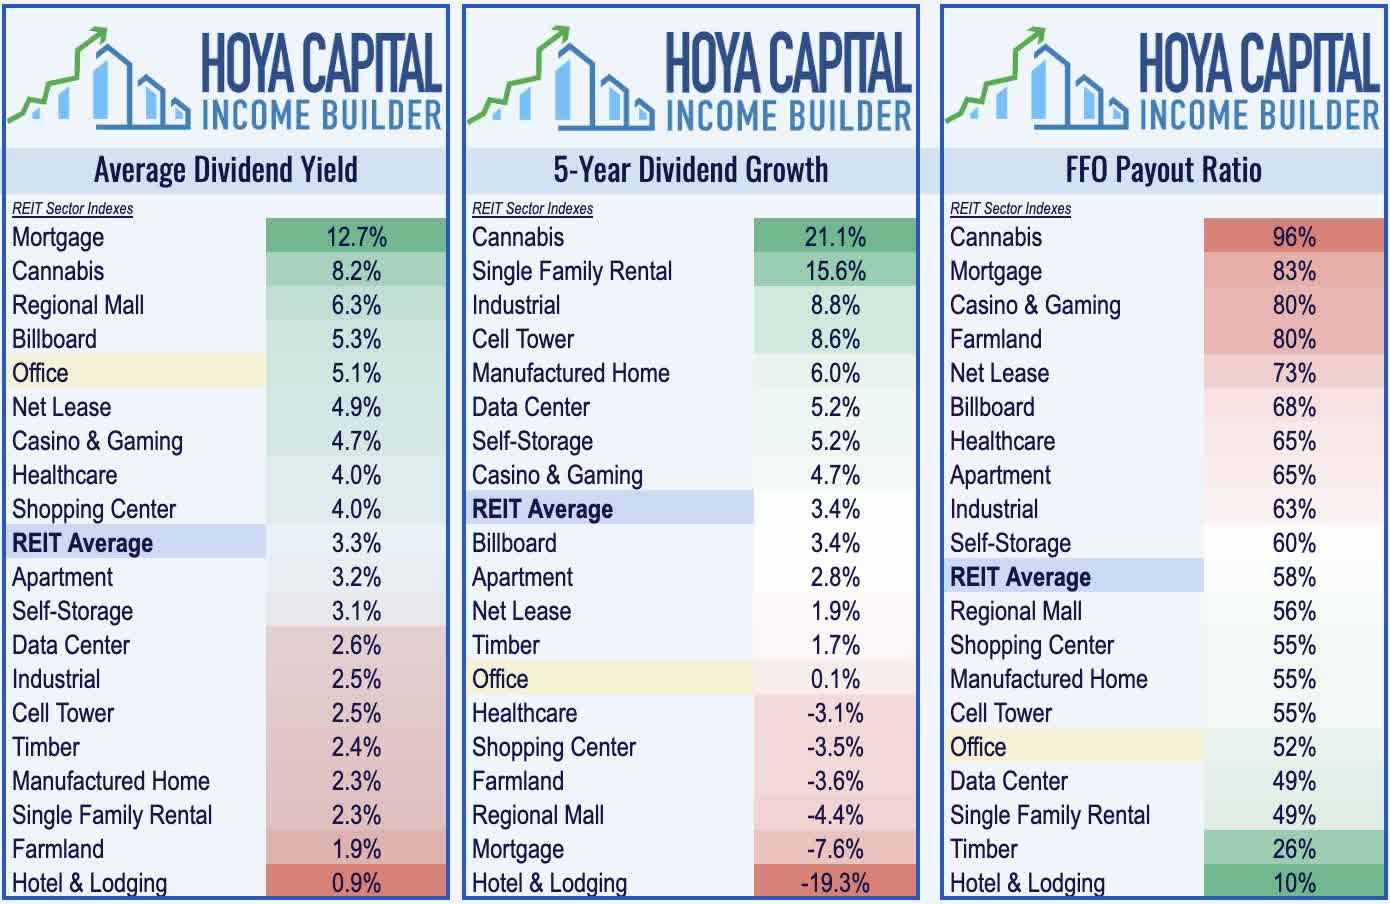
There is a wide range of dividend distribution strategies employed by the 23 REITs within the sector, with yields ranging from 10.8% from Office Properties (OPI) to a low of 0% from Equity Commonwealth (EQC). As noted, a pair of office REITs – Cousins and Paramount – have hiked their dividends this year while one office REIT – Franklin Street – changed its distribution policy to a variable quarterly dividend – replacing its previous regular quarterly dividend policy – which the company notes “better aligns with the transactional nature of our 2022 objectives” which include the sale of properties and use of proceeds for debt reduction.
Hoya Capital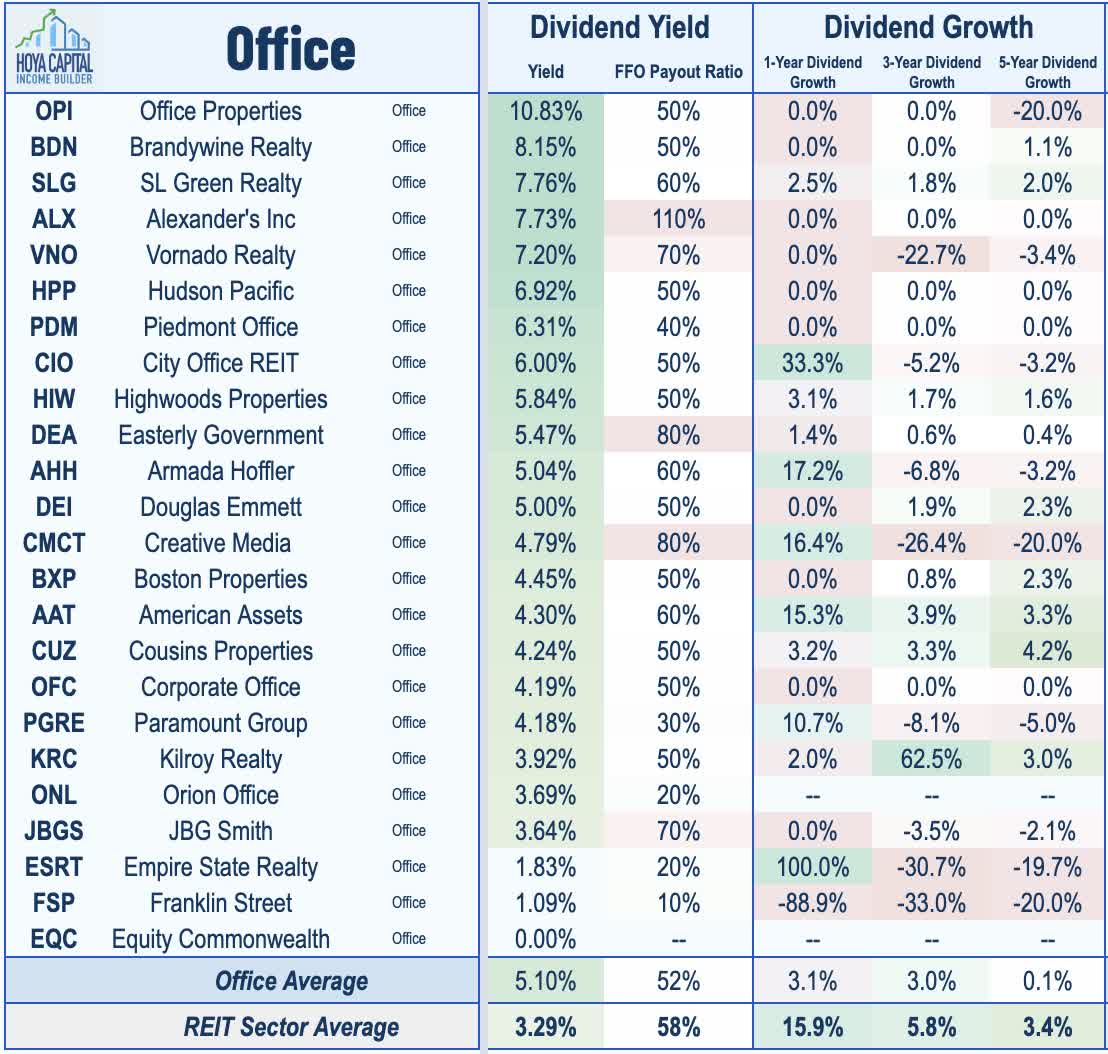
Key Takeaways: It’s All About The Commute
The ‘Return to the Office’ is here – but it’s underwhelming. Despite 80% of employees currently in post-pandemic work arrangements, office utilization rates have remained 40-60% below pre-pandemic levels. As projected, commute times have been the key variable explaining significant differences in WFH adoption across regions. Workers don’t necessarily dislike the office, but long commutes more than offset any productivity gains. Thus, the outlook remains far sunnier in the Sunbelt and in secondary markets with net population growth, shorter commute times, and a more favorable industry mix. We reiterated our bullish outlooks on Sunbelt-focused Highwoods (HIW) and Piedmont (PDM) and see significant mispricing between Sunbelt-focused REITs and their more troubled Coastal-focused peers.
Hoya Capital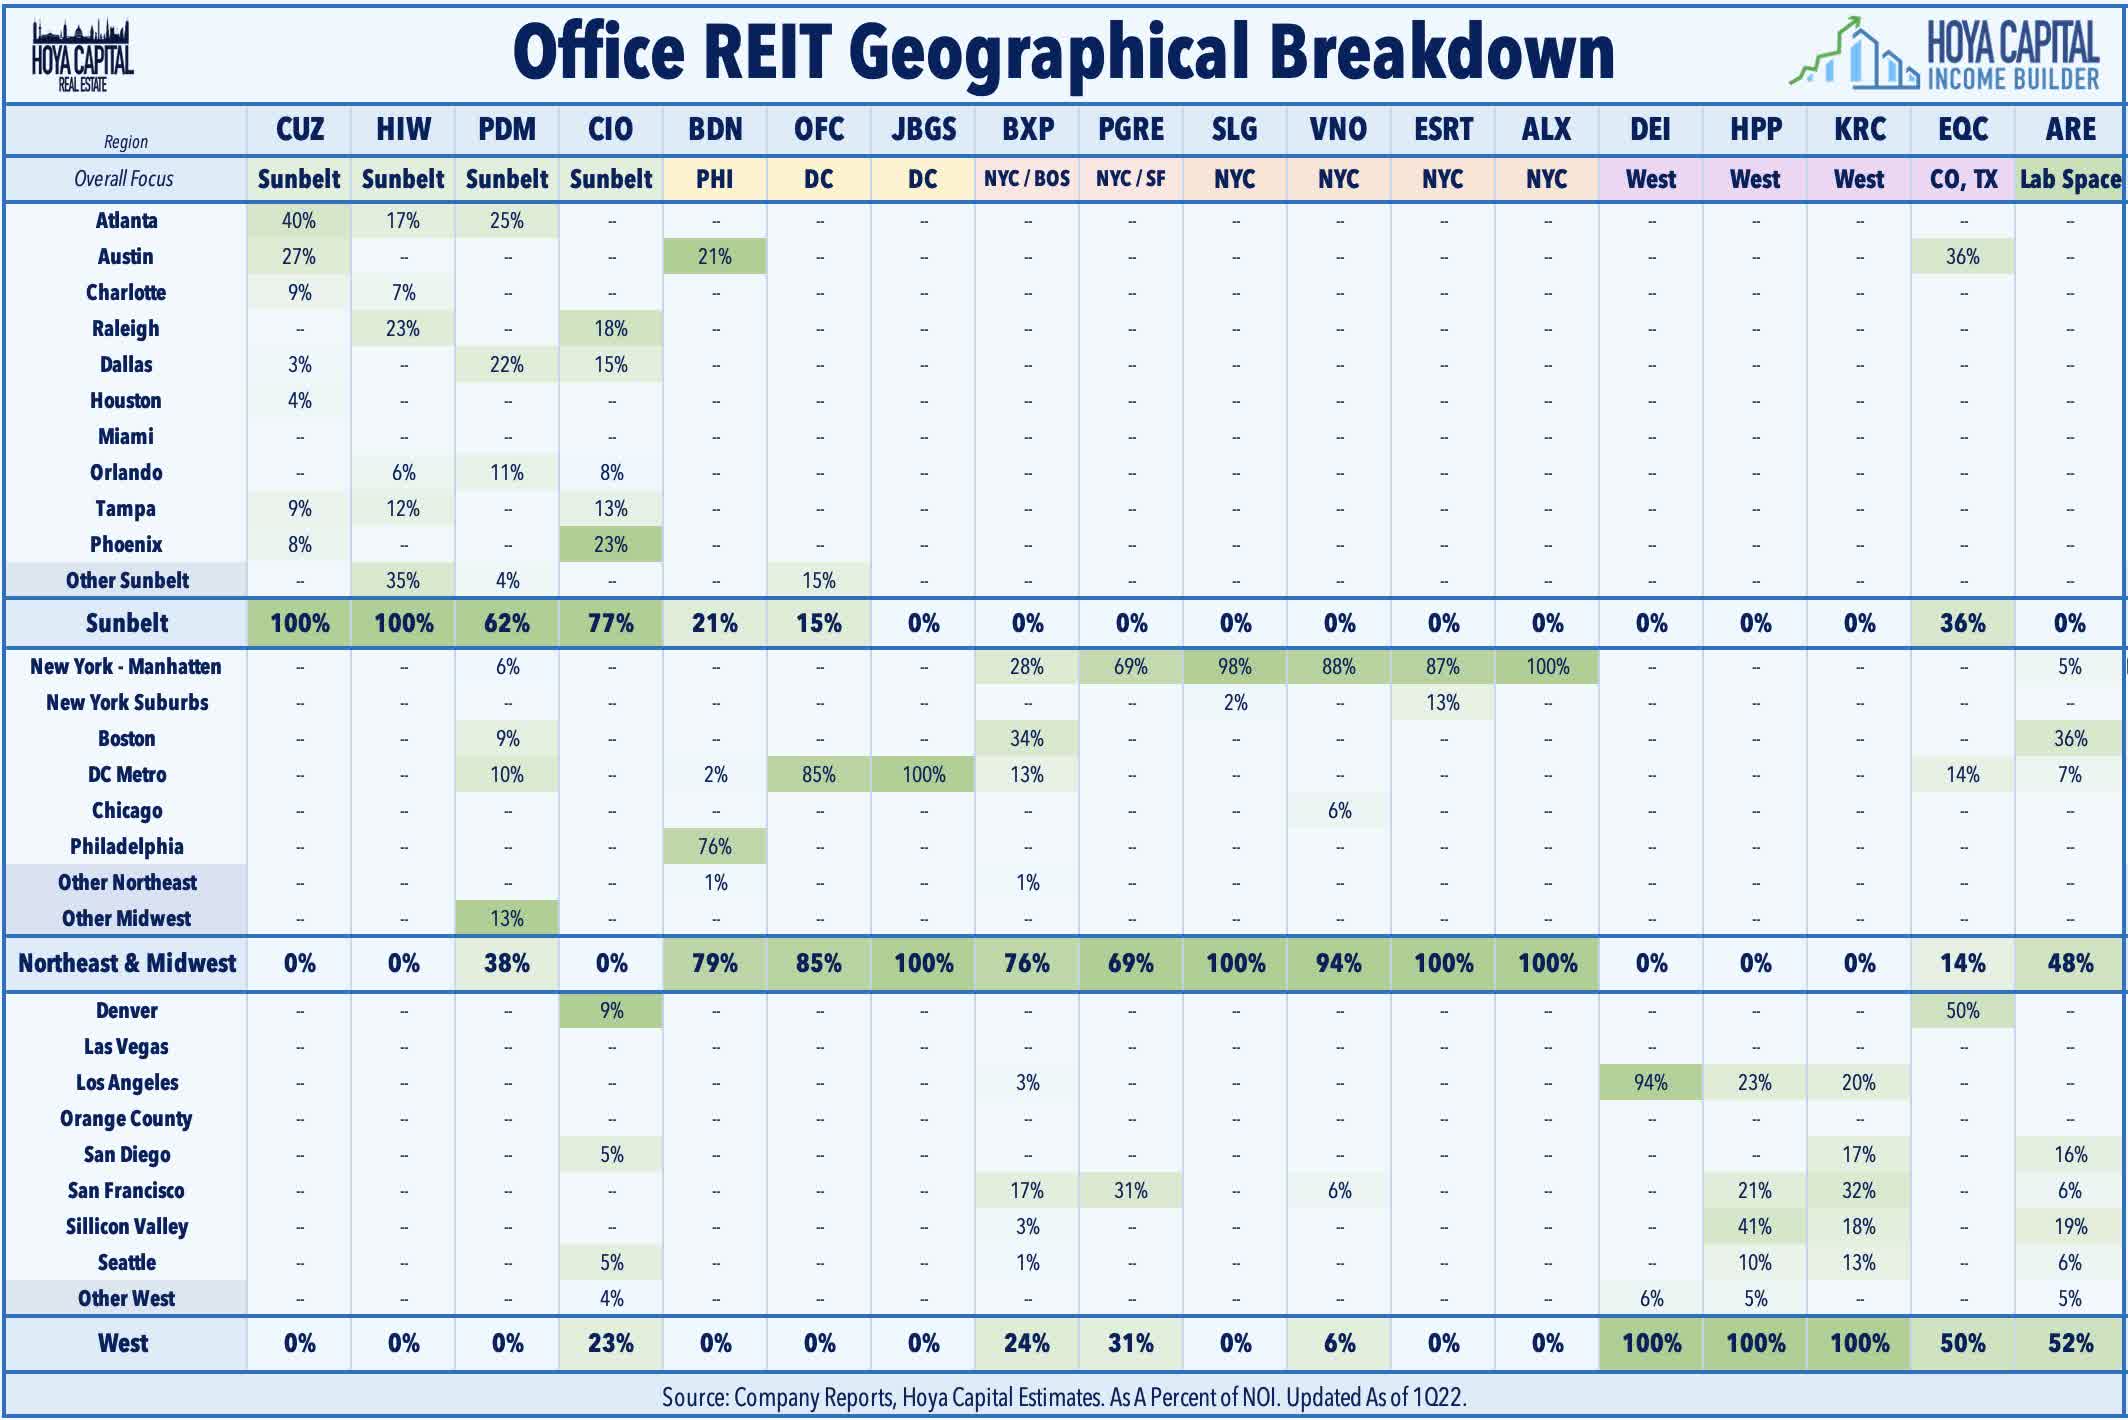
For an in-depth analysis of all real estate sectors, be sure to check out all of our quarterly reports: Apartments, Homebuilders, Manufactured Housing, Student Housing, Single-Family Rentals, Cell Towers, Casinos, Industrial, Data Center, Malls, Healthcare, Net Lease, Shopping Centers, Hotels, Billboards, Office, Farmland, Storage, Timber, Mortgage, and Cannabis.
Disclosure: Hoya Capital Real Estate advises two Exchange-Traded Funds listed on the NYSE. In addition to any long positions listed below, Hoya Capital is long all components in the Hoya Capital Housing 100 Index and in the Hoya Capital High Dividend Yield Index. Index definitions and a complete list of holdings are available on our website.
Hoya Capital
Be the first to comment