Oat_Phawat
Introduction
The Melbourne, Australia-based OceanaGold Corporation (OTCPK:OCANF) reported its third-quarter 2022 earnings results on October 26, 2022.
Note: This article is an update of my article published on May 31, 2022.
This article aims to look at the company’s recent history, including the third quarter earnings, and find a way to invest profitably in this company through fundamental and technical analysis. All charts in this article give several years of history.
Also, here are two crucial news in December:
- On December 13, 2022, OceanaGold announced its drilling program for 2022. It was about Waihi with the Wharekirauponga zone, Haile and the Palomino drill program, and the Didipio mines.
- On December 19, 2022, OceanaGold announced that “the United States Army Corps of Engineers (“ACOE”) has issued the Supplementary Environmental Impact Statement Record of Decision (“SEIS ROD”) and granted a permit under Section 404 of the Clean Water Act (“404 Permit”) for the expansion of the Haile Gold Mine (“Haile”) located in Kershaw, South Carolina. “. The first ore from the Haile underground is on track for the fourth quarter of 2023.
1 – 3Q22 Results Snapshot
OceanaGold posted an expected weak third quarter with a gold production of 104,953 Au Oz and 3,581 Tonnes of copper, generating a revenue of $213.9 million.
The net loss was $6.4 million compared to a gain of $44.9 million in 3Q21. The operating cash flow was $45.0 million in 3Q22, down from $69.0 million in 3Q21.
OCANF 3Q22 Highlights (OCANF Presentation)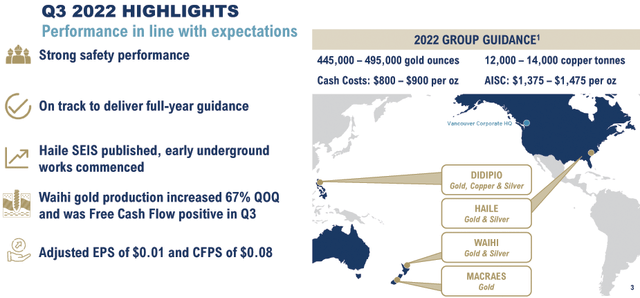
2 – Investment Thesis
OCANF’s performance this quarter has not been stellar. As expected, consolidated production was lower than the previous quarter at 104,953 Au ounces, a 6.6% quarter-over-quarter decrease mainly due to lower grades at Didipio, Macraes, and Haile. I recommend listening to the commodity.tv.com link here.
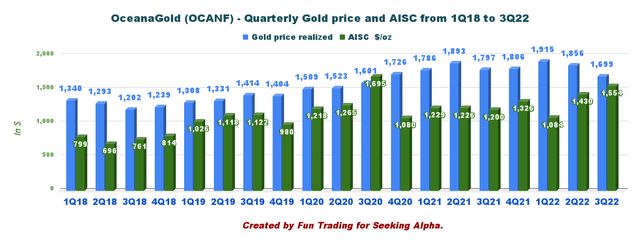
The gold price was not helping either in 3Q22, with a price for gold of $1,699 per ounce due to the Fed’s action against the rampant inflation that threatened the world economy.
However, recently the gold price reversed the trend after the market decided that the FED may turn less hawkish in 2023. Gold is now up over 6% YoY, and the copper price is down 10%, albeit recovering nicely from the lows in July.
OCANF Gold and Copper price one-year basis (Fun Trading StockCharts)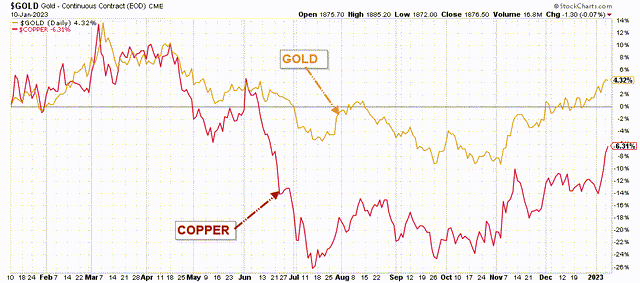
The chart suggests that H2 2023 will be bullish for gold and other metals.
Thus, it is crucial to trade LIFO, a good part of your long-term position (a minimum of 40%-50% is suggested). By taking regular profits off using LIFO and buying back on weaknesses using technical analysis, you will be able to keep a core position for a more substantial gain.
3 – Stock performance
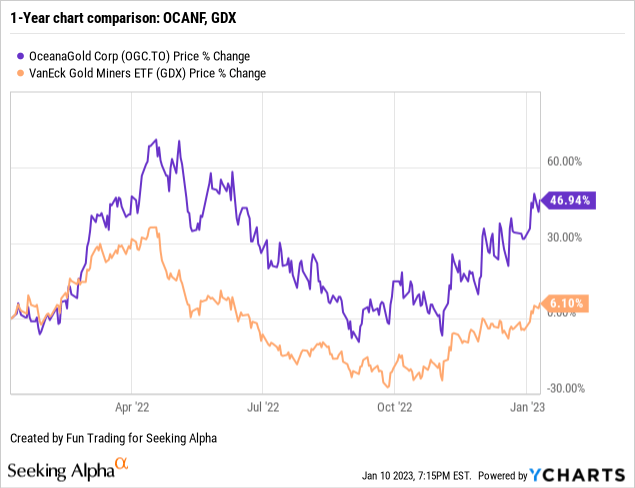
OceanaGold has largely outperformed the VanEck Vectors Gold Miners ETF (GDX) on a one-year basis. The stock is now up 47% year over year.
OceanaGold – Financial Historical Snapshot until 3Q22 – The Raw Numbers
| OceanaGold | 3Q21 | 4Q21 | 1Q22 | 2Q22 | 3Q22 |
| Total Revenues in $ Million | 204.6 | 208.6 | 285.9 | 229.4 | 213.9 |
| Net Income in $ Million | 44.9 | -96.0 | 78.6 | 19.4 | -6.4 |
| EBITDA from company $ Million | 89.2 | -73.5 | 154.9 | 73.6 | 40.4 |
| EPS diluted in $/share | 0.06 | -0.14 | 0.11 | 0.03 | -0.01 |
| Operating Cash flow in $ Million | 69.0 | 109.0 | 143.8 | 79.7 | 45.0 |
| Capital Expenditure in $ Million | 85.0 | 80.8 | 72.1 | 63.7 | 55.5 |
| Free Cash Flow in $ Million | -16.0 | 28.2 | 71.7 | 16.0 | -10.5 |
| Total Cash $ Million | 113.2 | 133.0 | 194.7 | 150.2 | 130.2 |
| Long-term debt In $ Million | 257.0 | 256.2 | 254.0 | 204.4 | 204.2 |
| Shares outstanding (diluted) in Million | 718.2 | 719 | 717.2 | 719.7 | 718.7 |
| Producing assets | 3Q21 | 4Q21 | 1Q22 | 2Q22 | 3Q22 |
| Gold production in K Au Oz | 79.12 | 106.6 | 134.0 | 112.4 | 105.0 |
| Gold production sold | 97.45 | 105.4 | 129.2 | 109.8 | 111.4 |
| Gold price realized | 1,797 | 1,806 | 1,915 | 1,856 | 1,699 |
| AISC $/oz | 1,200 | 1,326 | 1,084 | 1,430 | 1,554 |
| Mines | 3Q21 | 4Q21 | 1Q22 | 2Q22 | 3Q22 |
| Haile | 45.9 | 42.5 | 60.2 | 38.0 | 36.5 |
| Macraes | 25.7 | 37.3 | 37.6 | 36.9 | 29.4 |
| Waihi | 7.5 | 12.0 | 6.8 | 8.2 | 13.7 |
| Didipio | 0 | 14.9 | 29.4 | 29.3 | 25.4 |
Data Source: Company release
Gold Production And Balance Sheet Details
1 – Revenues were $213.9 million in 3Q22
OCANF Quarterly revenues history (Fun Trading)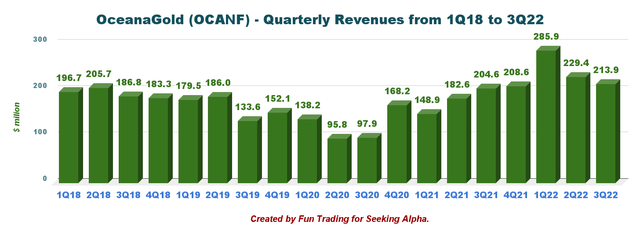
Scott Sullivan, Acting President and CEO of OceanaGold, said in the conference call:
I am happy to say that our third quarter results were broadly in line with plan and while it was the low quarter for production, as we guided to at the start of the year, we achieved some significant accomplishments in the period.
2 – Free cash flow was a loss of $10.5 million in 3Q22
OCANF Quarterly Free Cash flow history (Fun Trading)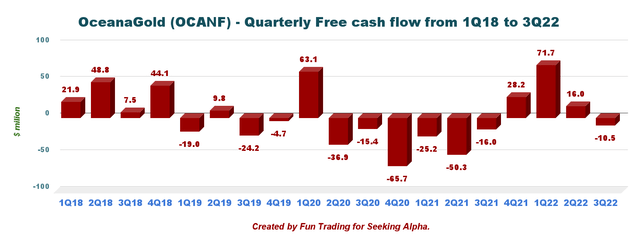
Trailing 12-month free cash flow was $105.4 million, with a loss estimated at $10.5 million for the third quarter of 2022.
3 – Gold production details. Total production was 104,953 Au Oz and 3,581 Tons Cu in 3Q22. (The company sold 111,390 Au Oz).
The consolidated third-quarter gold production was 104,953 ounces and 3,581 tonnes of copper, at an AISC of $1,554 per ounce on 111,390 ounces of gold sales and 3,581 tonnes of Copper. Gold production decreased by 6.9% compared to the previous quarter and a 32.8% increase compared to the third quarter of 2021.
OCANF Quarterly Gold Production History (Fun Trading)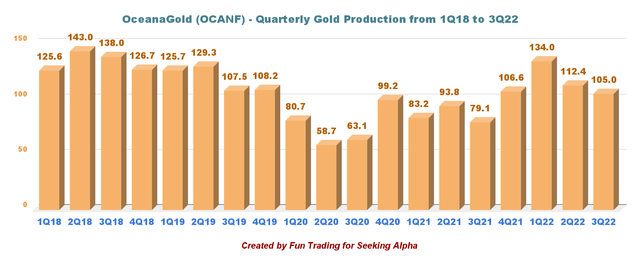
Didipio produced 25.4k Au ounces of gold and 3,581 tonnes of copper this quarter. Haile, Macraes, and Didipio showed a lower production sequentially.
OCANF Quarterly production per mine history (Fun Trading) OCANF Quarterly Gold price and AISC history (Fun Trading)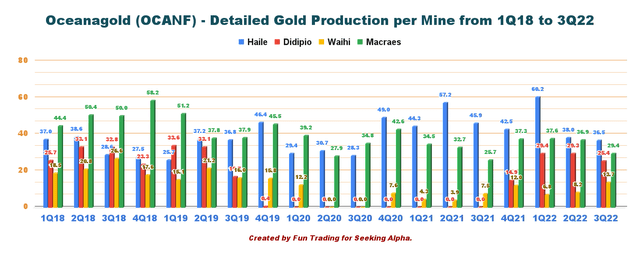
4 – Debt and liquidity
OCANF Quarterly Cash versus debt history (Fun Trading)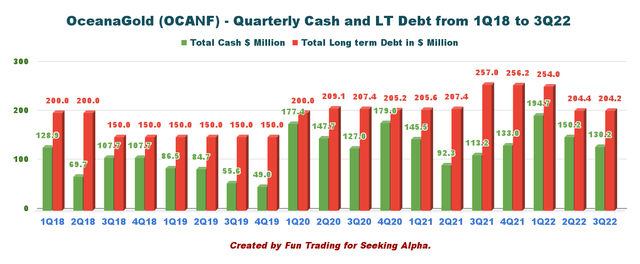
5 – Full-year 2022 guidance unchanged
Full-year 2022 production guidance remains at 445K oz to 495K oz gold ounces at an AISC of $1,275 to $1,375 per ounce sold and cash costs of $675 to $775 per ounce sold. CapEx for 2022 has come down to $250 million from $285 million.
OCANF 2022 Guidance (OCANF Presentation)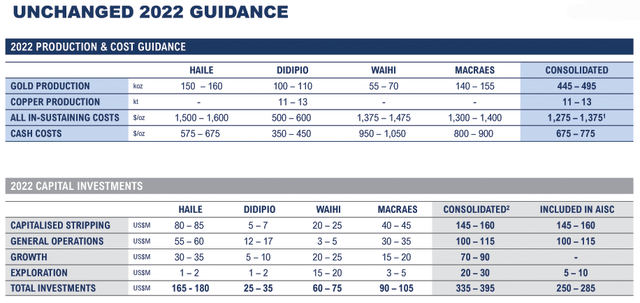
CEO Gerard Bond said in the conference call:
I am also happy to report that we remain on track to deliver our full year guidance. We produced 351,000 ounces of gold year-to-date, which puts us pretty much bang on 75% of the midpoint of our full year gold production guidance range. With a strong fourth quarter expected due to higher grades at Haile, we remain well on the way to delivering on this key commitment to the market.
Technical Analysis and commentary
OCANF TA chart short-term (Fun Trading SotckCharts)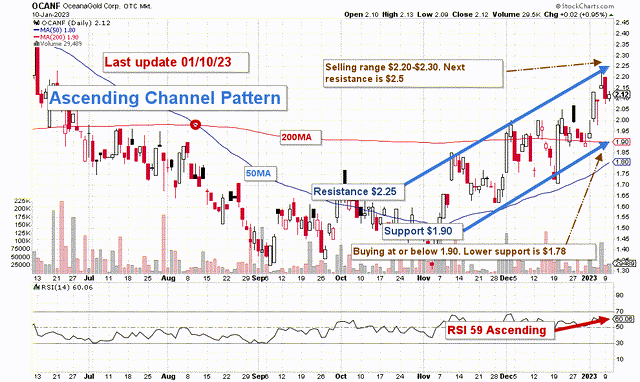
OCANF forms an ascending channel pattern with resistance at $2.25 and support at $1.90.
Ascending channel patterns or rising channels are short-term bullish in that a stock moves higher within an ascending channel, but these patterns often form within longer-term downtrends as continuation patterns. The ascending channel pattern is often followed by lower prices.
The short-term trading strategy is to trade LIFO about 45-55% of your position and keep a core long-term amount for a much higher payday. I suggest selling between $2.20 and $2.30 with possible higher resistance at $2.50. I recommend buying at or below $1.90 with possible lower support of $1.78.
Watch the gold price like a hawk.
Warning: The TA chart must be updated frequently to be relevant. It is what I am doing in my stock tracker. The chart above has a possible validity of about a week. Remember, the TA chart is a tool only to help you adopt the right strategy. It is not a way to foresee the future. No one and nothing can.
Author’s note: If you find value in this article and would like to encourage such continued efforts, please click the “Like” button below as a vote of support. Thanks.
Editor’s Note: This article discusses one or more securities that do not trade on a major U.S. exchange. Please be aware of the risks associated with these stocks.


Be the first to comment