

David Becker
Thesis
NVIDIA Corporation (NASDAQ:NVDA) reported mixed Q3 results, and it is scheduled to report its 4th Quarter FY23 financial results on Feb 22, 2023. Its Q3 revenue fell to $5.93 billion. New export controls and lingering supply-chain disruptions kept their pressure on the top line. NVIDIA is no longer permitted to export products such as the A100 and H100 to China. And as such, I anticipate these headwinds to persist well into Q4.
Furthermore, the gaming revenue is down 51% from the year prior. And as detailed in my earlier article, this may be related to crypto-currency headwinds and is another headwind that I anticipate to continue (or even worsen) into 2023. And finally, the bottom line was also weighed down by high inflation, higher compensation expenses, and also headcount growth alongside elevated infrastructure expenses. On the bright side, negative impacts from these above headwinds were partially offset by higher demand from cloud providers and the automotive segment. In particular, the auto segment performed remarkably well, with revenues up 86% from a year ago.
Overall, I see a quite uncertain picture for NVDA and do not expect much recovery in Q4 for NVDA. I expect to see the global PC market remain softened in Q4. The global PC market was boosted in an unexpected way by the COVID pandemic. And now the “COVID bonus” is largely over and PC demand is in the process of renormalization, as argued in this IDC report. Even if the PC market recovers, NVDA has a large existing inventory that it needs to clear first (possibly at reduced prices), as detailed in my earlier article, and won’t be able to benefit from the recovery immediately.
These uncertainties are reflected in the large divergence of opinions among analysts as shown in their consensus estimates in the chart below. As you can see, a total of 36 analysts provided revenue revisions for NVDA in the past 3 months. And 24 of them provided downward revisions and 12 provided upward revisions.
And next, I will look beyond these immediate issues and form a broader view. And you will see my outlook for the next 5 years also shows quite limited upside potential.
Source: Seeking Alpha data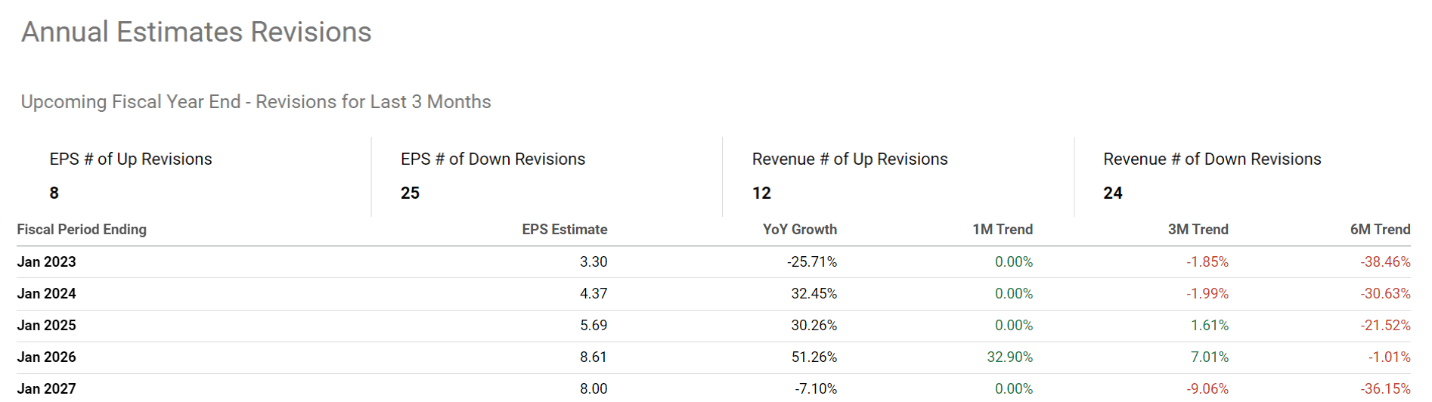
NVDA’s historical performance and return drivers
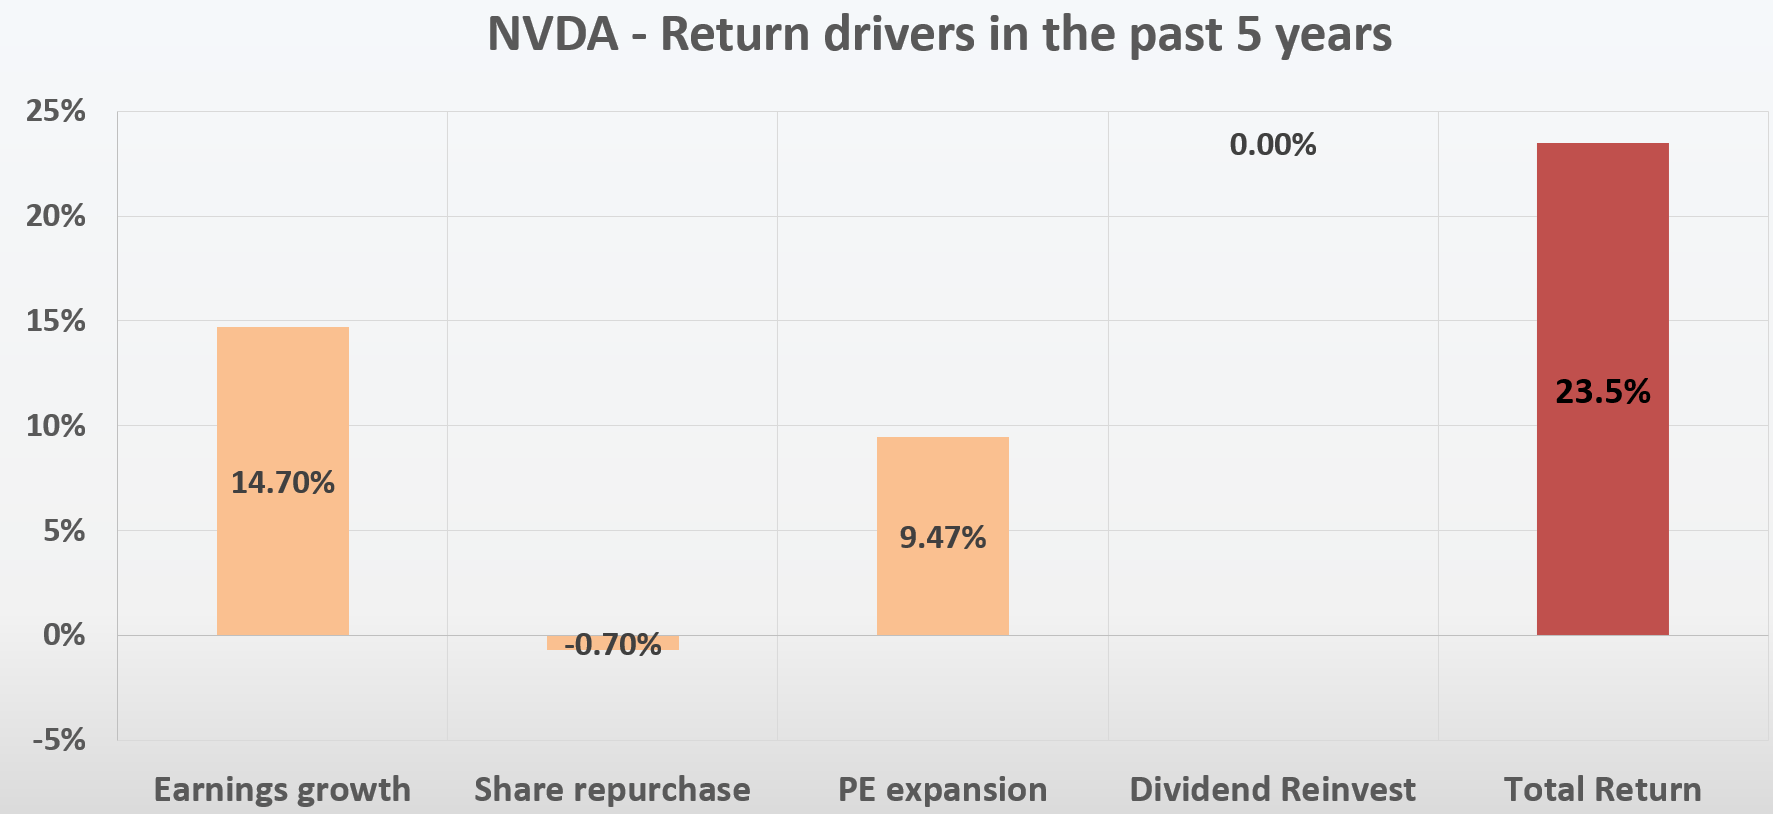
Despite the sharp correction this year, NVDA investors who stayed with the stock in the past 5 years have been rewarded fabulously as you can see in the next plot. Even with about half of the accumulated gain evaporated during 2022, NVDA investors still enjoyed a total return of 187% in the past 5 years, translating into an annual CAGR 23.5%, more than doubling the broader tech sector’s return.
Source: Seeking Alpha data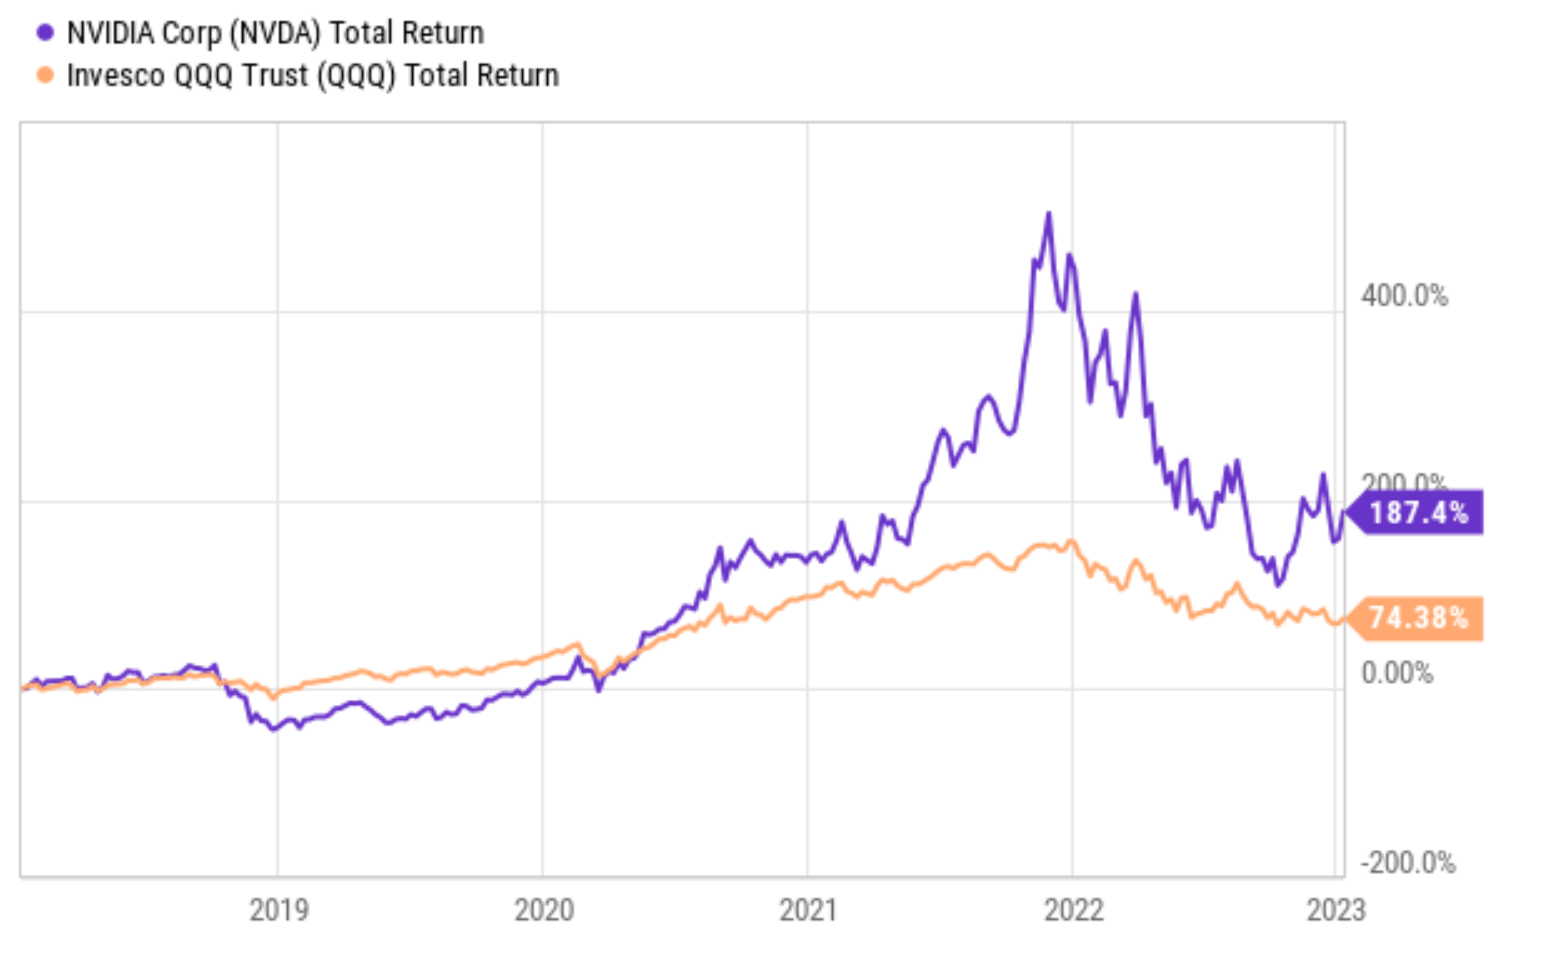
Looking a bit deeper, the underlying drivers are primarily profit growth and P/E expansion. In the past 5 years, NVDA grew its earnings at a CAGR of 14.7% as shown in the top panel of the next chart, essentially doubling its total profit of ~$3B 5 years ago to the current ~$6B level. On an EPS basis, share dilution canceled off a little bit of the profit growth. As shown in the bottom portion of the plot, NVDA’s outstanding share count climbed slightly from 2.42B shares in 2018 to the current 2.53B, translating into an annual dilution rate of 0.7%. Thus, its EPS grew at about 14.0% CAGR. Then the valuation expansion did the rest of the job, contributing 9.47% per annum to the total return as shown in the second chart below.
Now, naturally, the next question is: would these above drivers keep going for the next 5 years?
In the remainder of this article, you will see that my answer is twofold. I anticipate the EPS growth to maintain at a good mid-teen digit. However, I anticipate the P/E multiple to contract instead of expanding and therefore offset a good part of the EPS growth.
Source: Author based on Seeking Alpha data Source: Author based on Seeking Alpha data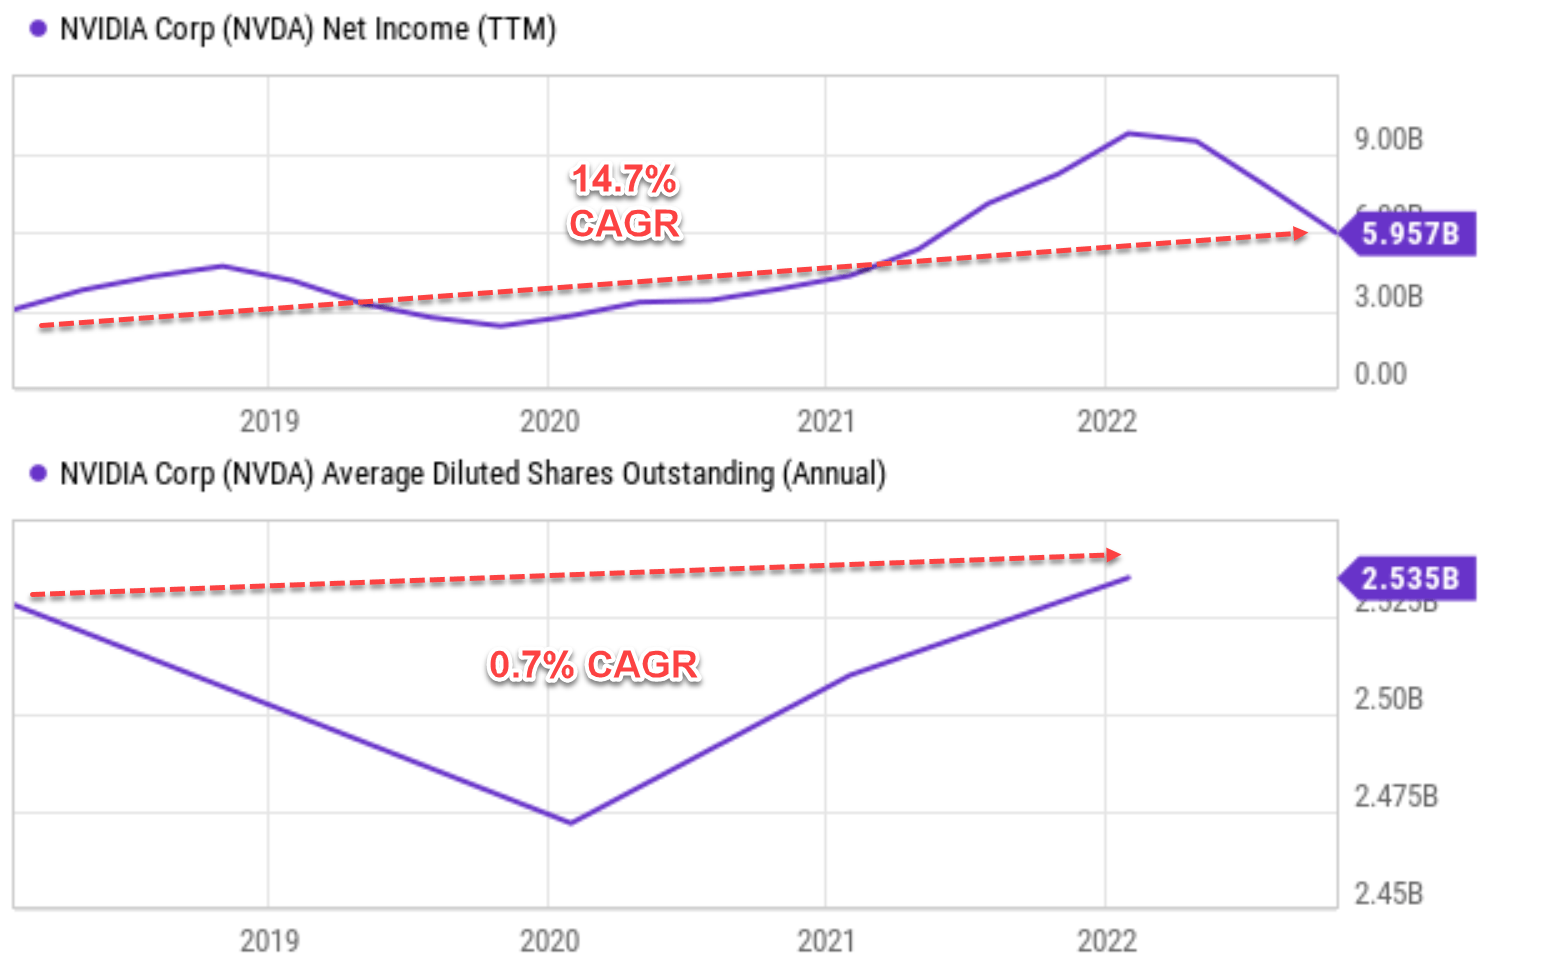
NVDA: P/E is still lofty and will likely contract
Let me first explain why I anticipate its P/E multiple to contract in the years to come. The following plot illustrates its P/E ratio in the past 5 years together with its close peers Advanced Micro Devices, Inc. (AMD) and Intel (INTC). As seen, the P/E for NVDA hovers around 67x now, not only lofty in an absolute sense but also far higher than its peers. To wit, AMD trades “only” at ~40.7x and Intel only at ~9x.
Indeed, the recent large price corrections have deflated its valuation risks substantially. But the issue is that its valuation was in such a bubble regime (over 100+ P/E) before the correction, and I am still seeing some valuation risks here even with its price almost halved during 2022.
And next, I will also argue that its profitability is not that superior to AMD, and I found its large valuation premium over AMD difficult to justify.
Source: Seeking Alpha data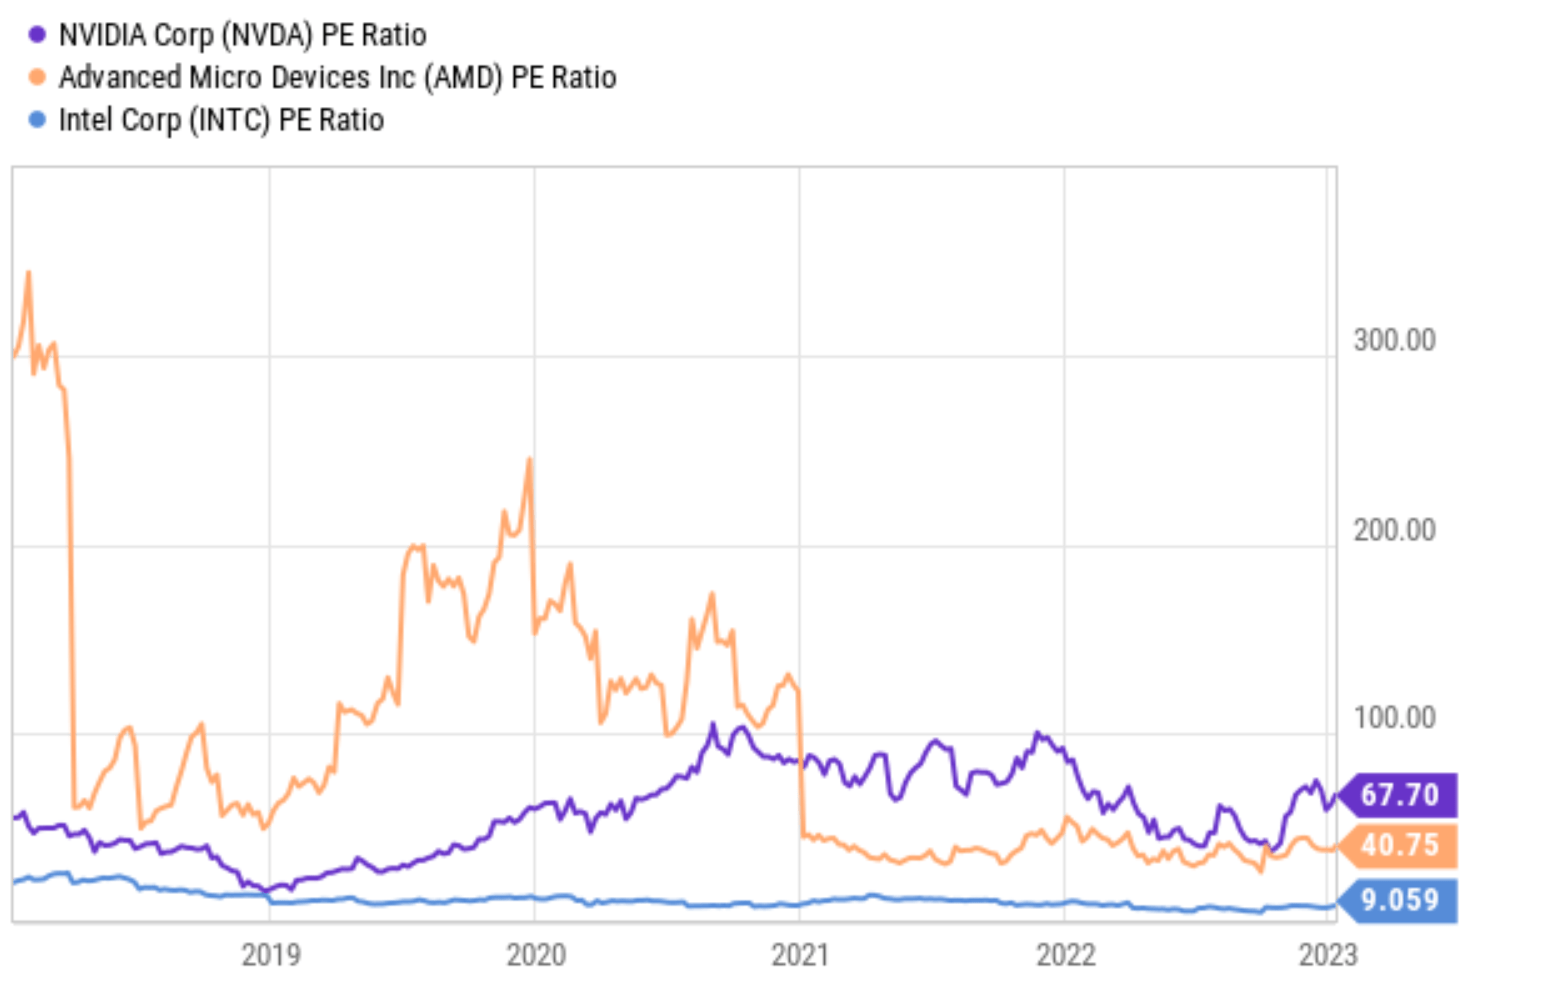
Profitability and EPS growth projections
As seen, consensus estimates forecast a 19.3% CAGR for its EPS growth in the next 5 years. At this rate, the projected EPS would more than double from the 2023 level of $3.3 to reach $8 in 2027.
Source: Author based on Seeking Alpha data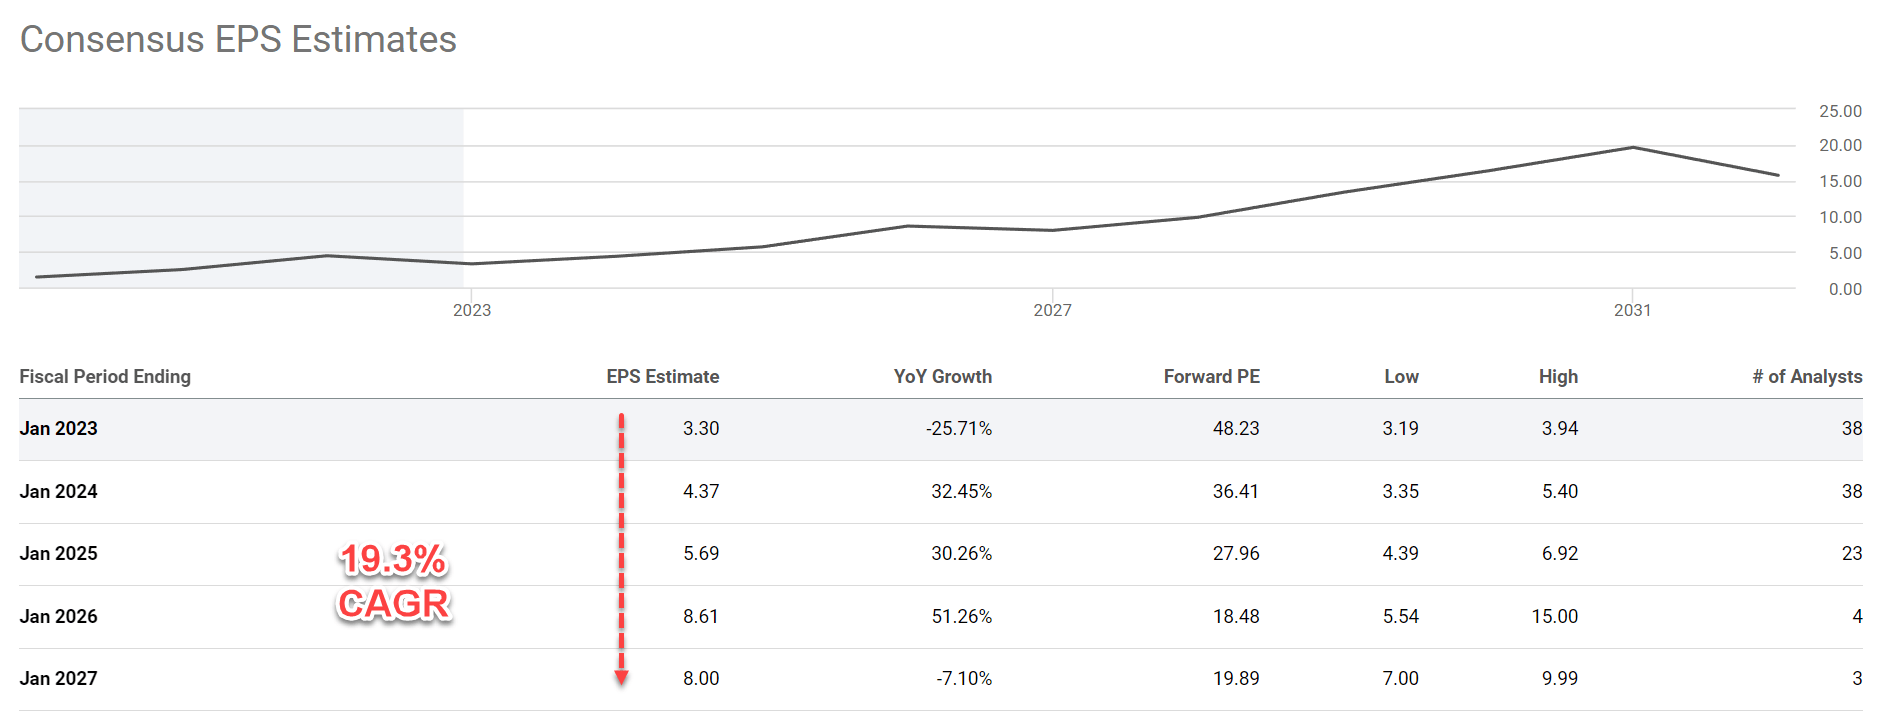
Readers familiar with my approach know that I always like to form my own estimate based on ROCE (return on capital employed) and reinvestment rate (“RR”). And my estimate is a bit lower than the above consensus estimates. The detail of the approach is provided in my other articles and the essence is that growth rate in the long term is simply ROCE * Reinvestment Rate.
Here I will just directly quote the results in the next chart. As seen, NVDA is maintaining a ROCE on average of ~60% in recent years. The chart also shows the ROCE of AMD, whose current ROCE is on average 49%. Hence, some valuation is definitely justified for NVDA since its ROCE is about 20% better than AMD. But I think a ~70% P/E premium is too much (67x P/E vs AMD’s 40x P/E).
Source: Author based on Seeking Alpha data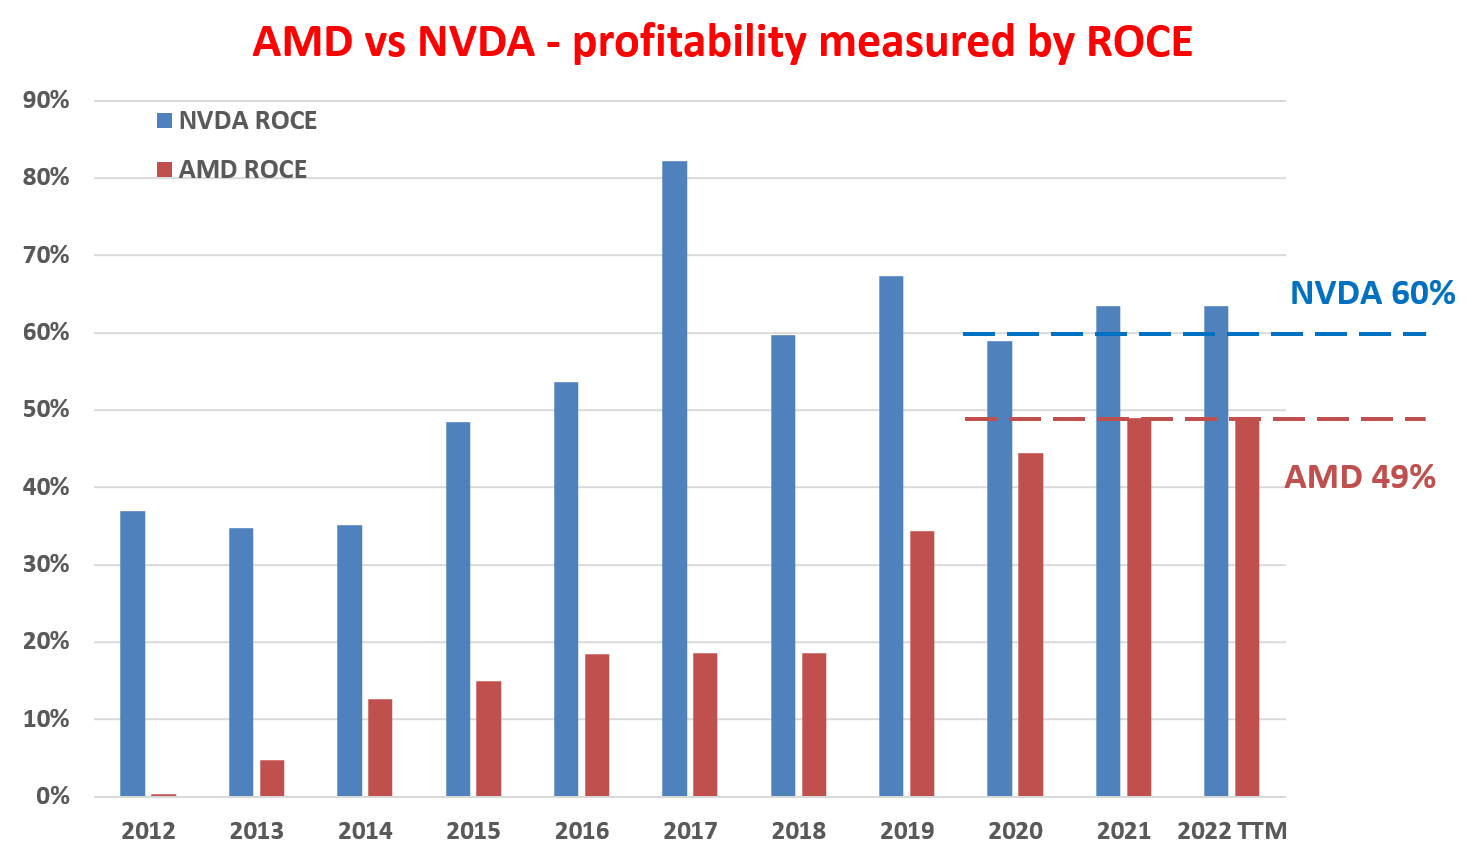
The company has been maintaining a RR of about 15% in recent years. And as detailed in my other article, the CHIPS act is very likely to further boost its RR to the 20% range. Such boosts will come in both direct ways (like direct subsidies) and also indirect ways due (such as tax credits and having its R&D needs to be met by national labs and/or universities).
With its ROCE and RR, the table below displays my projections for its growth rate in the next few years. As seen, I am projecting growth rates in the range of 11.5% to 15.5%, a bit slower than the above consensus estimates. Also note that in these projections, I added a 2.5% inflation factor to the growth rate. The growth rate calculated by ROCE*RR is the real growth with inflation excluded.
Source: Author based on Seeking Alpha data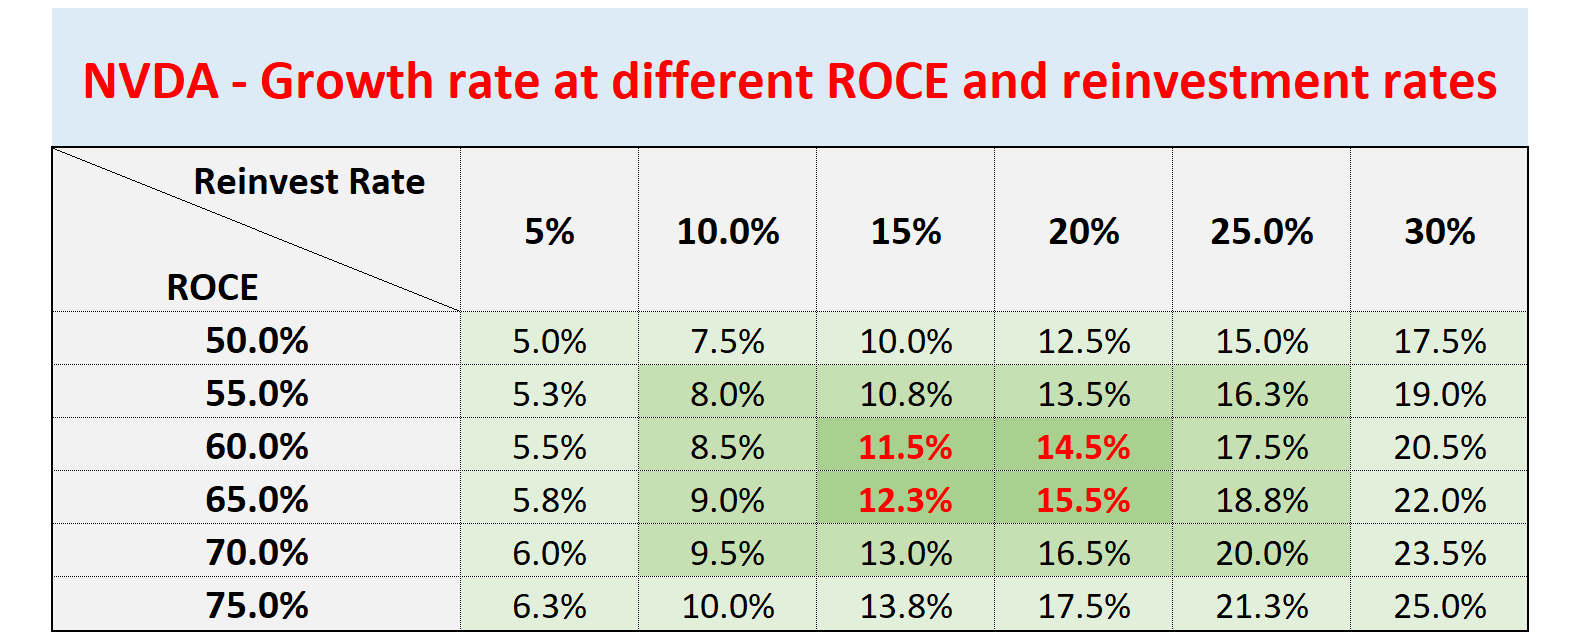
NVDA’s return potential for the next 5 years
The next plot puts together all the above pieces and summarizes my return projections for the next five years. A few key comments:
- My projections took the 19.3% EPS growth rates projected by consensus estimates. And as just mentioned, it is on the aggressive side.
- My projections are based on the assumption of a P/E contraction to 40x. As argued earlier, I see NVDA’s current 67x P/E too hard to justify and a 40x P/E is still quite high. To put it under a broader perspective, the average P/E of the semiconductor sector represented by SMH is about 20x and so is the overall tech sector represented by QQQ. Such a P/E contraction would cancel off 11.1% of the EPS growth.
- And all told, my projection for its total return potential is in the range of 8% in the next 5 years.
Source: Author based on Seeking Alpha data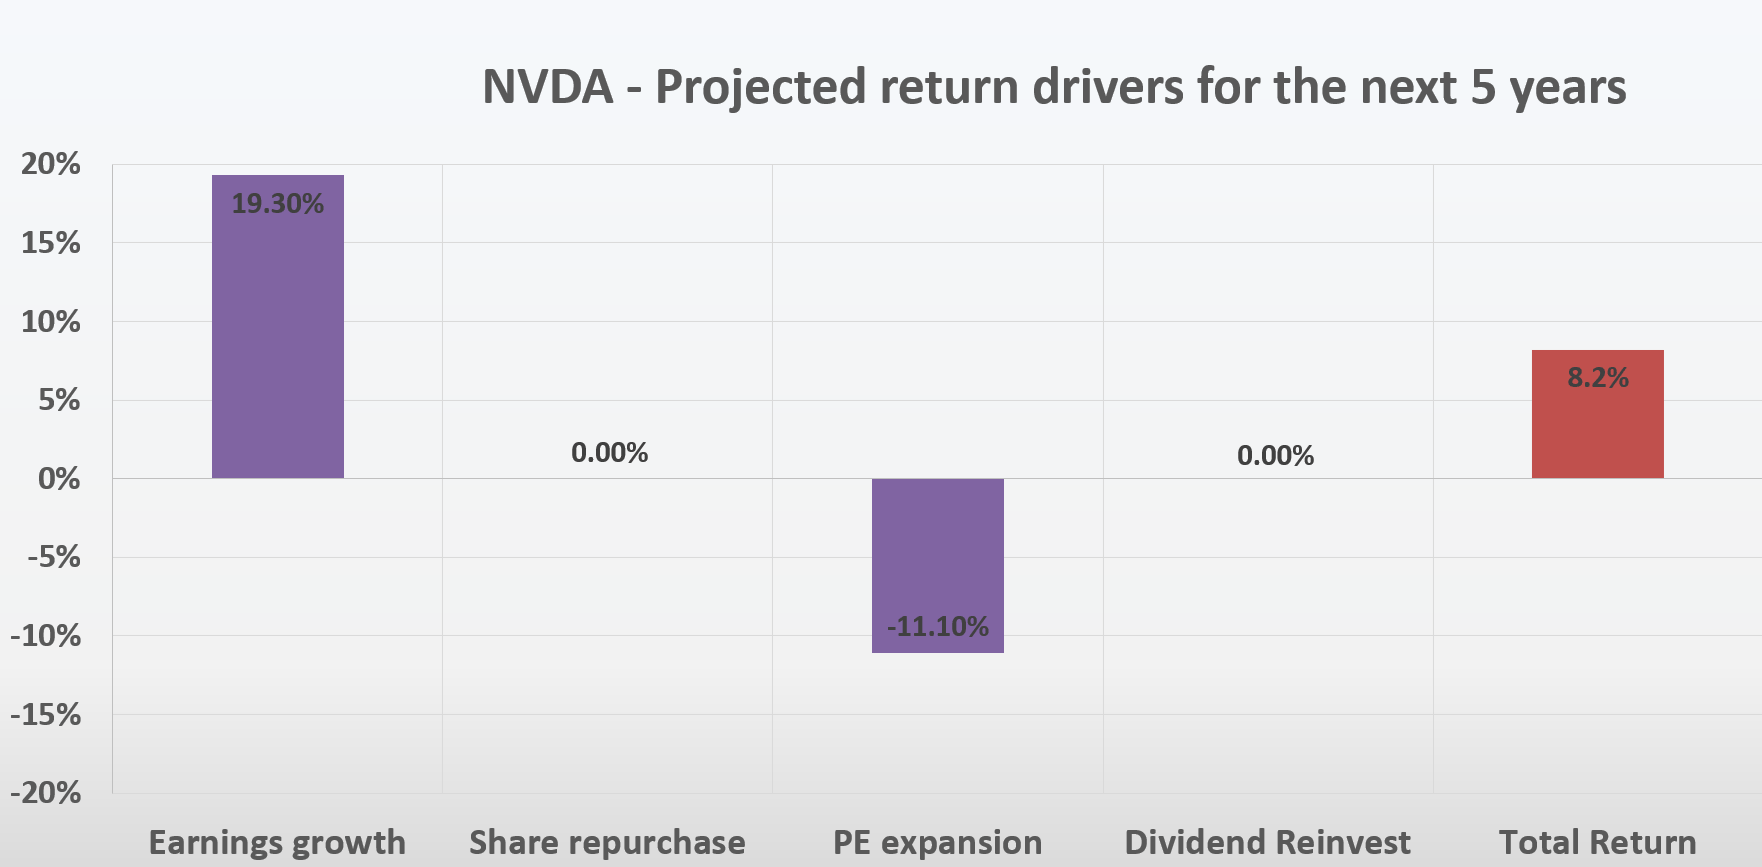
Risks and final thoughts
To recap, I see NVDA faces many uncertainties in the immediate future. These headwinds include the export controls recently imposed, lingering supply-chain disruptions, the gaming revenue slowdown, crypto-currency headwinds, and the general global PC market renormalization. These are the issues that I would pay special attention to in the upcoming Q4 earnings report.
On the positive side, the business is well-poised to capitalize on a robust secular growth curve in the chip sector. Sometimes, the prediction of longer-term returns is easier than short-term returns. The business enjoys a robust ROCE and also a sustainable reinvestment rate, further boosted by the CHIPS act in the years to come. As such, I won’t be surprised to see rapid EPS growth rates in the range of 15% to 20%.
All told, I am anticipating an upper-single-digit annual return rate for NVDA in the next 5 years. The recent large price corrections have deflated its valuation risks substantially (from 100+ P/E to the current 67x). But a 67x P/E is still quite lofty in my view. And I do anticipate some P/E contraction in the years to come, canceling off a good part of NVDA’s EPS growth.
Be the first to comment