

kvkirillov/iStock via Getty Images
Strategy and portfolio
The Nationwide Nasdaq-100 Risk-Managed Income ETF (NYSEARCA:NUSI) is an actively-managed ETF launched on 12/19/2019. It has 103 holdings, a 12-month distribution yield of 9.5% and a total expense ratio of 0.68%. It is a competitor of the Nasdaq 100 Covered Call ETF (QYLD). Both funds invest in stocks of the Nasdaq 100 index and aim at generating income and temper volatility with option strategies. The table below summarizes their characteristics. QYLD is an older fund with more assets under management and higher liquidity.
|
NUSI |
QYLD |
|
|
AUM |
$471M |
$6.78B |
|
Avg Daily Volume |
137K |
3.49M |
|
Expense Ratio |
0.68% |
0.60% |
|
Inception |
12/19/2019 |
12/11/2013 |
|
Underlying Index |
None, actively managed |
CBOE NASDAQ-100 BuyWrite V2 Index |
|
Option strategies |
Collars (selling calls and buying puts) on the Nasdaq 100 index |
Buy-Write (selling covered calls) on the Nasdaq 100 index |
As described by Nationwide, NUSI “seeks to generate high current income on a monthly basis from a combination of the dividends received from the Fund’s equity holdings and the premiums earned from the options collar. The options collar seeks to generate a net-credit by receiving premium from the sale of the call options that is greater than the cost of buying the protective put options. The options collar is designed to reduce the Fund’s volatility and provide a measure of downside protection.” Therefore, NUSI’s option strategy is a bit more sophisticated than QYLD’s covered calls. As it is not described by a rule-based underlying index, it is also less transparent.
The next table shows the top 10 holdings of NUSI, QYLD and the Nasdaq 100 ETF by Invesco (QQQ), with their weights in % of asset value:
|
Ticker |
Name |
NUSI |
QYLD |
QQQ |
|
APPLE INC. |
12.10% |
13.43% |
12.15% |
|
|
MICROSOFT CORP. |
11.74% |
13.03% |
11.79% |
|
|
AMAZON.COM INC. |
6.46% |
7.17% |
6.48% |
|
|
NVIDIA CORPORATION |
4.12% |
4.58% |
4.14% |
|
|
ALPHABET INC. |
3.92% |
4.35% |
3.94% |
|
|
ALPHABET INC. |
3.90% |
4.33% |
3.92% |
|
|
TESLA INC. |
3.67% |
4.08% |
3.69% |
|
|
META PLATFORMS INC. |
3.33% |
3.70% |
3.34% |
|
|
BROADCOM INC. |
1.93% |
2.13% |
1.93% |
|
|
PEPSICO INC. |
1.85% |
2.05% |
1.86% |
QYLD holds a short position in Nasdaq 100 calls (as of writing, NDX US 02/17/23 C11425), with a weight about -10.5%. As the weight is negative, it doesn’t appear in the top 10, but it should be in 3rd position in absolute value. All stock positions are about 10% heavier in QYLD than in QQQ, with an aggregate weight of 110.5% of asset value. In summary, QYLD is about 110% long and 10% short. The Nasdaq 100 is leveraged by a factor 1.1.
NUSI is very close to QQQ for every holding weight. The short calls and long puts are likely meant to offset each other in value. This is a supposition: the strategy is not detailed in the prospectus.
Total Return
The next table and chart compares the 3 funds in the last 3 years, reinvesting dividends.
|
Total Return |
Annual.Return |
Drawdown |
Sharpe ratio |
Volatility |
|
|
NUSI |
-5.24% |
-1.78% |
-31.24% |
-0.13 |
13.67% |
|
QYLD |
1.87% |
0.62% |
-24.75% |
0.07 |
16.59% |
|
QQQ |
35.60% |
10.68% |
-35.12% |
0.49 |
26.51% |
Both NUSI and QYLD have lagged their parent index in this time interval. NUSI is the worst performer, but it shows a lower volatility measured in standard deviation of weekly returns.
NUSI, QYLD, QQQ, trailing 3 years (Portfolio123)
In the last 6 months, NUSI beats both QQQ and QYLD by a short margin, thanks to a shallow drawdown. Once again, this recent period shows a significant “visual” difference in volatility between the funds.
NUSI, QYLD, QQQ, trailing 6 months (Portfolio123)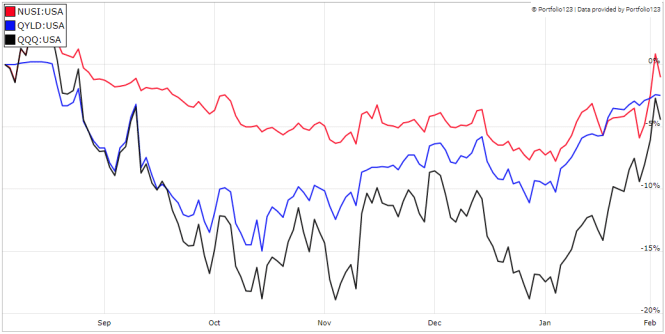
Capital decay
The next chart plots share prices of the 3 funds, again in the last 3 years. NUSI and QYLD have suffered a capital decay over 25%. Unlike in the total return chart, NUSI is ahead of QYLD
NUSI, QYLD, QQQ, share price, trailing 3 years (Seeking Alpha)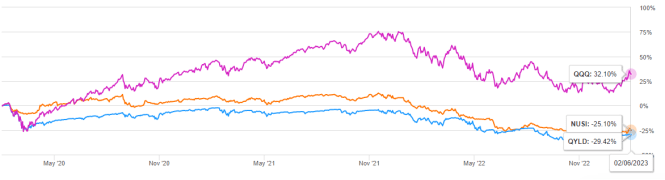
Distributions
The next chart plots annualized distribution rates from 2020 to 2022.
Distribution rates (chart: author)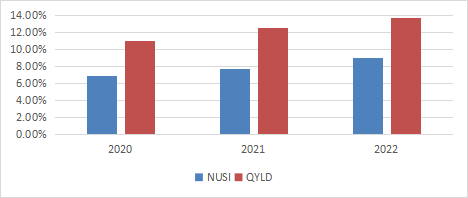
Rates went up, but only because share prices fell sharply. In fact, distributions per share went down:
- $1.90 in 2020 and $1.67 in 2022 for NUSI.
- $2.54 in 2020 and $2.19 in 2022 for QYLD
Takeaway
A 3-year history may be too short to assess NUSI strategy. The next table summarizes which, of NUSI and QYLD, looks the best regarding a few points.
|
3-year total return |
QYLD |
|
Volatility (lower is better) |
NUSI |
|
Yield |
QYLD |
|
Capital preservation |
NUSI |
|
Income growth |
None |
However, the conclusion is that none of these two funds looks attractive. Both have lost over 25% in share price and 13% in distributions through the 2020 pandemic meltdown and the 2022 bear market. They are far behind their parent index in return and risk-adjusted performance. Their thesis aiming at protecting investors in volatile times is yet to be proven.
Be the first to comment