

baona/iStock via Getty Images
We enter the big Fed meeting next week, where the consensus is for the central bank to hike interest rates by 75 bps. This move is likely already expected by the market, given that the Fed had been actively communicating its action plan since weeks ago.
As such, we may see risk assets rally on “bad news”. Given that the market is a forward-looking mechanism, I would not be surprised. I am also heartened by the number of good-quality technical setups that are out there in the market. This, despite the general weakness in the indices and the broad market.
One example of a leading stock that is bucking the broad weakness in the market is Enphase (ENPH). It is also setting up very well.
From the daily chart of ENPH below, we may observe that the stock has been building two robust flag patterns, one atop the other. The first big rally came after earnings in July, which was supported by a healthy spike in volume.
Daily Chart: ENPH
Tradingview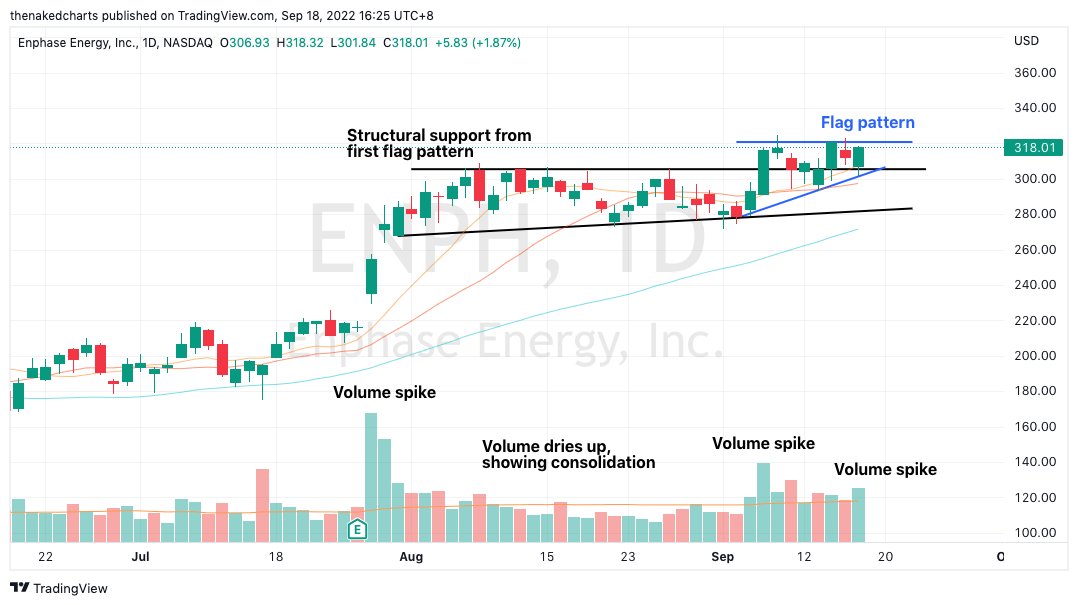
The stock then digested the strong run up, and took about a month to consolidate and build a big flag pattern. This sideways action coincided with volume drying up, which shows selling supply of the stock decreasing. Moving averages also started to converge and catch up with the price.
ENPH broke out from the first flag on 7 September, a move that was backed by a rise in volume. It is now building a second flag pattern, and looks likely to breakout to new highs soon.
The fact that ENPH is trading near its all-time high is testament to its strength. Furthermore, it is not a value / commodity stock, which are expected to perform well under a higher inflation narrative. ENPH is a growth stock, in the solar sector, which has been outperforming the broad market.
Below is the weekly chart of the Invesco Solar ETF (TAN). We may observe that the sector ETF has broken out higher from a 7 month base. TAN had a massive run up back in 2020, and after peaking in January this year, the sector has spent months consolidating and building a big base.
Weekly Chart: TAN
Tradingview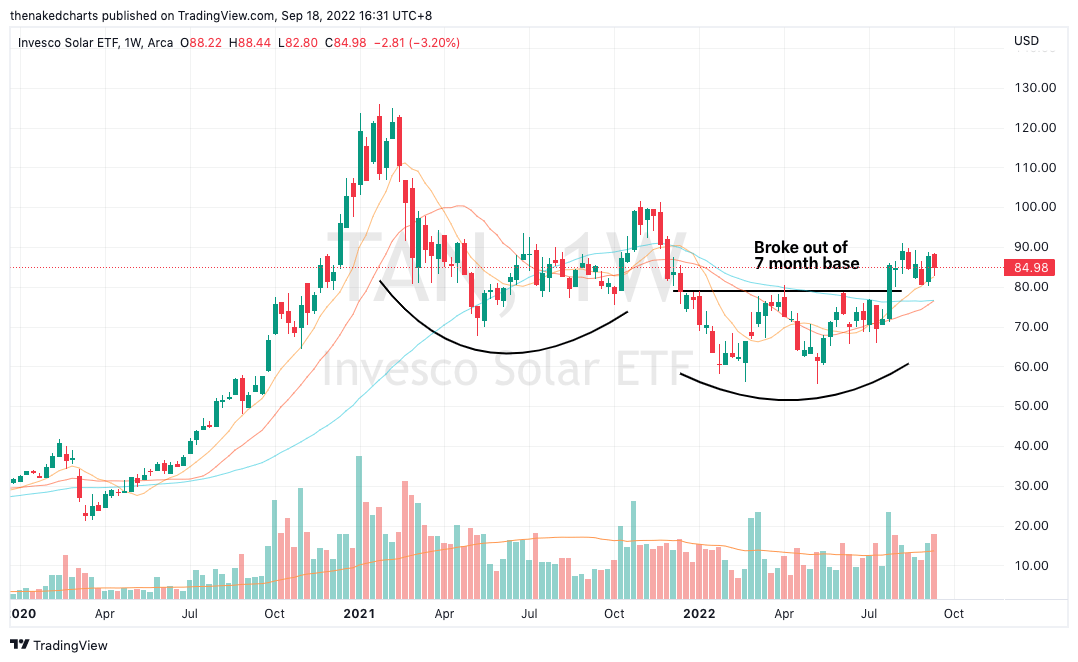
The solar sector has been outperforming the broader market. Below is the weekly chart of TAN against the S&P 500 (SPY). The ratio has been rising since the start of 2022, meaning that solar stocks have been outperforming the index during this bear market. The ratio is now looking to breakout higher from a 6 month base.
Weekly Chart of Ratio of TAN / SPY
Tradingview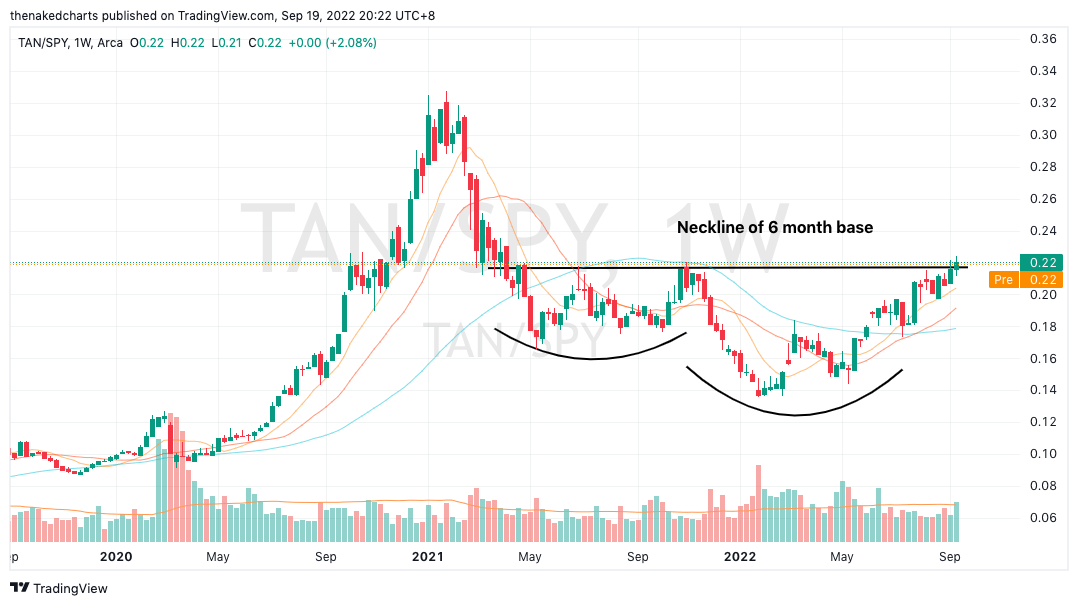
TAN’s technical chart also looks better supported than other growth sectors, such as the ARK Innovation ETF (ARKK), which is trading near its 2020 lows.
Weekly Chart: ARKK
Tradingview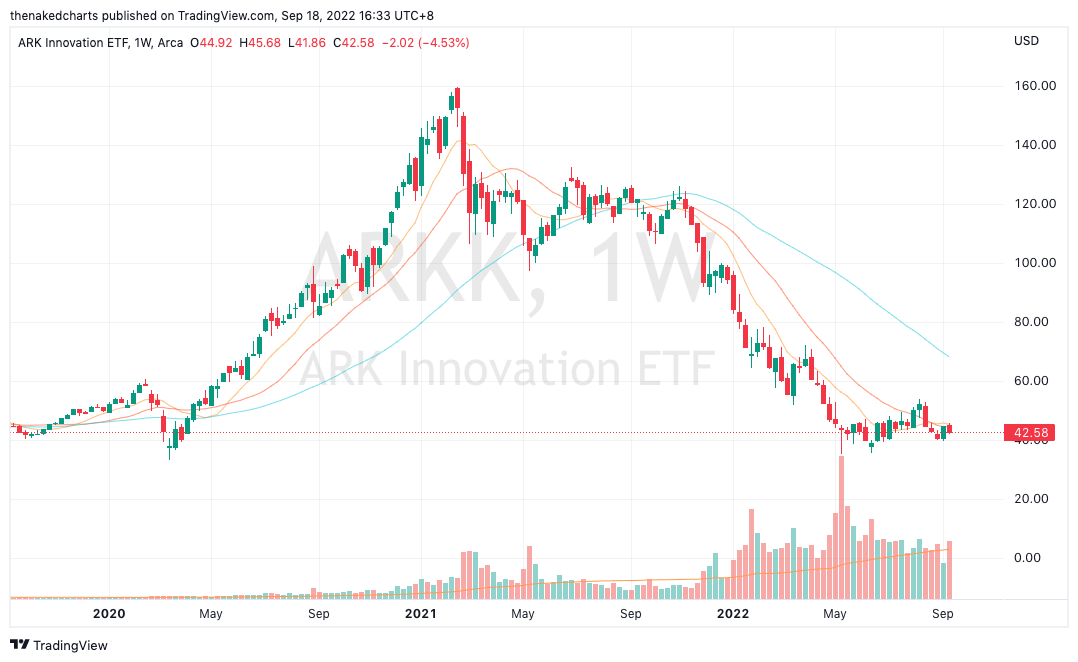
If the broad market reverses higher, the solar sector is likely to lead the charge higher, with ENPH the flag bearer within the sector. I always pay attention to sectors which are doing what they are theoretically not supposed to do. The solar sector is a growth sector, and has no business to be performing well under a rising rate narrative.
I am paying a lot of attention to solar’s relative strength. When the market is ready to recover, and when the environment becomes more supportive for growth stocks, it is very likely solar will receive another tailwind in its favor.
The Fed meeting comes with a lot of uncertainty, and one of the key charts I will be looking closely at for clues is the US 10 Year Yield. The US 10 Year Yield has been rising along with inflation expectations. However, I have written here and here that the technical charts of commodity markets do not support the higher inflation narrative.
Daily Chart: US 10 Year Yield
Tradingview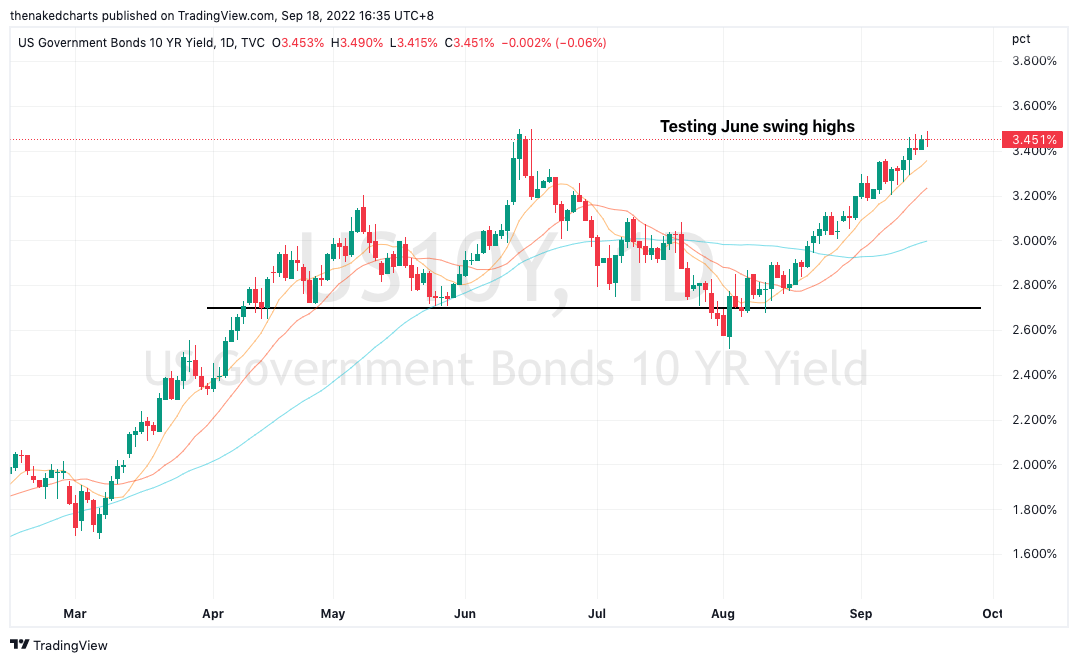
Many macro charts are trading at pivotal levels going into the Fed meeting, and I am expecting assertive moves after it concludes. The large number of good-quality technical setups I am seeing in the market is a positive sign. Furthermore, many of these setups are in the growth space, which runs contrary to the “doom and gloom” higher interest rate narrative out there. Sit tight, and manage your risk well!
Be the first to comment