

lamyai
Summer days are past us now, and we may now see a return of volatility and big moves with proper follow-through to the markets.
Some markets have been consolidating and seeing sideways action for months, and could now be ready to resume trending in their paths of least resistance.
The Japanese yen has been the whipping boy in the G10 currency space in this rising yield environment, such is the Bank of Japan’s obstinance in allowing yields to move higher, in line with the majority of central banks around the world.
From the chart below, we may observe that the Japan 10 Year Yield has stayed pretty much unchanged since 2020, while central banks from other developed countries have embarked on rate hike trajectories.
Global 10 Year Yields (TradingView)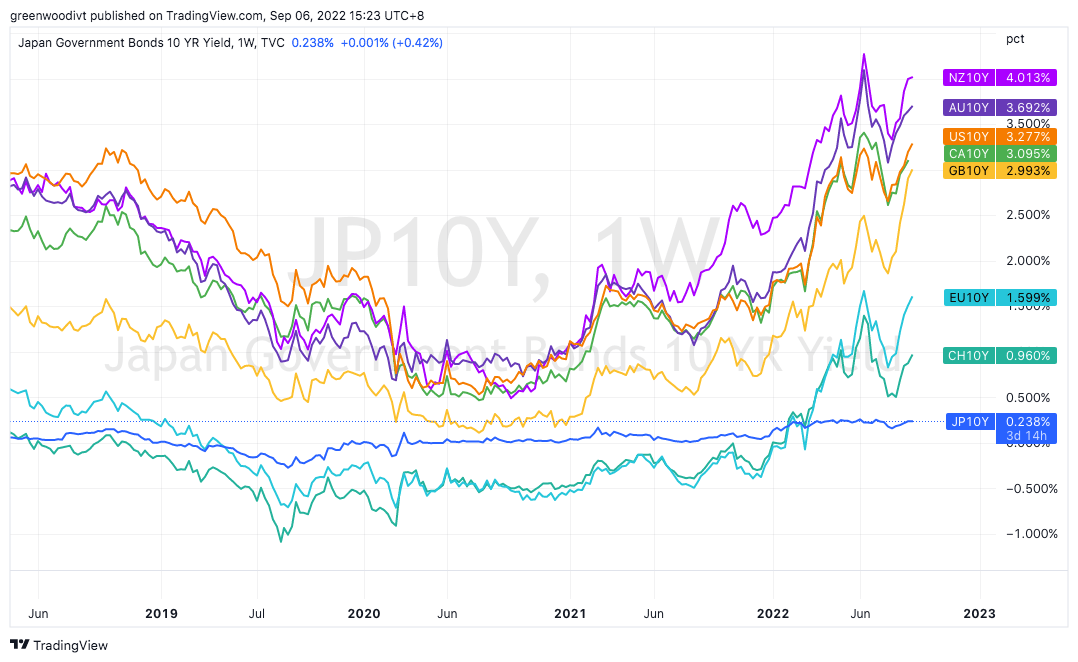
This has translated into a weak Japanese yen, in line with the widening interest rate differential between other major currencies and the yen.
The Yen has spent the bulk of the summer months consolidating and digesting its slide against other G10 currencies. With higher trading volumes expected post-summer, I believe the Yen looks ready for its next wave of weakness against its peers.
The long-term monthly chart of USD/JPY paints a market that has broken out higher from a massive two-decade range. As the saying goes, “the larger the base, the higher in space.” The path of least resistance in this FX pair is firmly higher, although the market looks too extended for me to hop on right away.
Monthly Chart: USD/JPY
USD/JPY Monthly Chart (TradingView)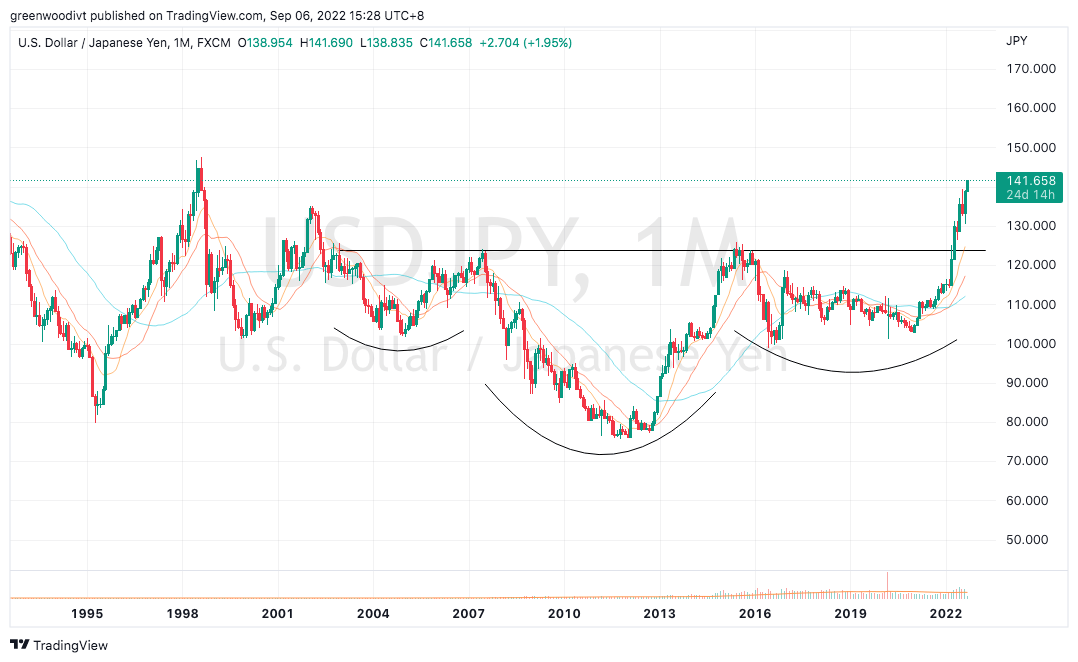
The bigger opportunities are in other JPY pairs, which are just starting to break out. EUR/JPY has been building a flag pattern for 4 months and is now breaking out of this consolidation pattern. Note the tight trading ranges in August, before the breakout occurred.
Weekly Chart: EUR/JPY
EUR/JPY Weekly Chart (TradingView)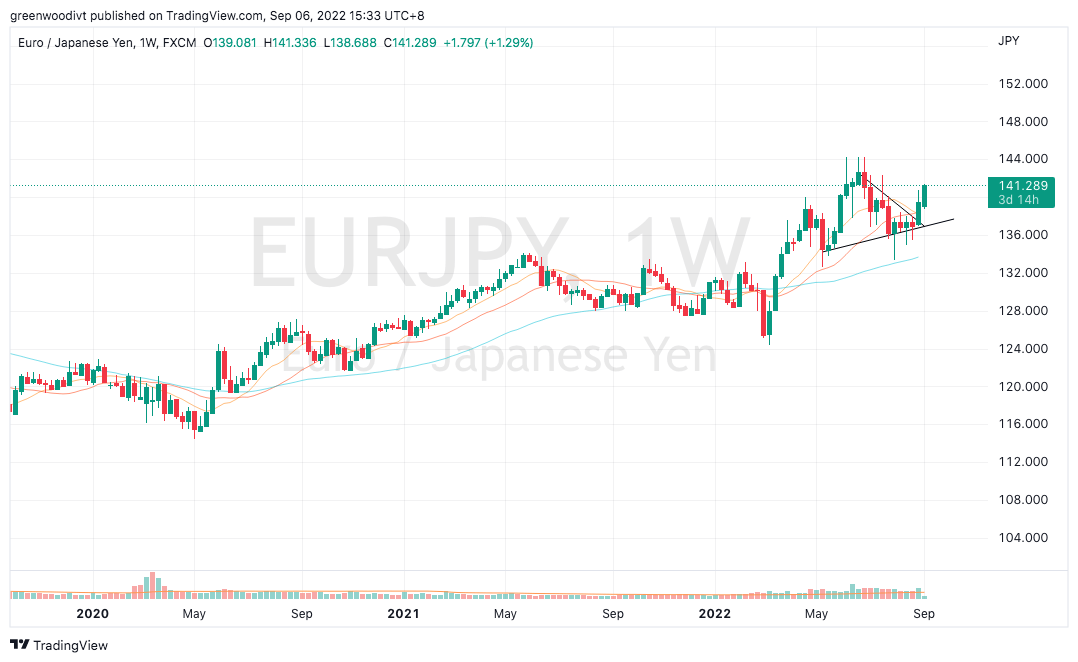
The breakout in GBP/JPY is fresher. We may observe that the pair has also formed a tight flag pattern over the summer months, and is just breaking out higher from this consolidative pattern this week.
Weekly Chart: GBP/JPY
GBP/JPY Weekly Chart (TradingView)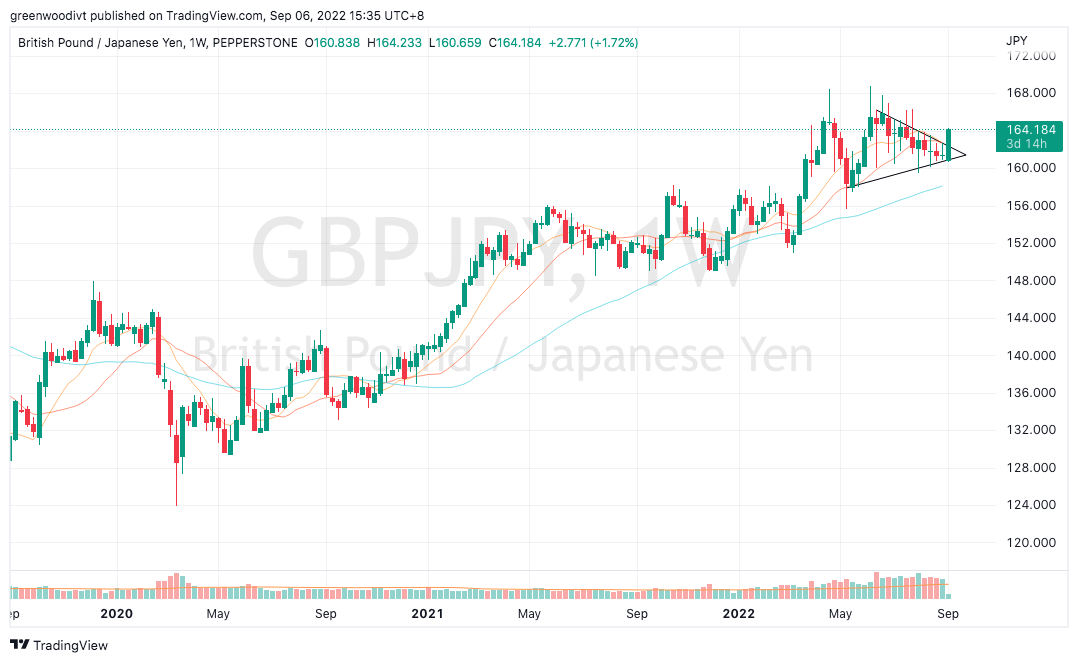
AUD/JPY is also breaking out higher from a tight flag pattern. Note how price has been surfing the 10- and 20-week moving averages prior to the breakout.
Weekly Chart: AUD/JPY
AUD/JPY Weekly Chart (TradingView)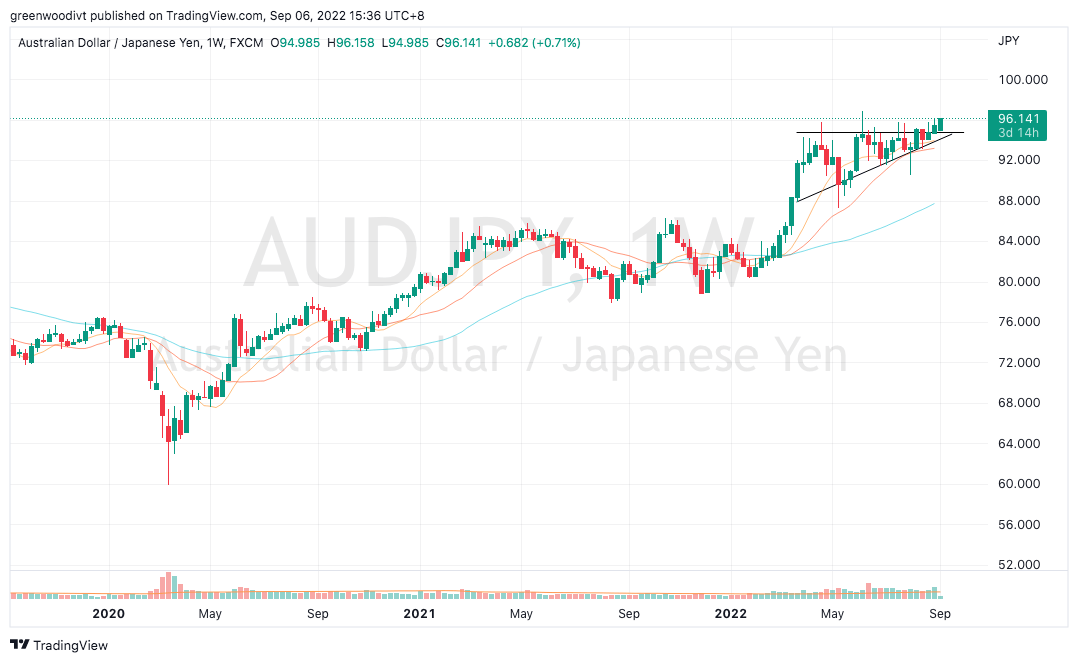
NZD/JPY is also breaking out higher from a tight flag pattern. Note how the 10- and 20-week moving averages had been providing support prior to the breakout.
Weekly Chart: NZD/JPY
NZD/JPY Weekly Chart (TradingView)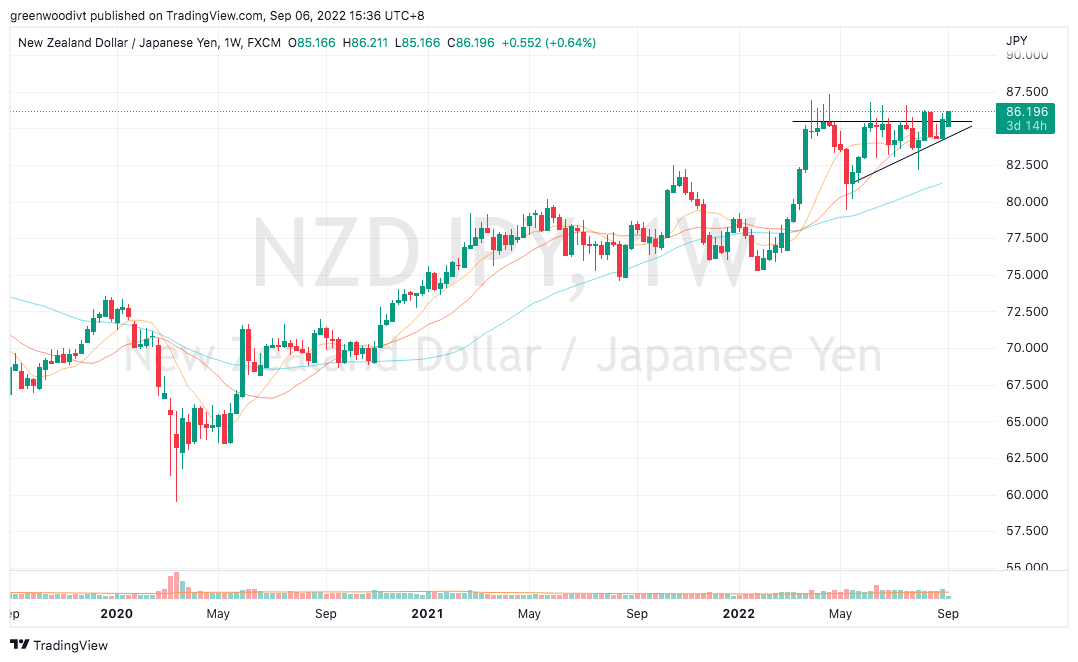
CAD/JPY saw less consolidation against the JPY compared to other commodity FX peers such as the AUD and NZD. The FX pair has also broken out higher from a flag pattern.
Weekly Chart: CAD/JPY
CAD/JPY Weekly Chart (TradingView)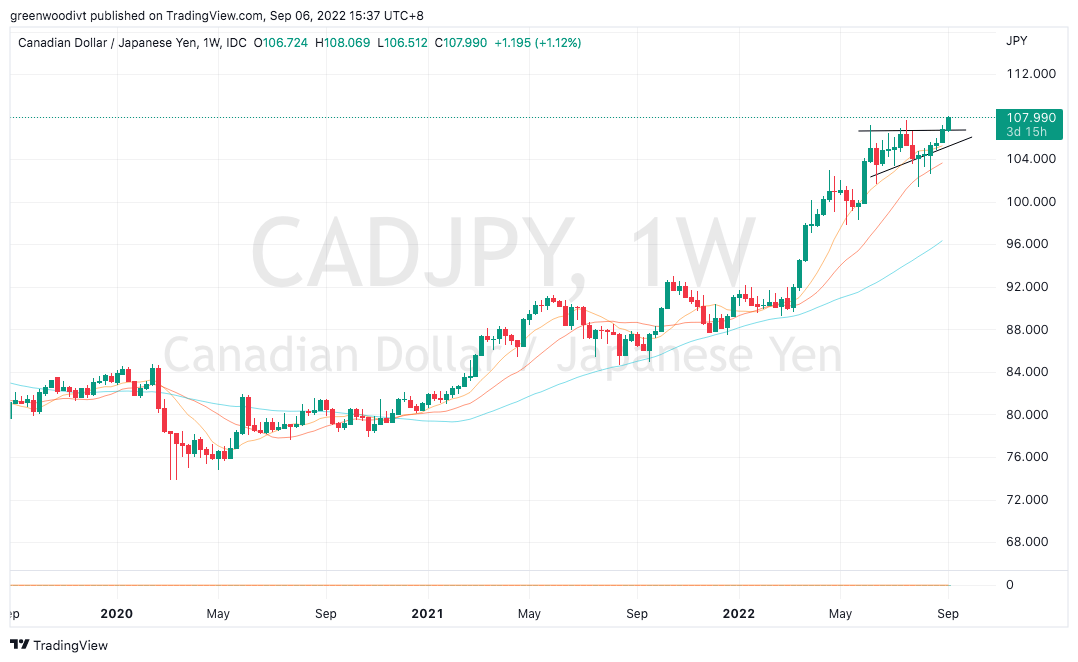
CHF/JPY is also breaking out higher against the JPY via a tight flag pattern. The CHF has been the second-strongest G10 currency, after the USD, largely due to the Swiss National Bank’s surprising willingness to raise interest rates from previously deep negative territory.
Weekly Chart: CHF/JPY
CHF/JPY Weekly Chart (TradingView)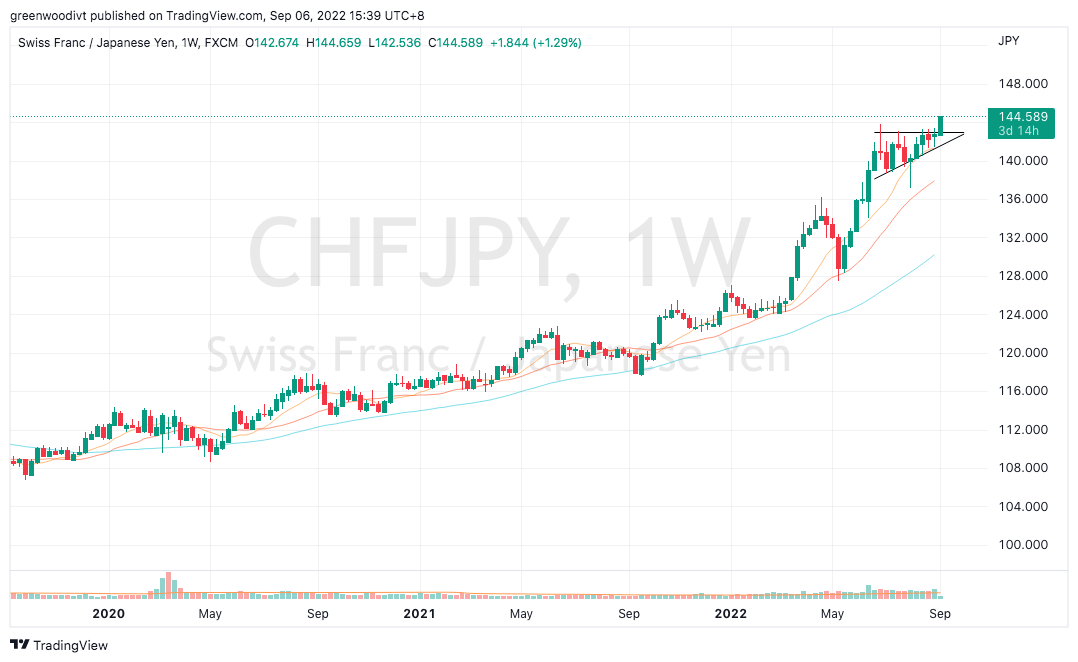
As the JPY has been the whipping boy in this rising rate environment, it then follows that what looks like further JPY weakness could portend a push higher in global yields.
The US 10 Year Yield had been dawdling near the key 3.15% level for the past quarter. While it did look like rolling over in June and July, its full-bodied bullish candle for the month of August tells us this market wants to break out higher from this 10-year base.
Monthly Chart: US 10 Year Yield
US 10 Year Yield Monthly Chart (TradingView)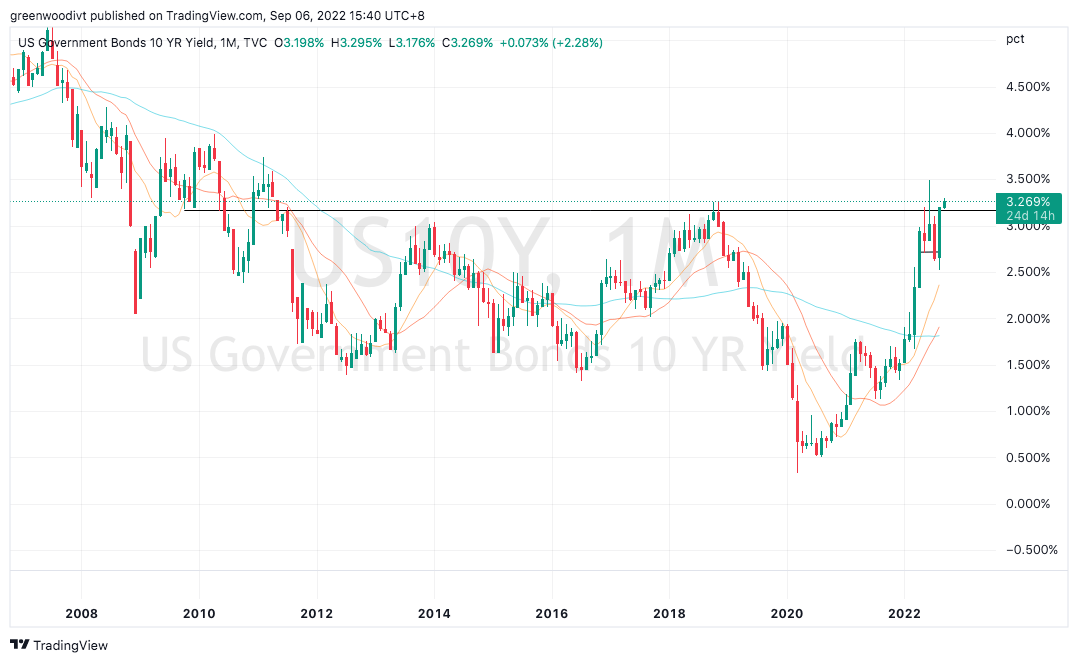
I had written in late July here that a near-term retracement lower in yields looked likely, and that would likely benefit growth stocks and cryptos. The rally in the growth space did materialize, and now the twin catalysts of higher yields and, consequently, stronger USD, are dampening risk sentiment again.
The market does not like a strong USD. Looking at the long-term monthly chart of the Dollar Index, the USD has enjoyed a strong run since breaking out higher from a 6-year base. For now, there are no signs of reversal/weakness (yet).
Monthly Chart: Dollar Index
Dollar Index Monthly Chart (TradingView)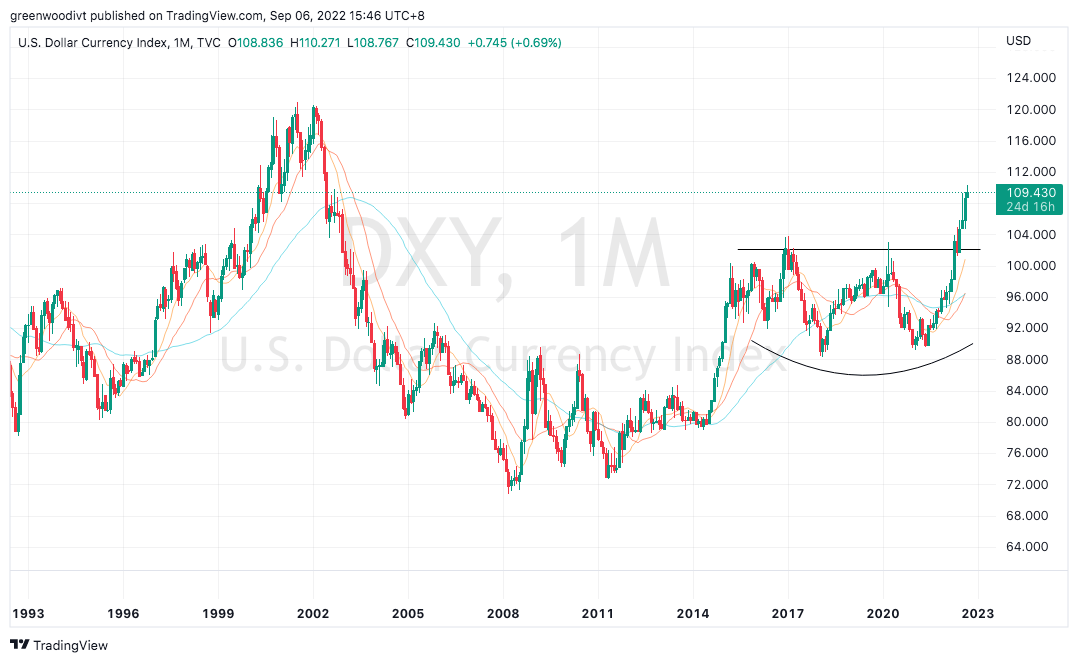
The modern-day financial markets are very intricately-linked, such that it pays to spend time looking at messages and tells from different asset classes.
It is clear that rising yields and a stronger USD have been the main culprits in dampening risk sentiment, and hence it follows that if the technical charts show a potential reversal lower in these two markets, then animal spirits will likely return. I am on close watch for any new developments. For now, the path of least resistance in global yields and the USD remains higher.
Be the first to comment