

The Q1 Earnings Season for the Gold Miners Index (GDX) is just around the corner, and one of the first companies to report its results is New Gold (NYSE:NGD). In line with the back-end weighted guidance, production was quite low in Q1 2022, down 8% year-over-year. However, production and costs are expected to improve in H2, with mining set to transition underground at Rainy River. In addition, the long-term outlook remains solid, with Rainy River’s margins steadily improving. However, improved outlook or not, I think there is better value elsewhere following a 50% plus rally above the $1.90 level for NGD.
Nordroden/iStock via Getty Images
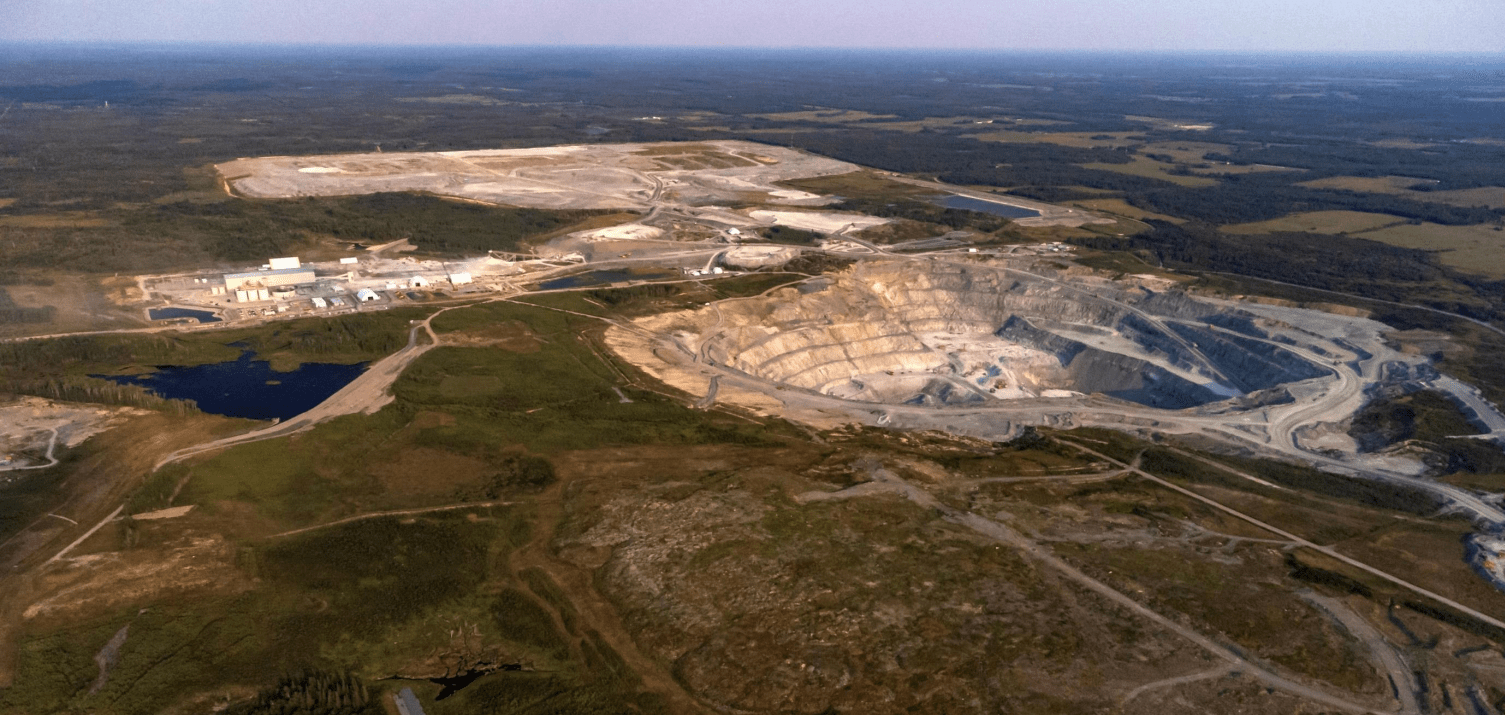
Rainy River Mine – Ontario (Company Website)
New Gold released its preliminary Q1 results last week, reporting quarterly production of ~87,700 GEOs, a decline of nearly 8% from the year-ago period. This was despite being up against relatively easy year-over-year comps, and it was the worst quarter for the company from a production standpoint in the last two years. However, this was partially related to COVID-19, which impacted equipment availability at Rainy River, with COVID-19 headwinds being a theme in Q1, with Eldorado (EGO) also reporting higher than expected absenteeism levels. Let’s take a closer look at the quarter below:
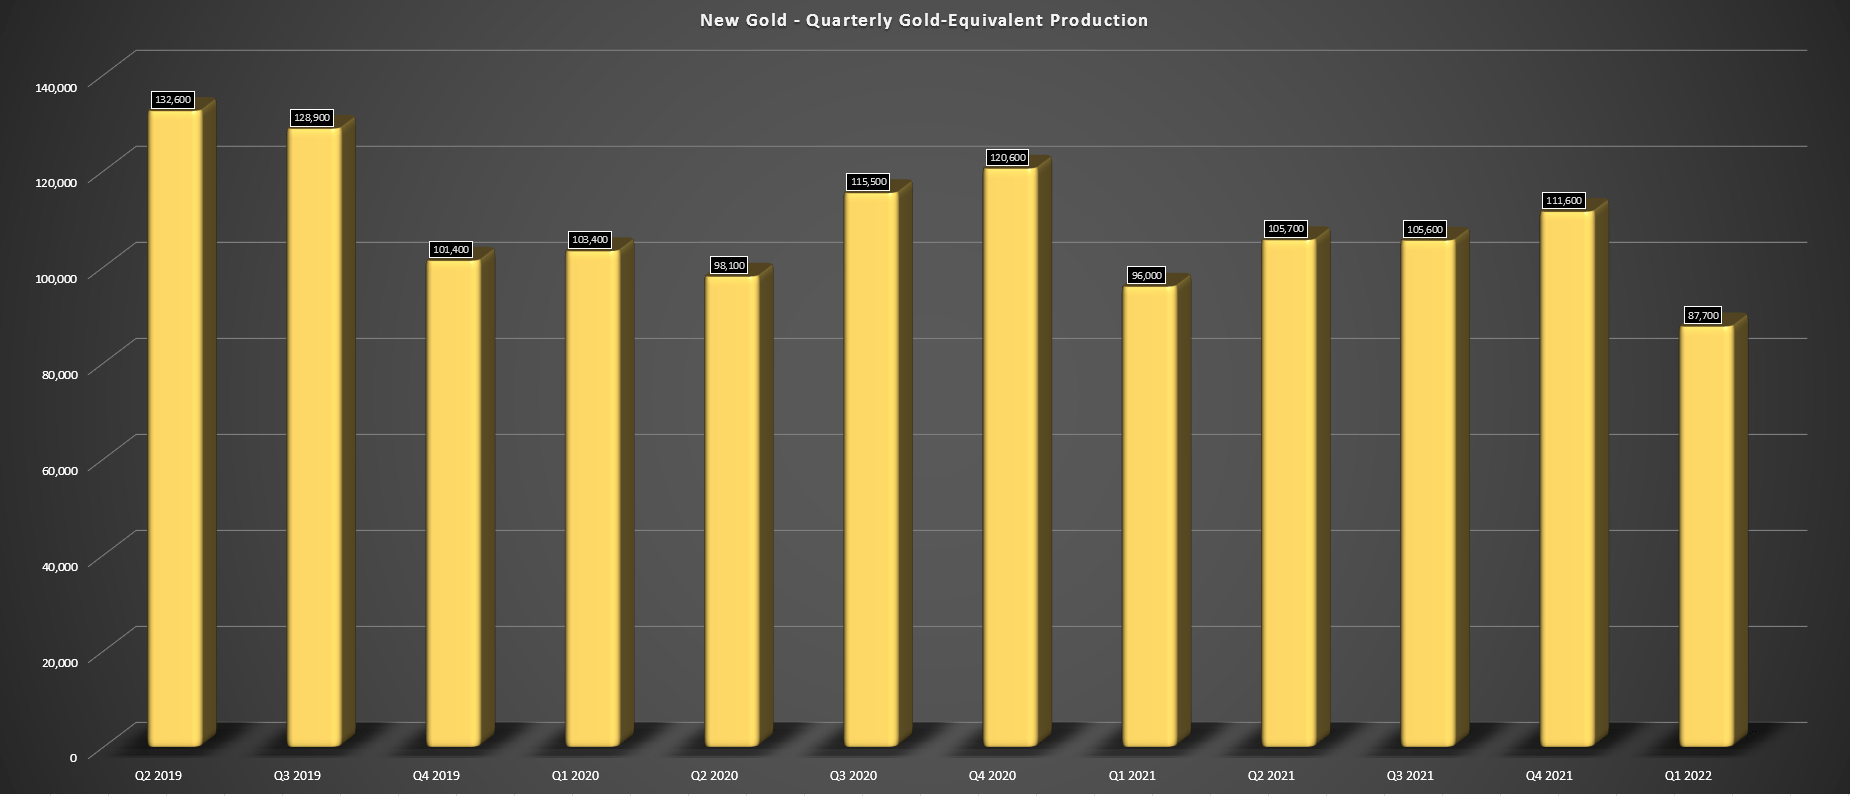
New Gold – Quarterly Gold-Equivalent Ounce Production (Company Filings, Author’s Chart)
Beginning with Rainy River, the mine had a decent quarter, despite headwinds from COVID-19. As shown in the chart below, the mine produced ~59,900 GEOs, a 6% improvement from the year-ago period. This was despite lower tonnes mined in the first half of Q1 due to decreased equipment utilization (rising COVID-19 cases) and cold weather, which affected drilling productivity. As noted by the company, open-pit tonnes mined were down 22% year-over-year to ~118,700 tonnes, a sharp decline from the ~150,800 tonnes mined in Q1 2021.
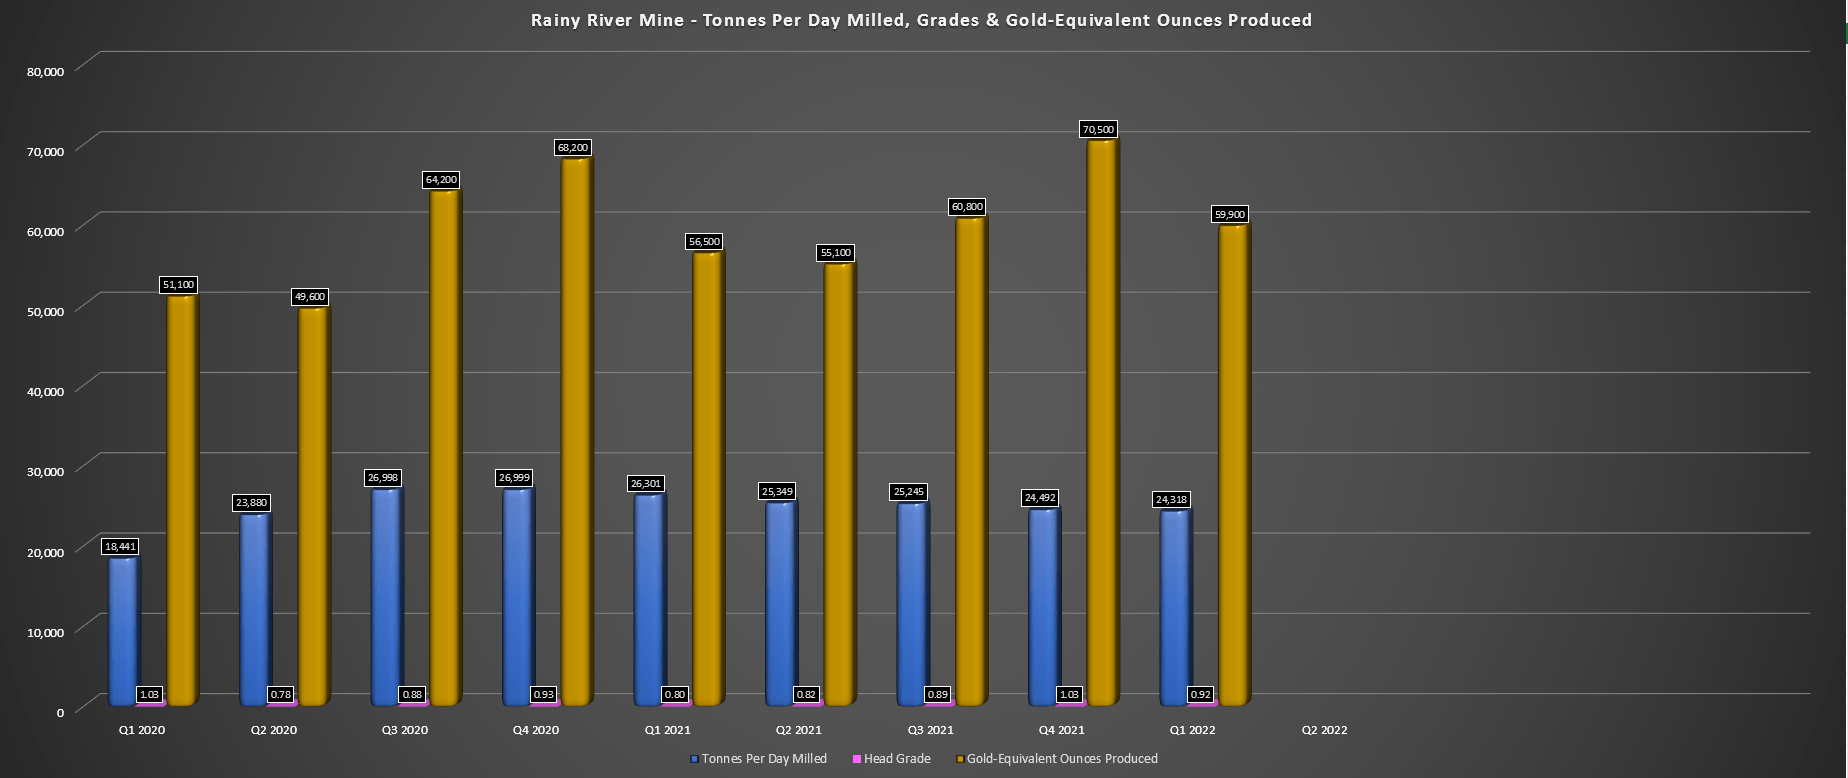
Rainy River – Quarterly Operating Metrics (Company Filings, Author’s Chart)
Meanwhile, at the mill, Rainy River saw lower throughput than last year, with an average throughput rate of ~24,300 tonnes per day. This was down 7% year-over-year and was related to mechanical maintenance on the SAG mill and crusher and unfavorable weather conditions that impacted stockpile movement. Fortunately, the higher grades (0.92 grams per tonne gold) and improved recovery rates (91%) more than offset the lower throughput, allowing the operation to report higher production year-over-year.
The other great news for the asset was the significant increase in mineral reserves, with growth in underground reserves more than offsetting mining depletion in the open-pit. As of December 2021, Rainy River’s reserves stood at ~2.80 million ounces of gold, up from ~2.60 million ounces in FY2020. This was helped by adding ~570,000 ounces of underground mineral reserves at Rainy River in the central zone, extending the mine life. It’s worth noting that Rainy River has an additional 1.35 million ounces of underground resources outside reserves, suggesting the potential to grow underground resources further, potentially supporting a mine life closer to 2035.
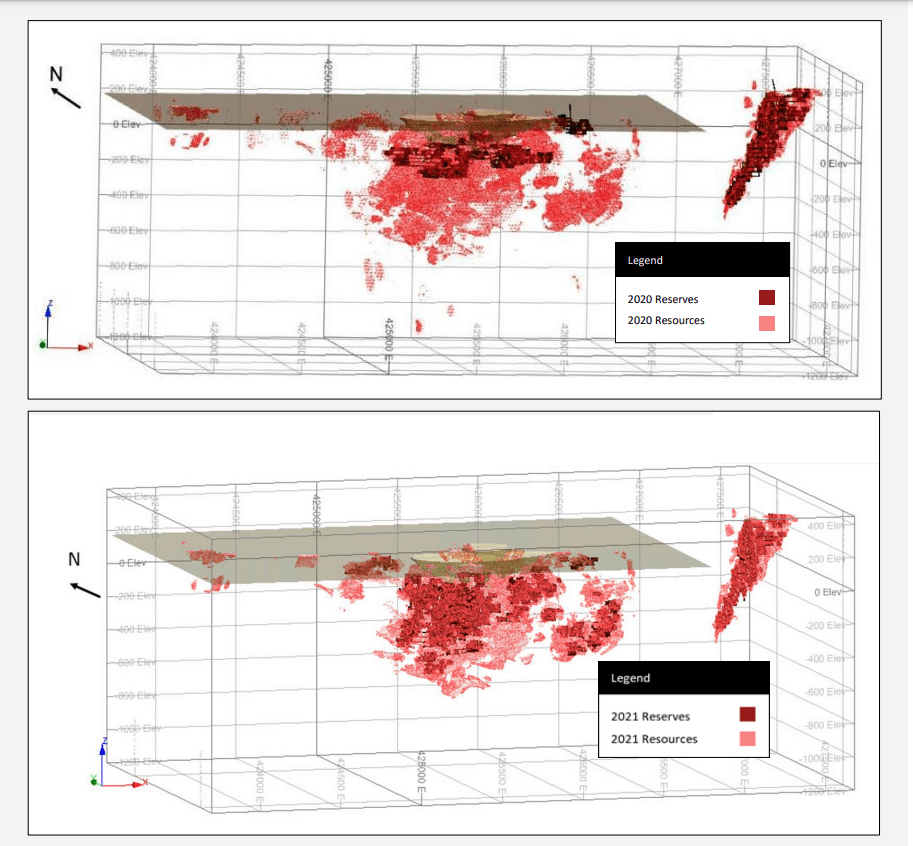
Rainy River Resources & Reserves (Company Presentation)
Based on the current guidance mid-point, Rainy River is expected to produce ~280,000 GEOs in FY2022 at all-in sustaining costs of $1,320/oz. This will be a moderate improvement from the $1,415/oz in FY2021 and $1,550/oz+ costs in FY2019 and FY2020 in the investment phase. However, while we should see a slight improvement in costs in FY2022, operating costs are expected to continue to trend lower, allowing this asset to generate significant free cash flow post-2023.
Combined with New Gold’s much stronger balance sheet ($400+ million in cash), this will give the company lots of room to fund the upfront investment in the block cave at New Afton, and it could also open up the potential for a small acquisition if something arises. This is a much better position than New Gold was in years ago, with significant net debt and no hope of doing any M&A, with investors having to be concerned about potential share dilution if gold prices stayed below $1,600/oz.
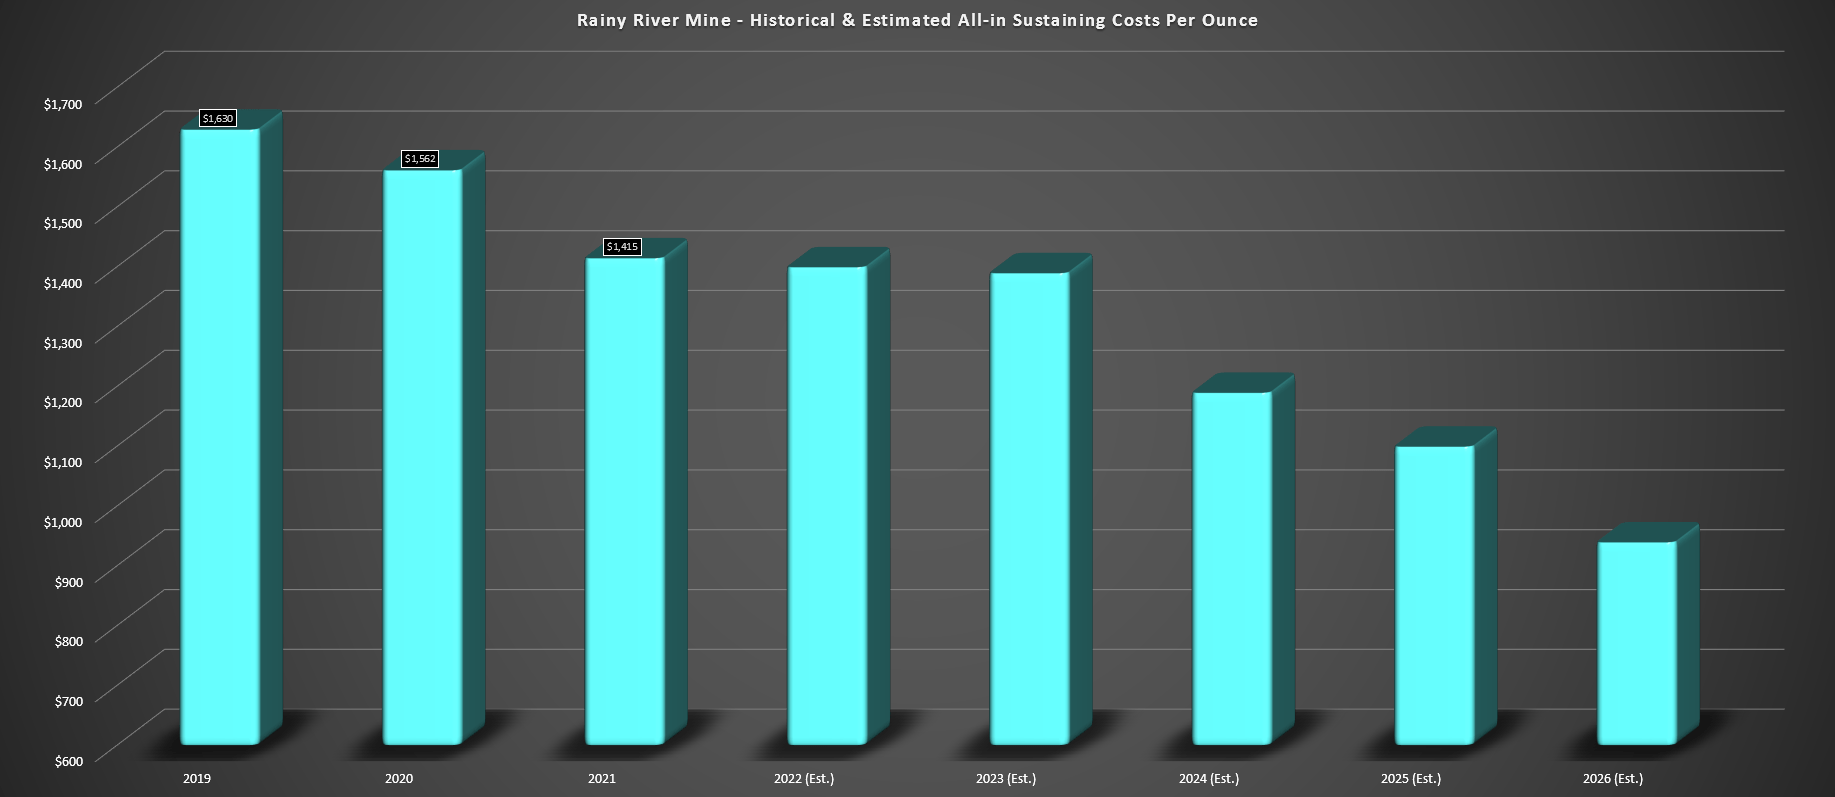
Rainy River Mine – Historical All-in Sustaining Costs & Forward Estimates (Company Filings, Author’s Chart)
New Afton
Unfortunately, while Rainy River is hitting its stride, New Afton is in a capital-intensive period with significant growth capital expenditures planned this year ($100-$130 million) at the British Columbia asset. This will translate to elevated all-in sustaining costs north of $1,700/oz, putting a dent in AISC margins for this asset. So, while Rainy River should see its fourth consecutive decline in AISC in 2022, this will be largely offset by New Afton, explaining the expectations for higher costs this year on a consolidated basis ($1,520/oz vs. $1,463/oz).
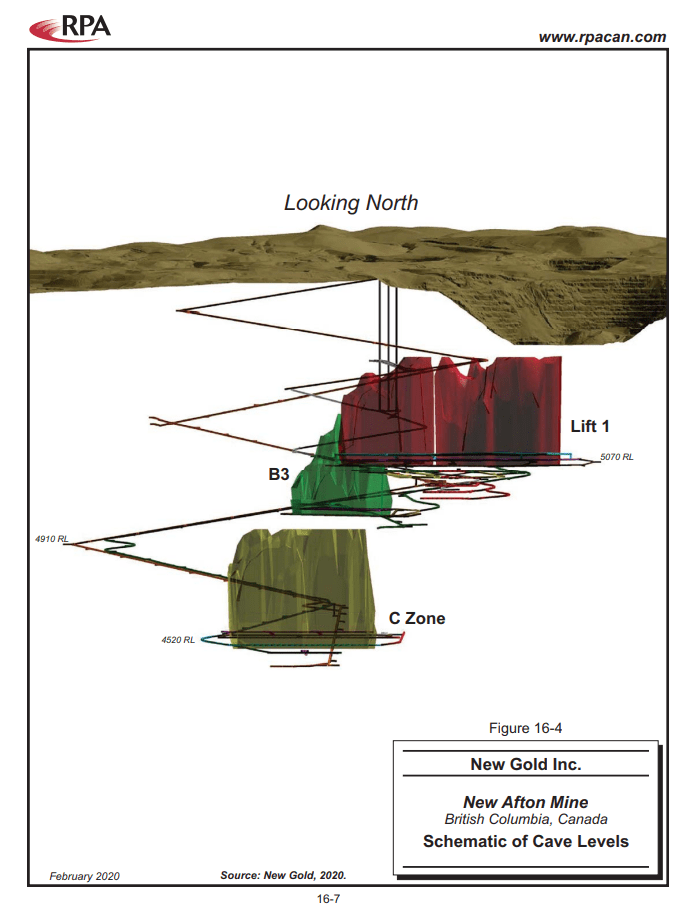
New Afton Mine (Company Technical Report)
The good news is that although New Afton will be an anchor for New Gold from a cost standpoint medium-term, production will increase materially in the C-Zone Period, with production from the C-Zone expected to begin by 2024. Under the current Technical Report, grades are expected to increase significantly in 2025 to 0.73 grams per tonne of gold and 0.76% copper and improve further to 0.89 grams per tonne of gold and 0.93% copper in 2026.
So, while there is significant capex upfront to develop the C-Zone, costs will improve materially later this decade. At the same time, Rainy River will be enjoying much lower costs (FY2026 estimated AISC: ~$960/oz), meaning that New Gold will transition from being a high-cost producer to an average-cost or even lower-cost producer. This should help improve the company’s cash-flow multiple relative to peers, with an even larger boost if the company can add a third lower-cost operation by 2026 to further improve its cost profile and help diversify the company further. Let’s take a look at the valuation below:
Valuation & Technical Picture
Based on ~687 million fully diluted shares, New Gold has a market cap of ~$1.31 billion at a share price of US$1.92. This is a reasonable valuation for a dual-asset producer in a Tier-1 jurisdiction like Canada, especially when Wesdome Mines (OTCQX:WDOFF) has half the production profile and trades at a higher market cap (~$1.7 billion). However, the two are not all that comparable. So, while New Gold looks insanely cheap relative to a name like Wesdome, it’s important to note the differences, including the fact that New Gold’s operating costs are well above the industry average (shown below).
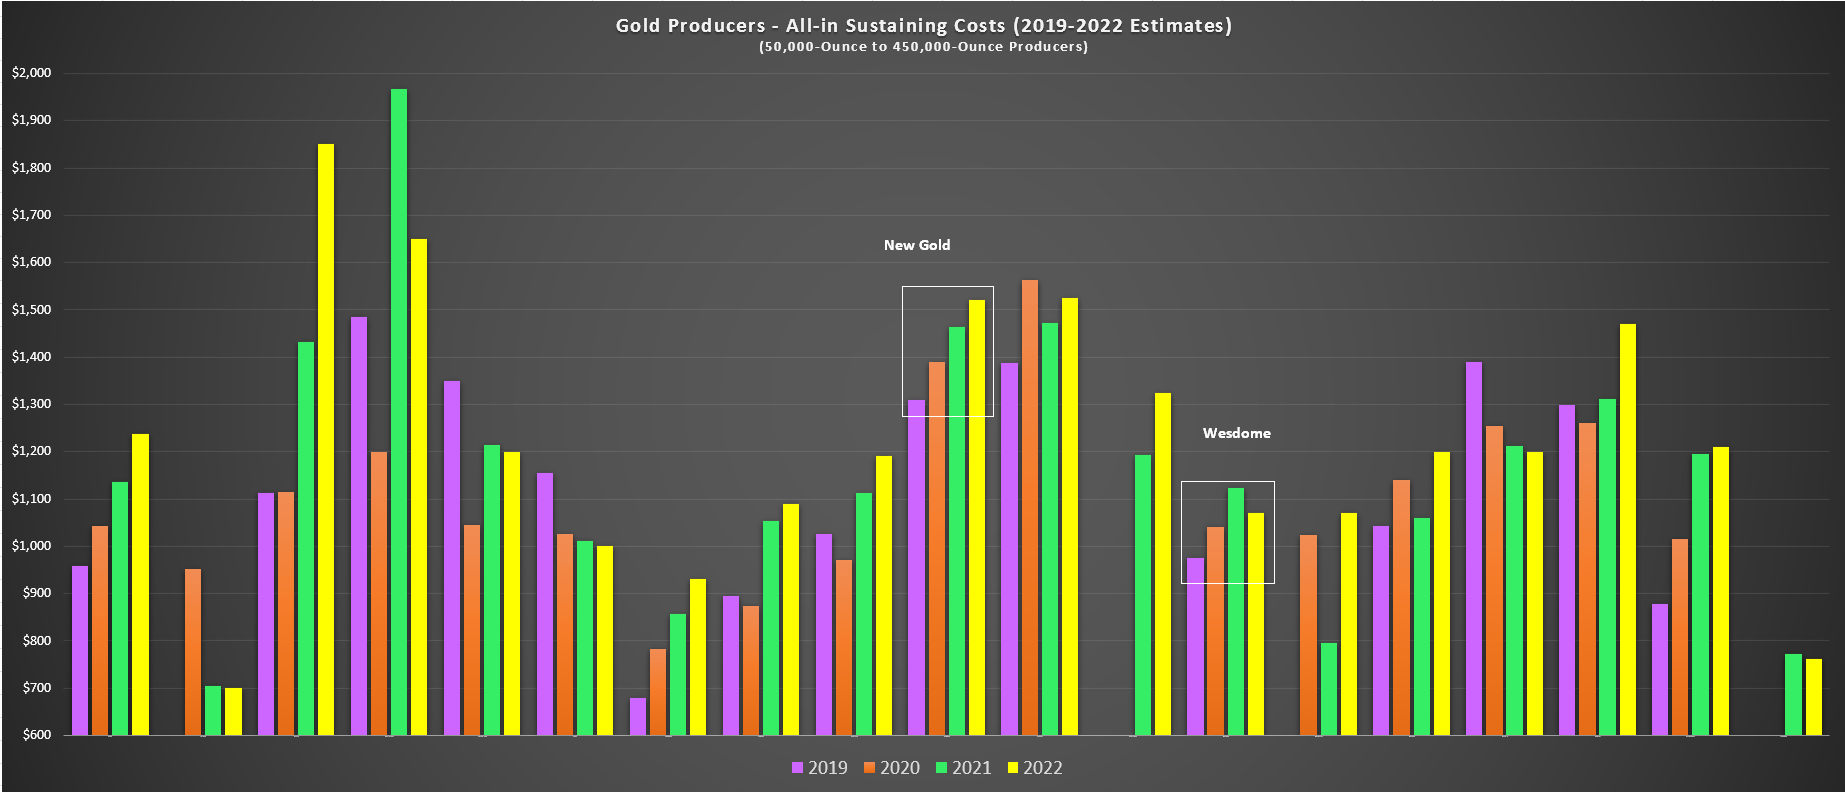
Gold Producers – All-in Sustaining Cost Progression (2019-2022 Estimates) (Company Filings, Author’s Chart)
Looking at the chart below, we can see that New Gold has traded at an average cash flow multiple of ~3.6 over the past four years, and it is currently trading above this level at a share price of $1.91. This is based on FY2022 cash flow estimates of $0.47, leaving the stock trading at ~4x forward cash flow. However, as noted above, New Gold does have a path to higher margins by 2024 and a much stronger balance sheet (~$800 million in liquidity), so I would argue that the stock could easily command a cash flow multiple of 4.0.
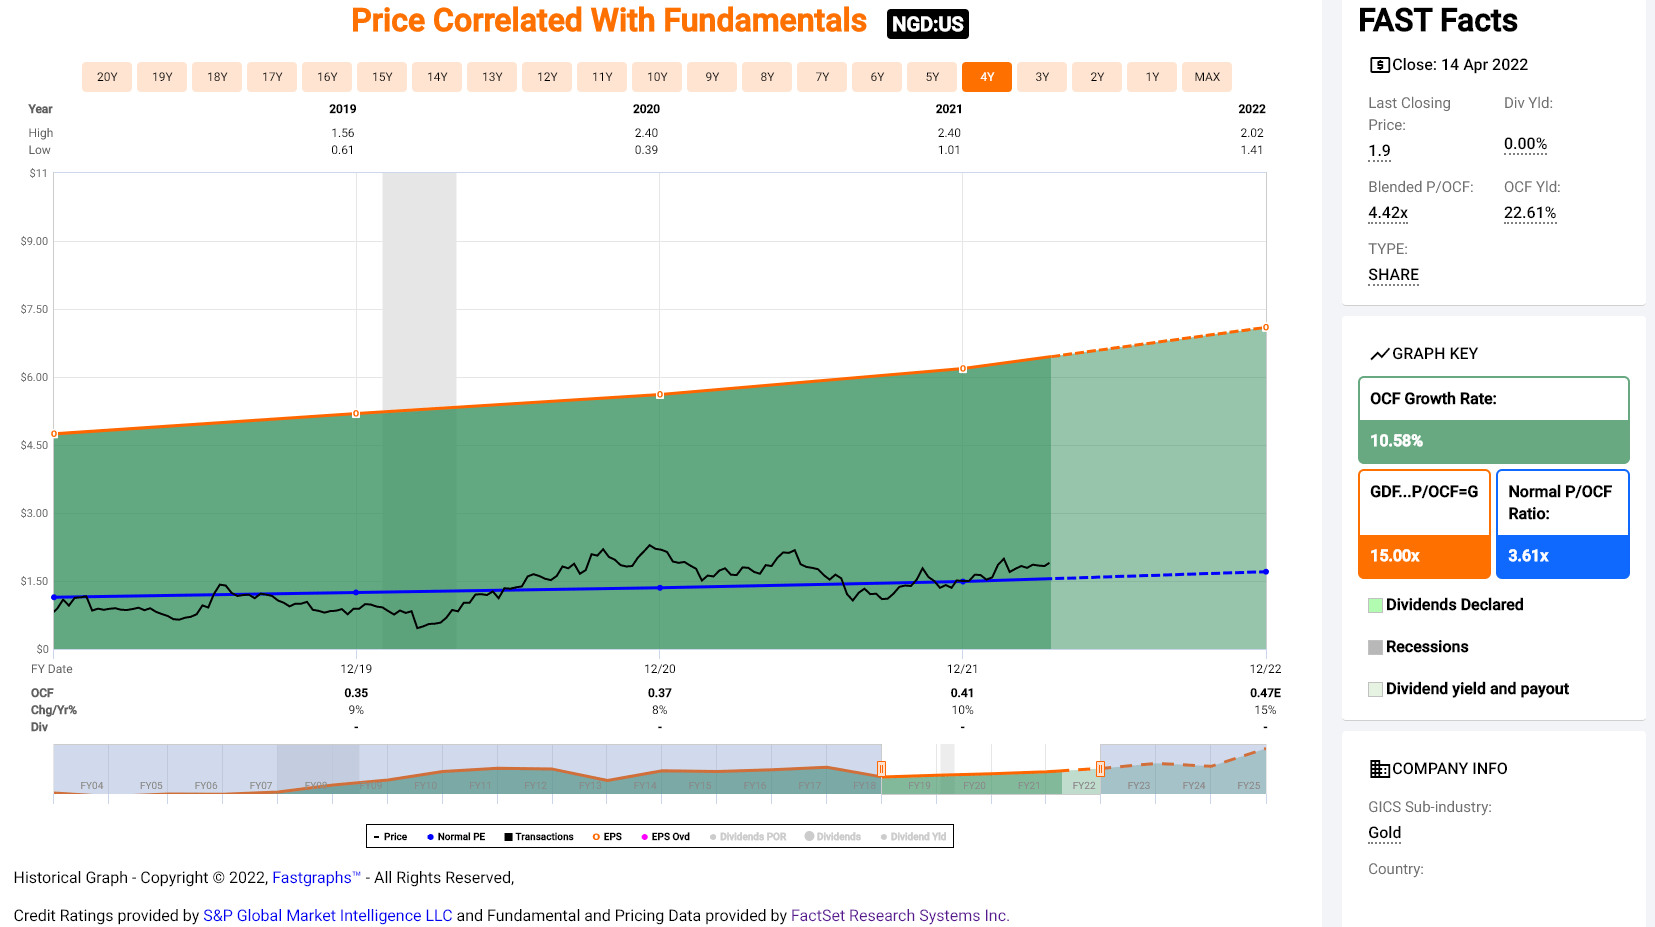
New Gold – Historical Cash Flow Multiple (FASTGraphs.com)
Under this assumption, and assuming New Gold meets FY2023 cash flow estimates of $0.55, this would translate to a fair value for the stock of US$2.20. While this translates to a 15% upside from current levels, I prefer to buy at a minimum 30% discount to fair value for higher-cost producers. After applying a 30% discount to this fair value, New Gold would need to dip below US$1.54 for me to become interested in starting a new position. So, while New Gold could trade higher from here, especially if gold heads back above $2,000/oz, I don’t see this as a low-risk buying opportunity.
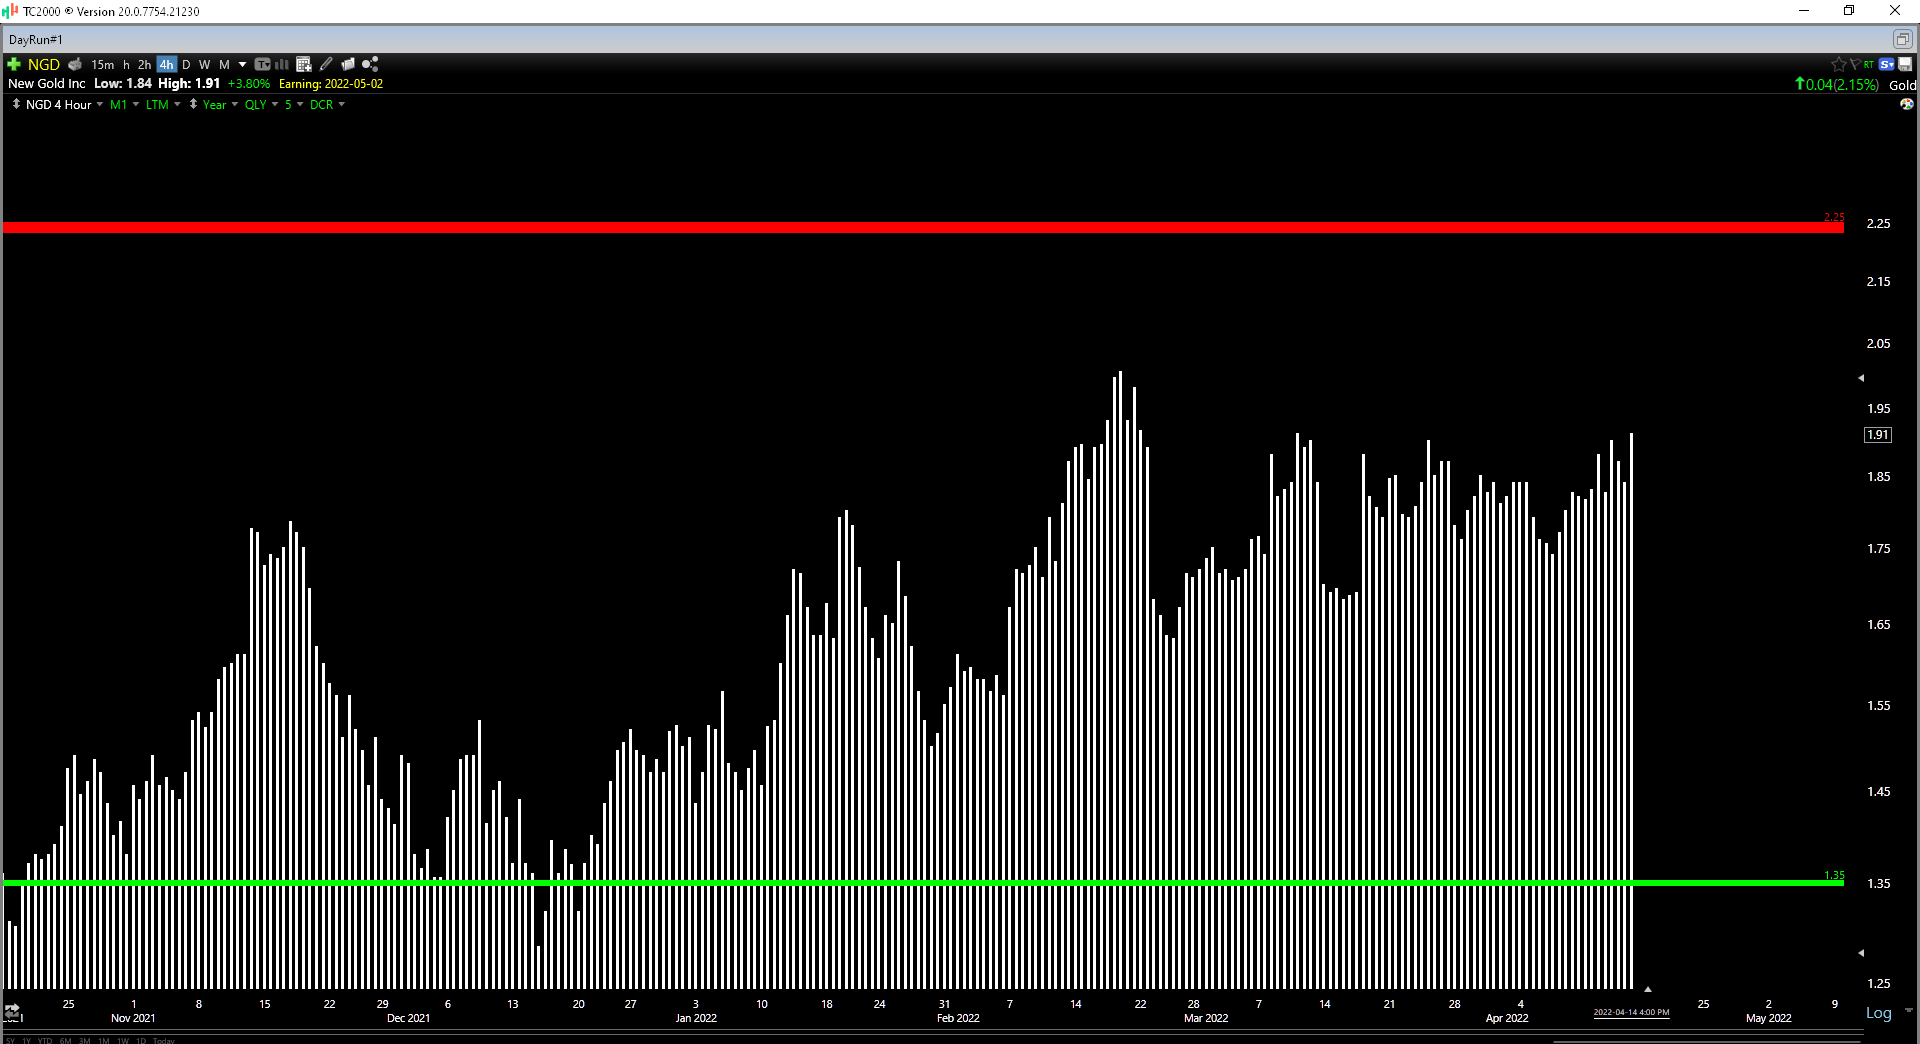
NGD Daily Chart (TC2000.com)
This view is corroborated by the technical picture, which shows New Gold trading in the upper portion of its expected trading range ($1.35 – $2.25). Based on a current share price of $1.91, the stock has $0.34 in potential upside to resistance and $0.56 in potential downside to support, translating to an unfavorable reward/risk ratio of 0.61 to 1.0. I prefer to buy at a reward/risk ratio of 5.0 to 1.0 or better for small-cap producers, meaning that NGD will need to dip below $1.51, which would also line up with a lower-risk buy point from a valuation standpoint. To summarize, I am neutral on the stock short-term.
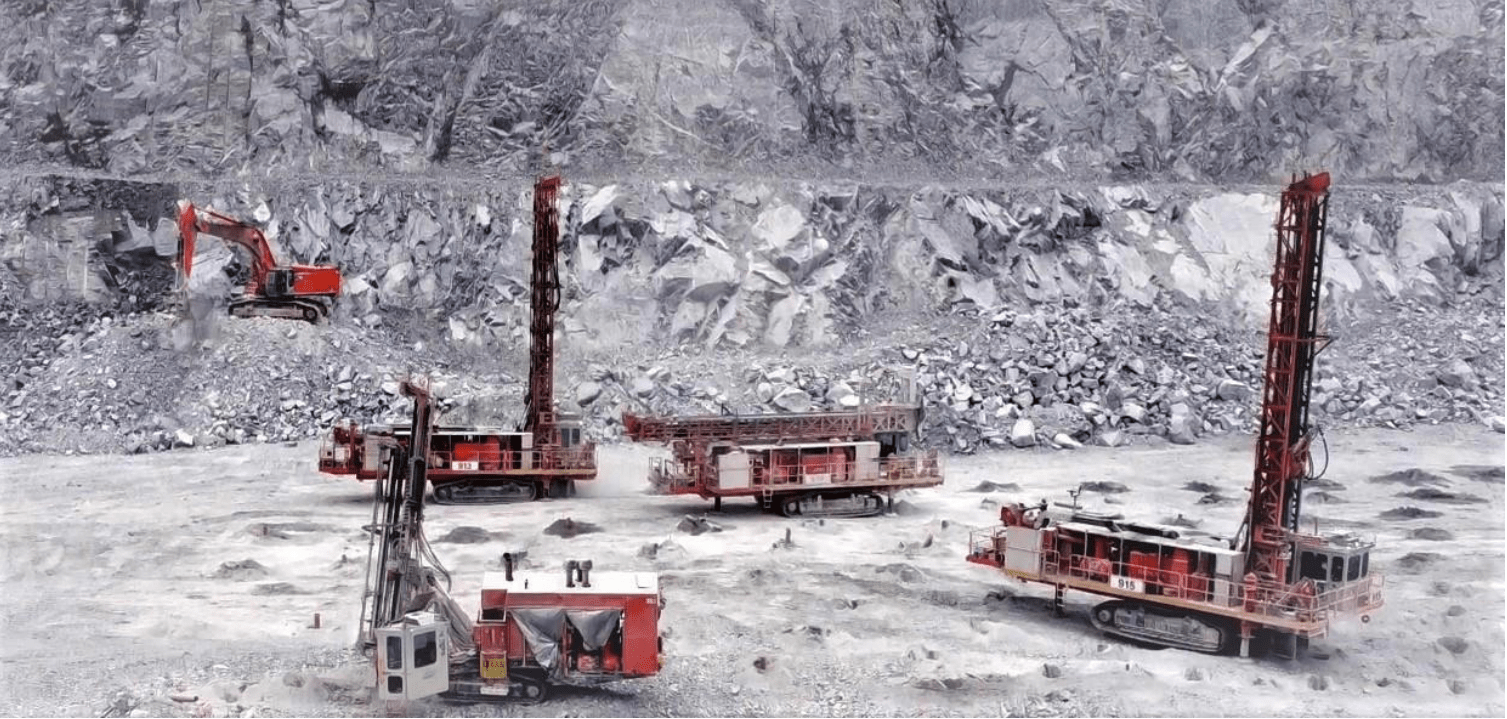
Rainy River Operations (Company Website)
New Gold had a slow start to FY2022, which was expected given that production will be back-end weighted. However, while the stock has an improved long-term outlook, especially with the mine life extension at Rainy River, it’s now up more than 50% from its December lows. This doesn’t mean that the stock can’t go higher, but it’s hard to argue for paying up for NGD here above $1.90, especially with it being a high-cost producer, at least for the time being. So, while I would not be surprised to see more upside by the fall, I would view any rallies above $2.17 before August as an opportunity to book some profits.
Be the first to comment