

Wachiwit
Netflix (NASDAQ:NFLX) has been a substandard performer compared to other FANG stocks, including Meta (META), Apple (AAPL), and Alphabet (GOOG)(GOOGL). During the pandemic, Netflix has appeared to strengthen its stock price as people were locked in their homes. However, this year has remained a strong one for Netflix, with positive returns for SMA (simple moving average) periods of 20, 50, and 200 working days.
Fundamentals Are Weak, No Precise Forward Guidance Estimates Provided
Ratios
Netflix’s current ratio has declined since 2017, while its quick ratio has conservatively inclined. The strongest time period for it was in 2020. There is no real narrative to be determined from this.
|
Metric |
2017 |
2018 |
2019 |
2020 |
2021 |
|
Period |
FY |
FY |
FY |
FY |
FY |
|
Current ratio |
1.403 |
1.494 |
0.901 |
1.251 |
0.951 |
|
Quick ratio |
0.516 |
0.585 |
0.875 |
1.129 |
0.805 |
Source: Financial Modeling Prep
Growth
Growth for Netflix, specific to revenue, has declined since 2017. However, gross profit growth and operating income growth have been mixed.
|
Metric |
2017 |
2018 |
2019 |
2020 |
2021 |
|
Period |
FY |
FY |
FY |
FY |
FY |
|
Revenue growth |
0.324 |
0.351 |
0.276 |
0.240 |
0.188 |
|
Gross profit growth |
0.440 |
0.445 |
0.324 |
0.260 |
0.272 |
|
Ebitgrowth |
1.208 |
0.914 |
0.622 |
0.761 |
0.351 |
|
Operating income growth |
1.208 |
0.914 |
0.622 |
0.761 |
0.351 |
Source: Financial Modeling Prep
Data
This year, Netflix has seen a tremendous turnaround with a simple moving average period of 50 working days, with a weaker positive value of 20 working days. However, momentum for even 200 working days has remained positive, comparable to many other companies where simple moving averages were all negative this year.
|
Metric |
Values |
|
SMA50 |
20.36% |
|
SMA20 |
8.96% |
|
SMA200 |
13.93% |
Source: FinViz
Enterprise
As we know, the stock price is the most critical, with 2021 being the second strongest year for Netflix since 2017. Market capitalization peaked in 2020 due to the pandemic as people watched the video service while locked down in their homes. The second strongest year was last year.
|
Metric |
2017 |
2018 |
2019 |
2020 |
2021 |
|
Symbol |
NFLX |
NFLX |
NFLX |
NFLX |
NFLX |
|
Stock price |
278.800 |
340.660 |
347.740 |
532.390 |
384.360 |
|
Number of shares |
431.885 M |
435.374 M |
437.799 M |
440.922 M |
440.922 M |
|
Market capitalization |
120.410 B |
148.315 B |
152.240 B |
234.742 B |
169.473 B |
Source: Financial Modeling Prep
Estimates
It is strange to see forward-looking data with no revenue, net profit, or EBITDA for 2022 to 2024. It is not a common practice, which means that Netflix cannot forecast short-term growth. However, the company specifies its estimates for 2025, which appears irrelevant as no trend seems to be occurring between 2022 and 2024. I would consider this to be a red flag for Netflix. Does this mean it has no confidence in being able to estimate its short-term projections because of substantial uncertainty?
|
Yearly Estimates |
2022 |
2023 |
2024 |
2025 |
2026 |
|
Revenue |
– |
– |
– |
41,697 |
45,415 |
|
EPS |
– |
– |
– |
16.33 |
19.89 |
|
P/E Ratio |
26.22 |
25.59 |
20.33 |
17.39 |
14.28 |
|
EBIT |
– |
– |
– |
9,411 |
10,740 |
|
EBITDA |
– |
– |
– |
10,561 |
12,124 |
|
Net Profit |
– |
– |
– |
7,444 |
9,272 |
|
Net Profit Adjusted |
4,787 |
4,977 |
6,029 |
7,848 |
9,002 |
Source: Business Insider
Technical Analysis Shows Short Price Action Gains
Fibonacci
Netflix is showing a steady recent performance with regard to its stock price. However, there is an evident long-term decline based on the Fibonacci downtrend trendline. What is essential to take note of here is the recent rising stock price from the lower point of the trendline. Market entries could be open based on past momentum since March of this year. However, how long will this rally last with no forward-looking guidance going into next year?
nflx fiboancci (custom platform)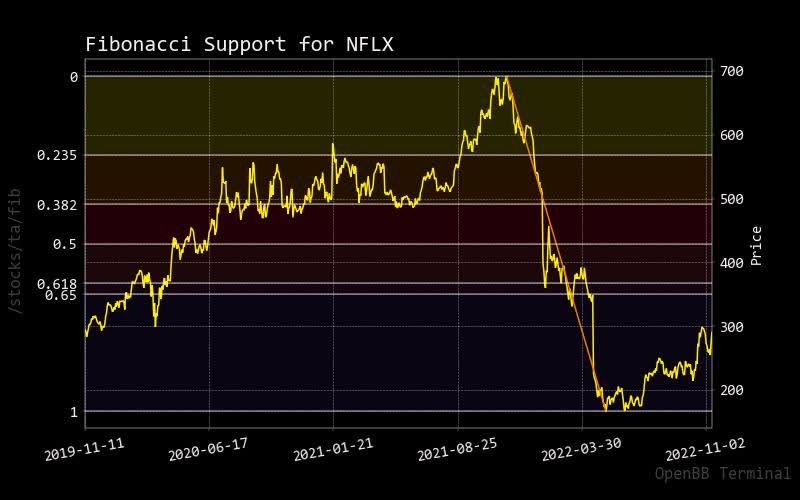
Bollinger Bands
Based on the most recent dip for Netflix, the stock price recovery could quickly reach the upper bands to continue the momentum I have shown since March.
nflx bollinger bands (custom platform)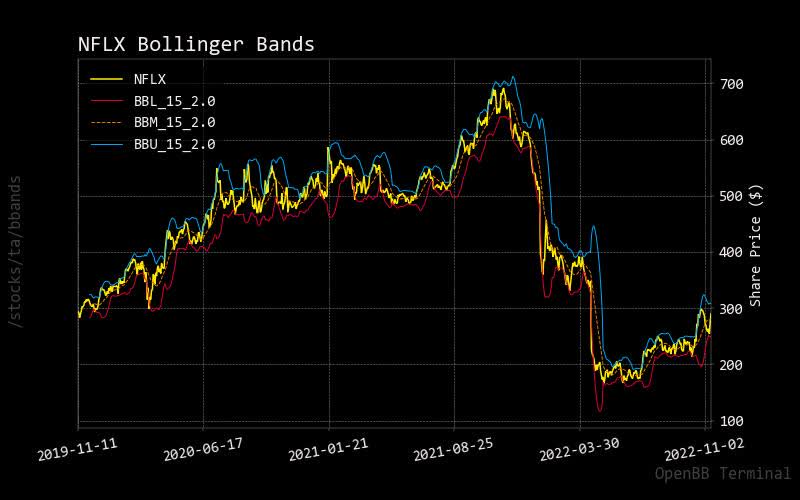
MACD
Despite its steep decline since last fall in 2021, Netflix’s stock price has been favorable as shown by the MACD yellow line of the lower panel. Moreover, Netflix builds faster as the stock price correlates to the strengthening of major U.S.-based market indices.
nflx maxd (custom platform)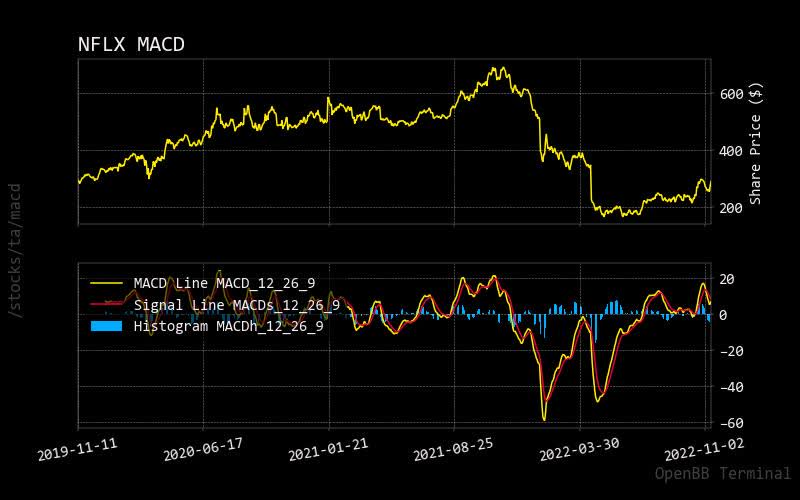
RSI
It is common knowledge that an investor can expect a short-term pullback as its stock price hits the overbought market condition of the relative stock indicator. The level of 70 is standard, so the most recent retreat for Netflix has dropped back to 50. The most recent stock price rally is approaching 70 again, with some momentum still to go before the next pullback.
nflx rsi (custom platform)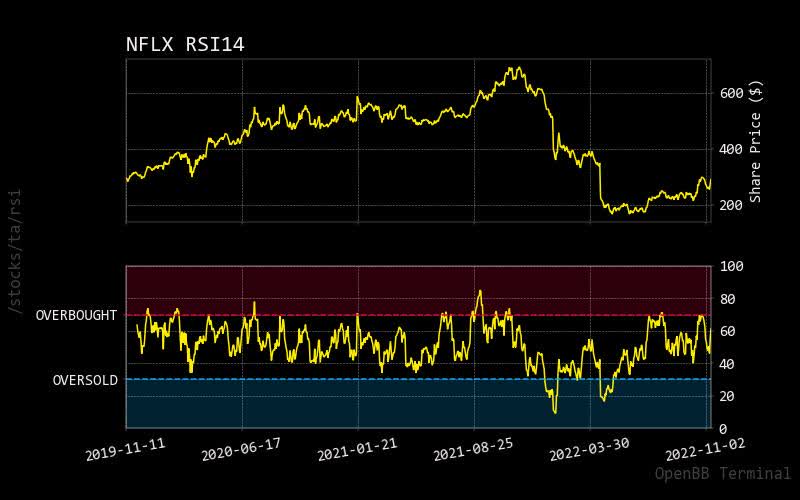
Prediction Via Artificial Intelligence
Monte Carlo
It is easier to assess a stock price’s sustainable upward market movement with forward guidance in fundamental analysis. To clarify this, we can use artificial intelligence tools with Monte Carlo simulations. Here we can see solid upward momentum with higher predictive paths. Also, the normalized distribution could be more convincing, with stock prices expected to increase over the short term.
nflx monte carlo (custom platform)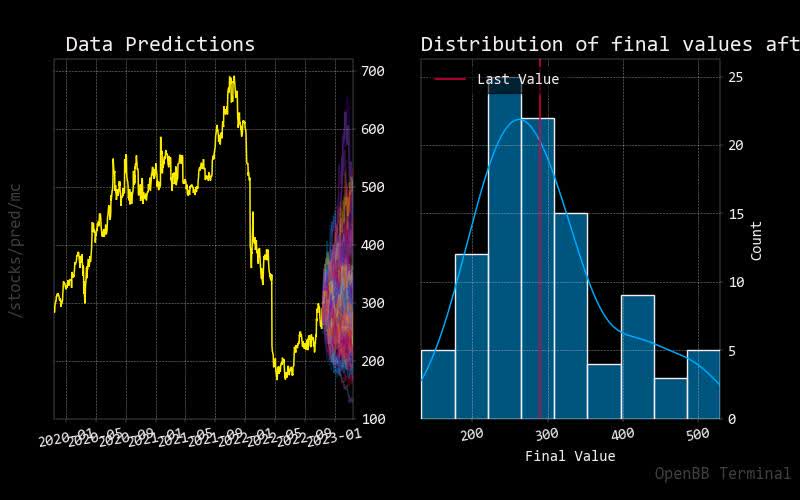
Regression
Another way to build clarification is by using regression. Here we can see that the 30-day forecast of the red regression line shows expected higher price action. Between these sets of artificial intelligence tools, it is hopeful that we can determine clarity on Netflix’s stock price.
nflx regression (custom platform)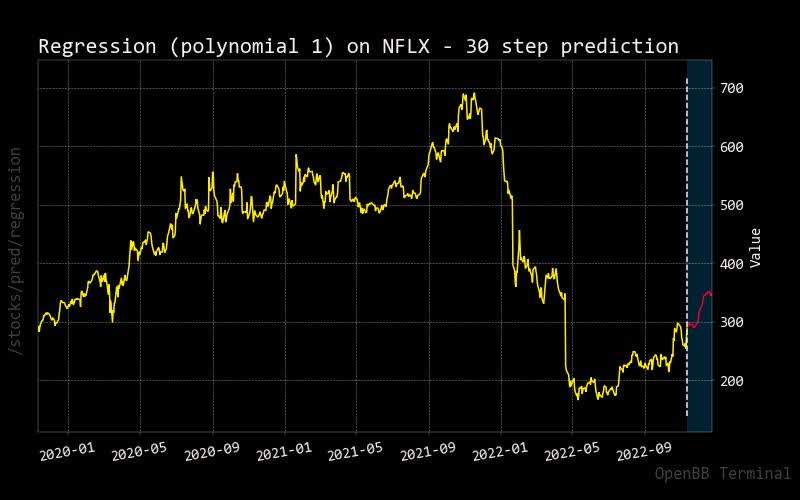
Risk Shows Short-Term Gain
Short Volume Vs. Total Trading Volume
As the stock price for Netflix builds, so does trading volume. However, the most recent activity shows a higher level of shorting against the total trading volume. Does this mean confident investors are willing to short it as the stock price increases? It appears so, based on the chart below.
nflx shorting (custom platform)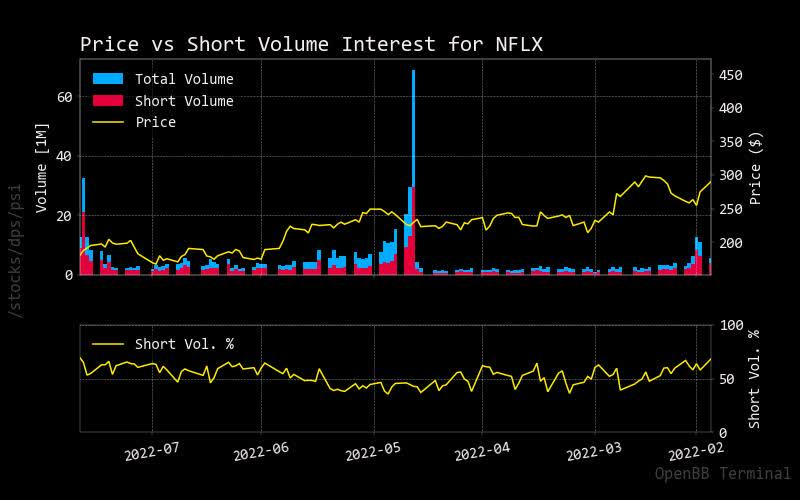
Source: StockGrid
Recommendation
Given the current stock performance based on their simple moving average periods, one could see why market analysts would recommend an overwhelming buy call for Netflix.
|
Interval |
Recommendation |
Buy |
Sell |
Neutral |
|
One month |
BUY |
14 |
3 |
9 |
|
One week |
BUY |
15 |
1 |
10 |
|
One day |
BUY |
15 |
2 |
9 |
Source: Trading View
Price Target
When Netflix came off its peak, there were a few instances of market analysts expecting a much higher stock price target than what Netflix could deliver. Otherwise, the stock price has performed well, meeting expectations from these targets.
nflx target (custom platform)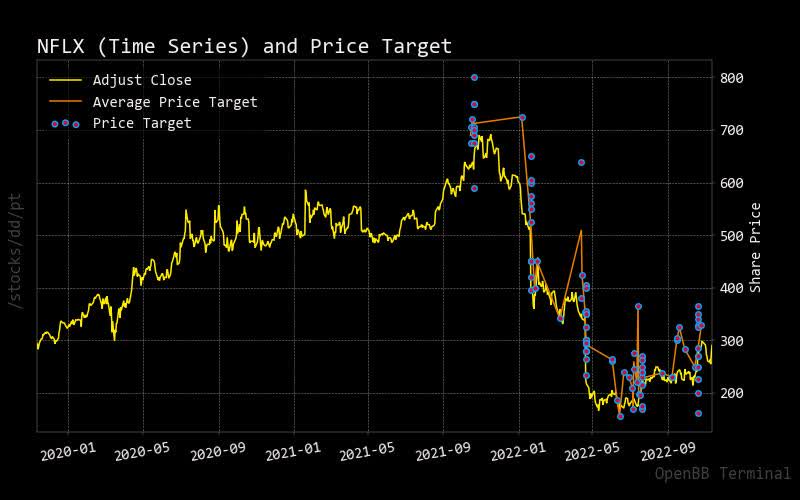
Source: BusinessInsider
Sustainability
Would sustainability or ESG matter for an online video service? Do large pension holders require this of companies they invest in? For example, Netflix has been operating on online servers – certain investment activists might ask questions about this.
|
Metric |
Value |
|
Social score |
6.83 |
|
Governance score |
9.34 |
|
Total ESG |
16.25 |
|
Highest controversy |
2 |
|
ESG performance |
UNDER_PERF |
|
Percentile |
13.39 |
|
Environment score |
0.09 |
Source: Yahoo Finance
Conclusion
With no precise, forward-looking guidance estimates, investors are left with questions about the general trend of Netflix shares. Other tools are used to confirm the current trend, which shows that decent high-performing returns can be expected. Going into next year will be a big question that cannot be answered. As a result, without this information, I would rate Netflix a hold.
Be the first to comment