

Natural Gas Outlook – Talking Points
- Colder temperatures expected across the Southern US next week may lift natural gas prices
- EIA storage report due out Thursday will likely drive prices going into the weekend
- Prices look to maintain slight bullish bias if trendline support continues to hold

Recommended by Thomas Westwater
Get Your Free Top Trading Opportunities Forecast
Natural gas may shift higher after an updated temperature outlook from the National Weather Service’s Climate Prediction Center. It showed an increased likelihood for colder-than-average temperatures in the central United States over the next 8 to 14 days. Natural gas is heavily utilized as a heating fuel source making its price highly subject to changes in weather as well as supply and demand factors in the market.
NOAA 8-14 DAY OUTLOOK TEMPERATURE PROBABILITY
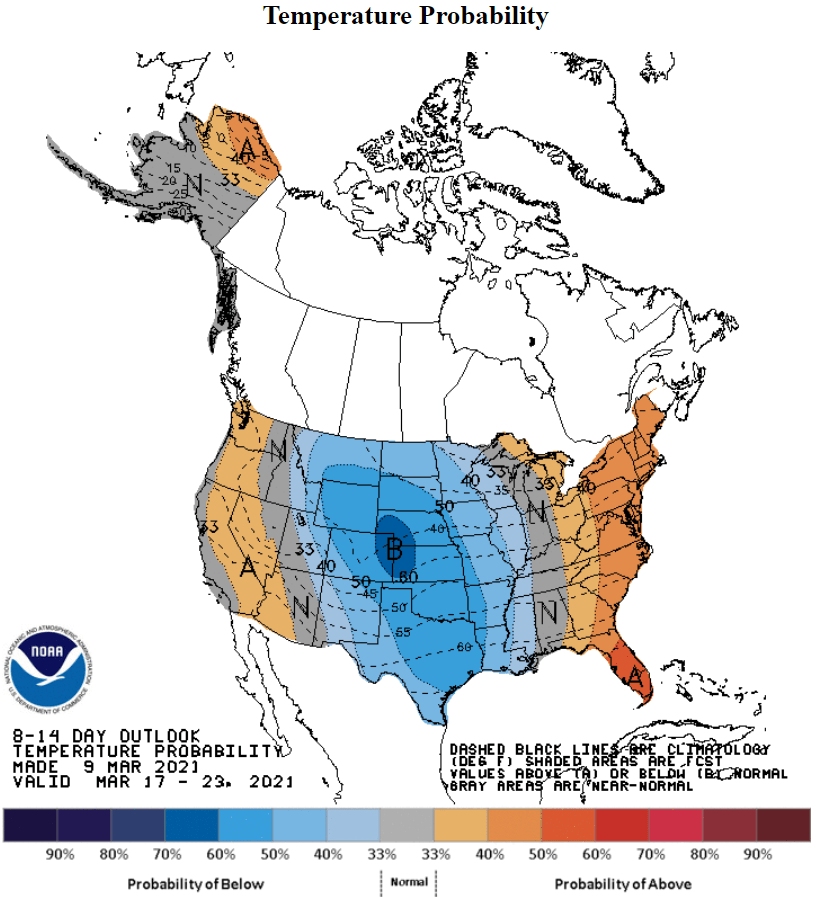
Source: NOAA
That said, supply and demand functions within the market may give natural gas a boost in the near term. The latest Weekly Natural Gas Storage Report (released March 4) from the US Energy Information Administration (EIA) revealed that underground storage levels continued to move lower for the week ending February 26, dropping 98 Bcf (billion cubic feet) from the week prior.
While the falling inventory bodes well for natural gas prices through the supply function, demand will need to lift in tandem for prices to see a significant climb. If the temperature outlook pans out, a bullish swing higher will likely occur. The major US storm system that barreled through Texas last month is one factor that caused inventory levels to drop below the 5-year average. The next EIA storage report is set to cross the wires on Thursday, according to the DailyFX Economic Calendar.
EIA Underground Inventory Levels

Source: EIA
Natural Gas Technical Outlook
Month to date, natural gas prices are down nearly 4.5% despite the improvements seen in storage levels. The 38.2% Fibonacci retracement level from the October – December move provided support against a move lower but quickly gave way. A loosely formed trendline from the September swing low now appears to be underpinning prices.
A break lower would likely open the door for prices to drop and take aim at the 23.6% Fibonacci level just above the 2.5 handle. If that level gives way, the 200-day Simple Moving Average (SMA) moves into scope. Alternatively, if trendline support holds a near-term bounce may help orient prices higher and retake the 38.2% Fib level.
Natural Gas Daily Price Chart
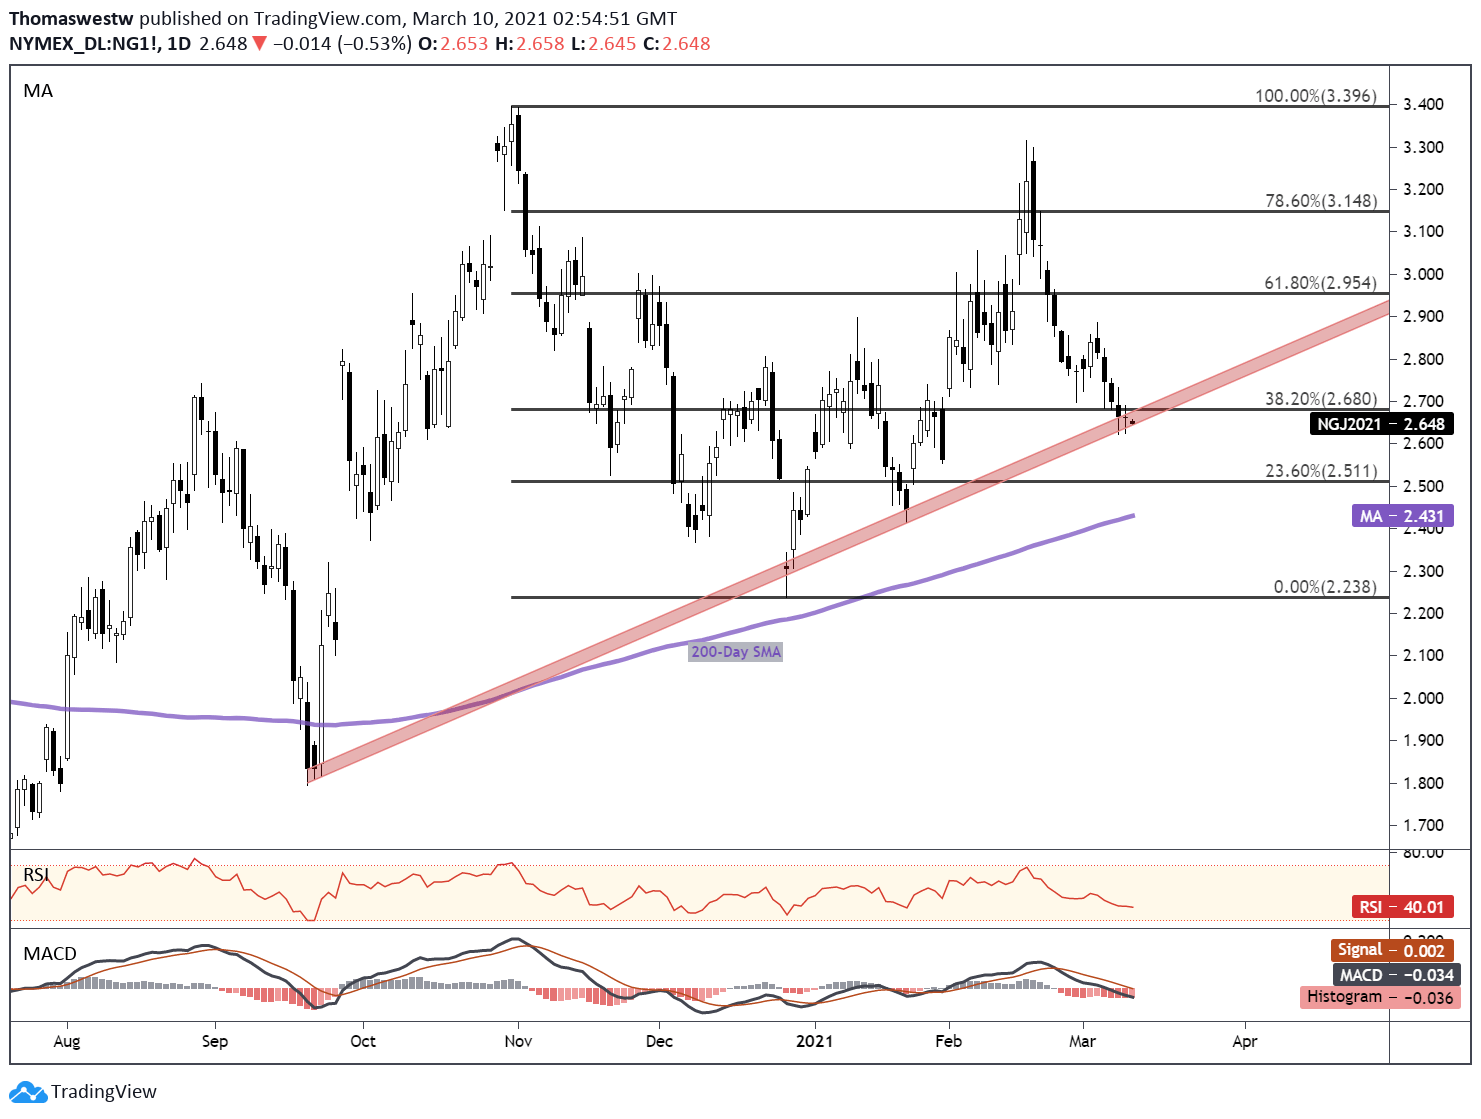
Chart created with TradingView
Natural Gas TRADING RESOURCES
— Written by Thomas Westwater, Analyst for DailyFX.com
To contact Thomas, use the comments section below or @FxWestwater on Twitter
Be the first to comment