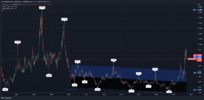
Natural gas was in freefall overnight, along with most other mineral commodities. Last night’s dip was the deepest since we came put of the GFC:
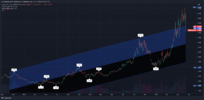
The longer term perspective is quite interesting, as shown in the weekly chart:
My view is that we are into a new paradigm unless Russia is let off its leash. Gas is seen as the transitional energy source from coal, so its demand is set to continue increasing this decade. Pipelines and LNG trains take years plan, then build, so there is no magic wand that can be waved to fix this.


Be the first to comment