

Leonid Sorokin
In my opinion, the Nationwide Risk-Managed Income ETF (NYSEARCA:NUSI) is promising something that is not achievable. It is trying to offer a broad index-like return with high income and downside protection. Unfortunately, empirical evidence shows investors are left with a fund that caps upside during bull markets in return for a small amount of downside protection during a 30% bear market. Not worth it in my opinion.
Fund Overview
The Nationwide Nasdaq-100 Risk-Managed Income ETF provides high current income with downside protection. The fund has $550 million in assets.
Strategy
The NUSI ETF uses a rules-based options trading strategy to produce high income using the Nasdaq-100 Index. It also uses a fully financed market hedge to reduce downside capture.
According to the fund’s whitepaper, the NUSI ETF uses a protective collar option strategy to generate income (from writing calls) to buy protection (buying puts) and pay distributions to unitholders (Figure 1).
Figure 1 – Illustrative protective collar strategy (nationwidefinancial.com)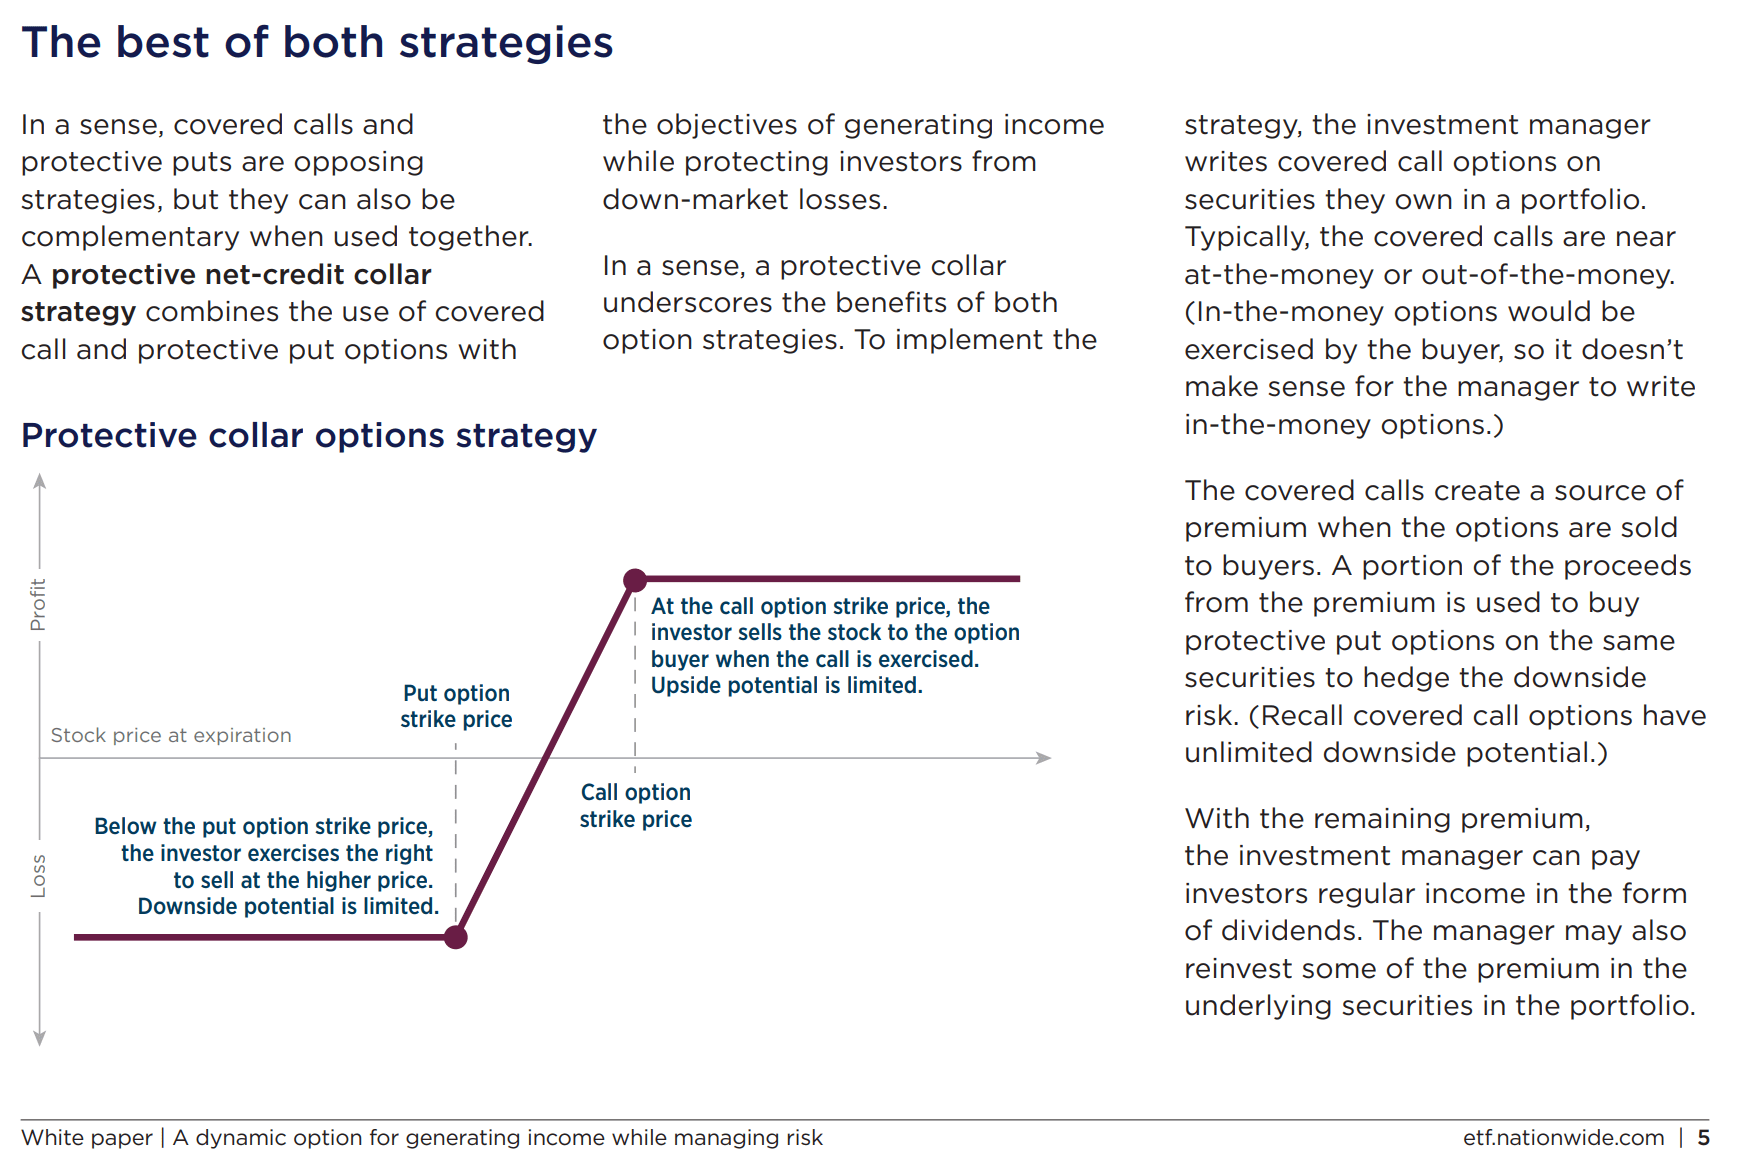
In a rising market, the fund benefits from capital appreciation and dividends from the fund’s holdings and premium from written calls. However, the fund’s upside is capped, as large upside moves beyond the call option strike are forfeit in exchange for the option premium. The fund also suffers from the long put option decay.
In a sideways market, the fund benefits from dividends and the written call premiums but suffers from put option decay.
In a moderately down market (above the strike price of the put options), the fund benefits from dividends and the written call premiums, and potentially from the long put option increasing in value prior to expiration. However, the fund suffers from any capital drawdowns that are above the put option strike price. The put options also expire worthless if the depreciation is less than the strike price.
Finally, in a steeply declining market (beyond the strike price of the put options), the fund benefits from dividends and written call premiums, as well as the increase in value of the put options. However, the fund suffers from depreciation of the underlying up to the put option strike price.
The idea of the fund is to sell upside to generate income and pay for hedges for sharp declines (like the 2020 COVID meltdown).
Portfolio Holdings
The NUSI fund holds essentially the same equity portfolio as the Nasdaq-100 Index. It’s top holdings are shown in Figure 2.
Figure 2 – NUSI ETF top holdings (nationwidefinancial.com)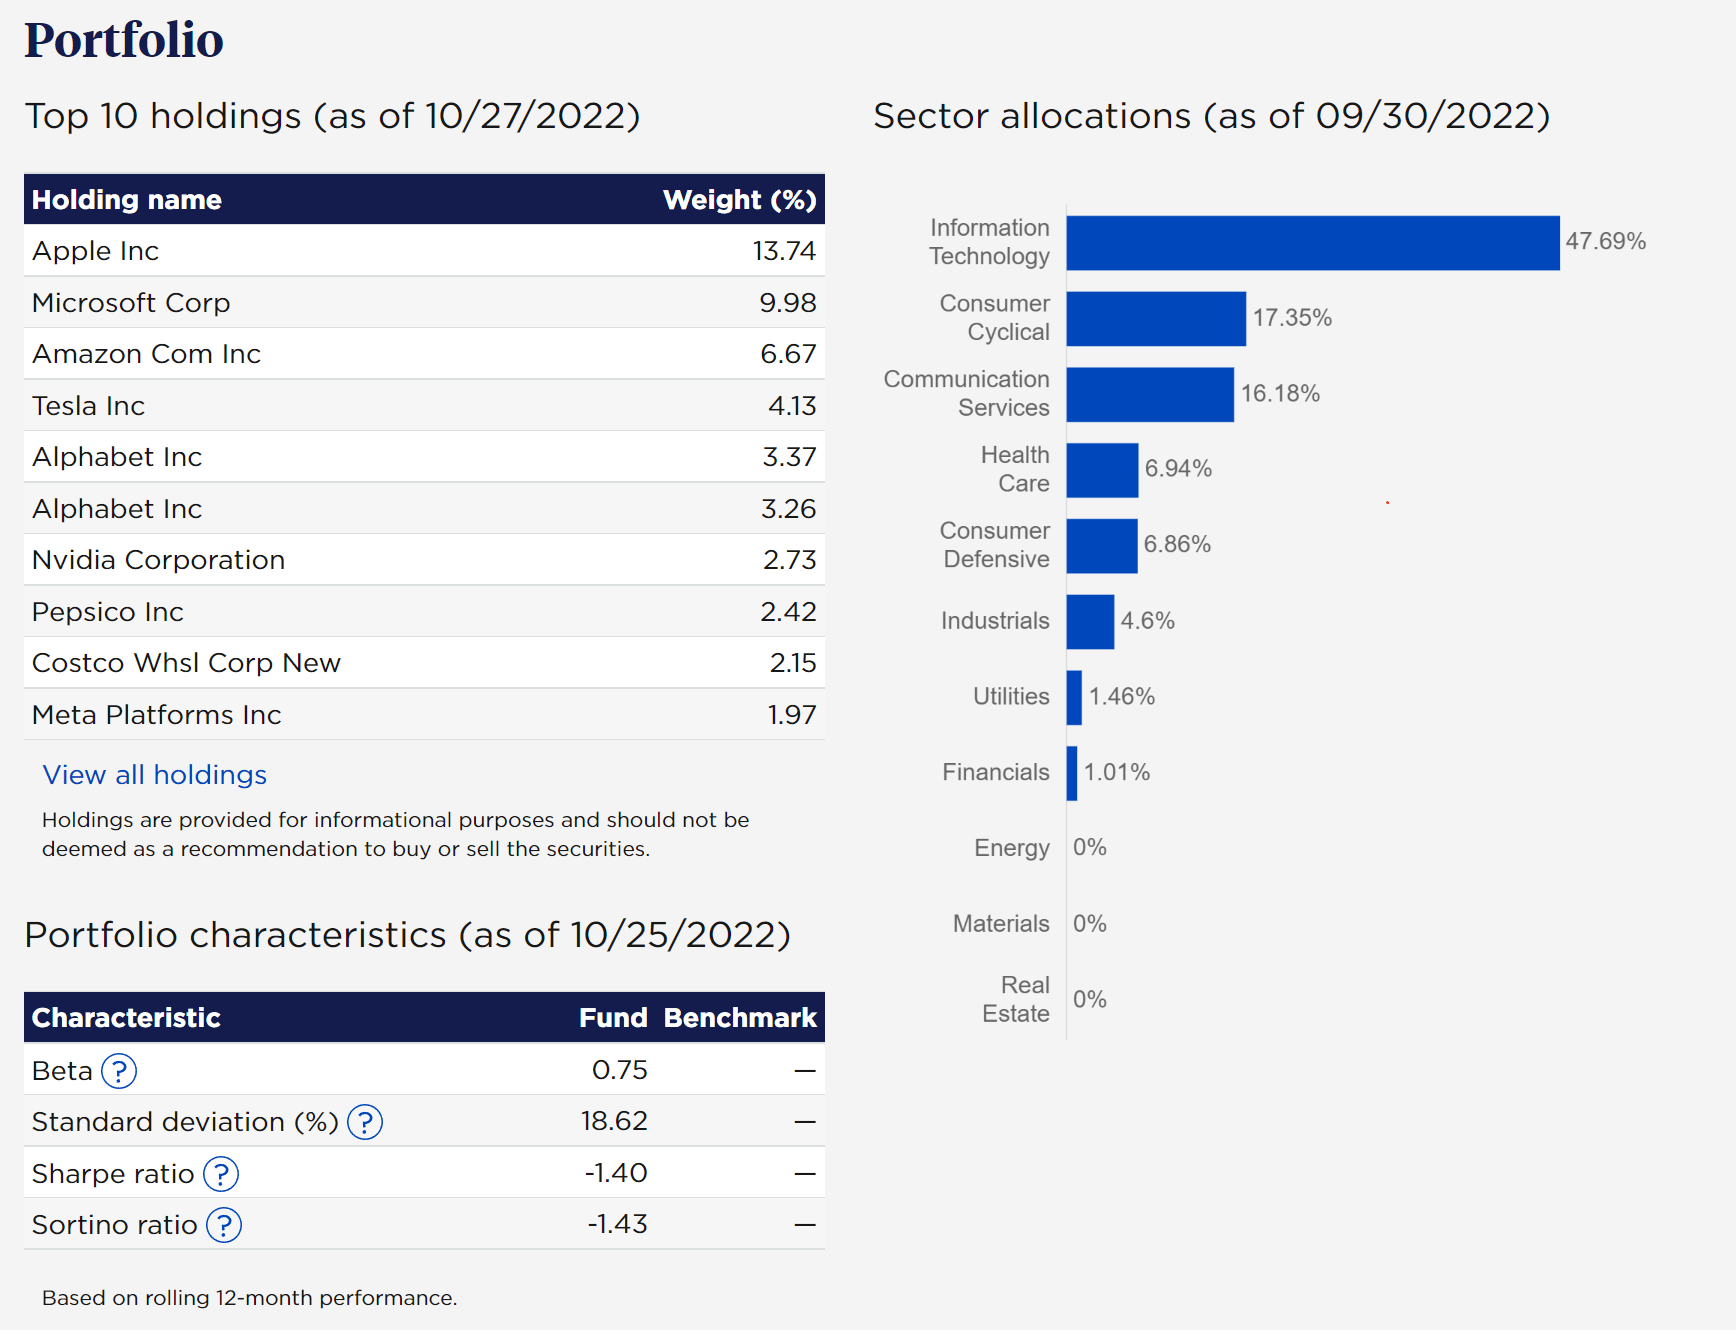
As of October 28, 2022, the fund has written 2.76% of Nasdaq-100 Index call options with a 11,150 strike (the NDX index closed at 11,192 on October 27th), and owns put options with a 1.51% weight of Nasdaq-100 Index put options with a 10,500 strike (Figure 3).
Figure 3 – NUSI ETF option positions (NUSI October 28th, 2022 Holdings Report)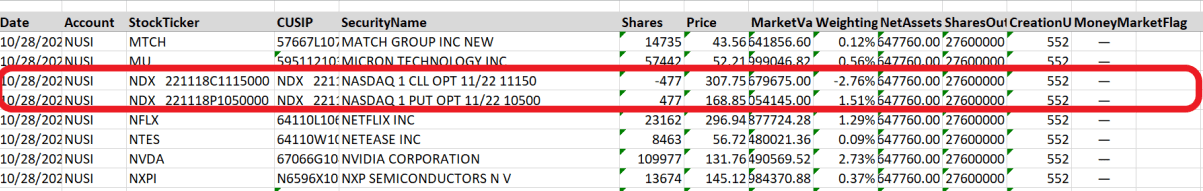
Returns
Returns for the NUSI fund have been poor. The fund has a 1-yr return of -23.6%, and a YTD return of -26.3% to September 30, 2022. Since its inception on December 19, 2019, the fund has average annual returns of -1.2% (Figure 4).
Figure 4 – NUSI Returns (nationwidefinancial.com)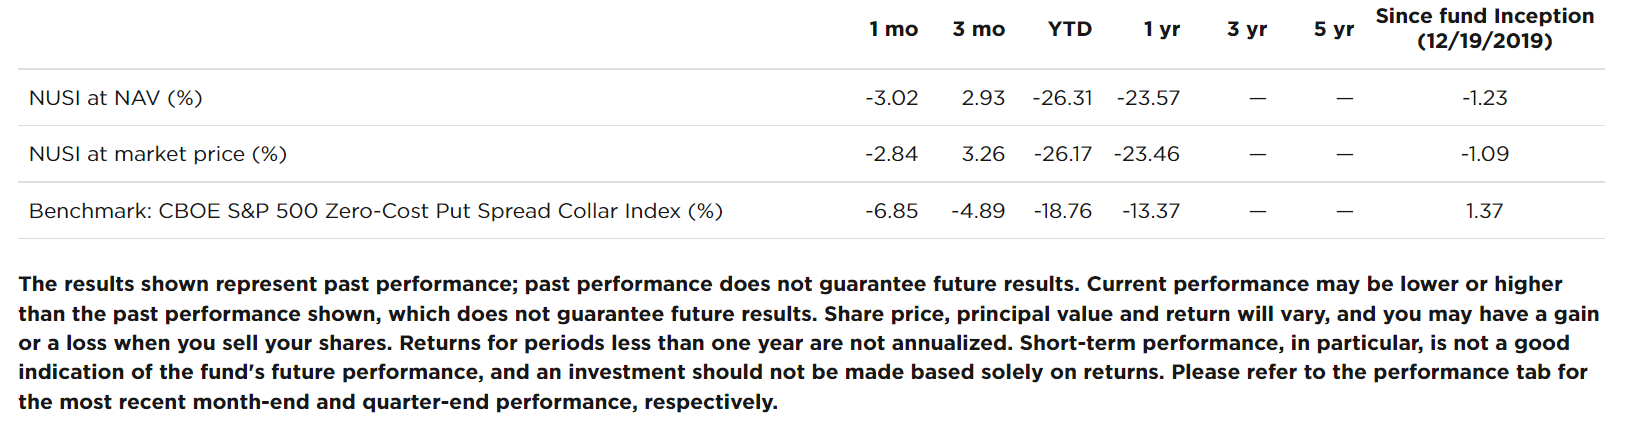
In total returns, the NUSI fund has returned -3.8% since inception, based on market price. For comparison, the Nasdaq-100 Index has increased 29.2% to September 30, 2022, and the Invesco QQQ ETF (QQQ), which is modelled after the Nasdaq-100 Index, has returned 31.4% (Figure 5).
Figure 5 – NUSI vs. NDX vs. QQQ (Seeking Alpha)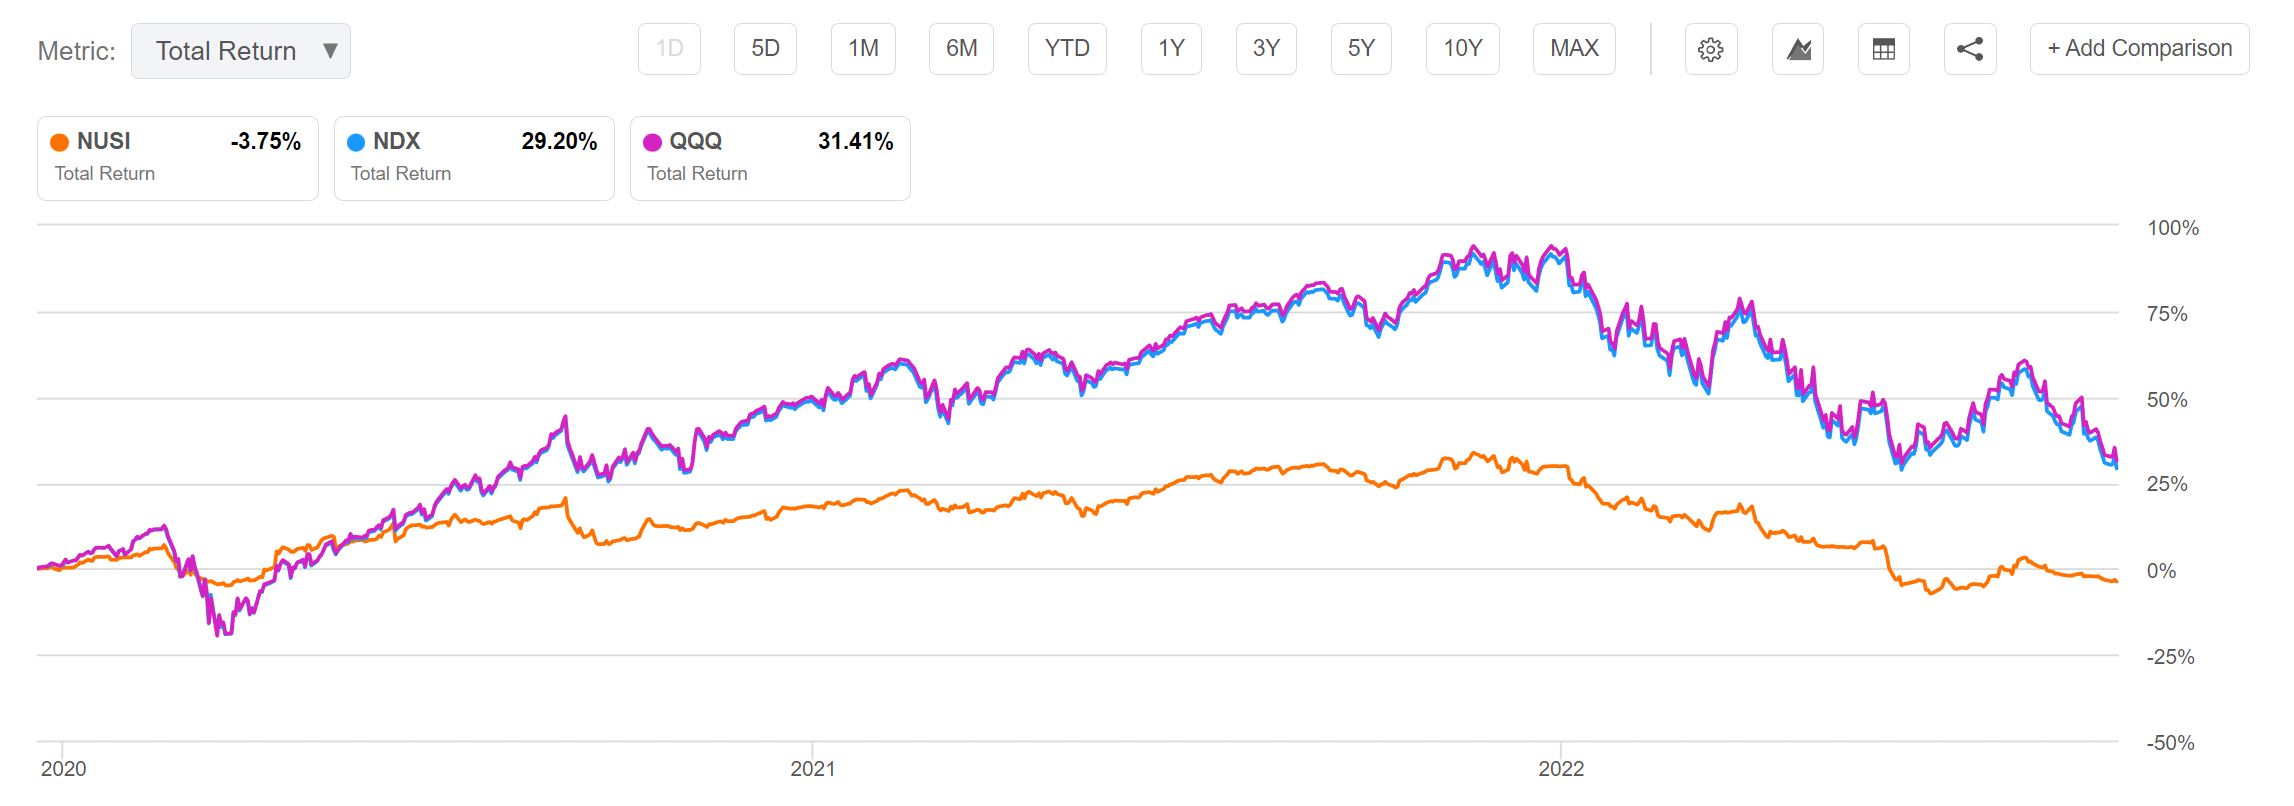
Distribution & Yield
The NUSI ETF pays a high distribution yield, with LTM distribution of $1.79 / unit which equates to a trailing yield of 9.4% (Figure 6). The distribution paid is monthly and variable and depends on the income generated in the portfolio as well as the cost of the option hedges. The most recent distribution amount of $0.125 /unit was paid on October 28, 2022.
Figure 6 – NUSI Distribution (Seeking Alpha)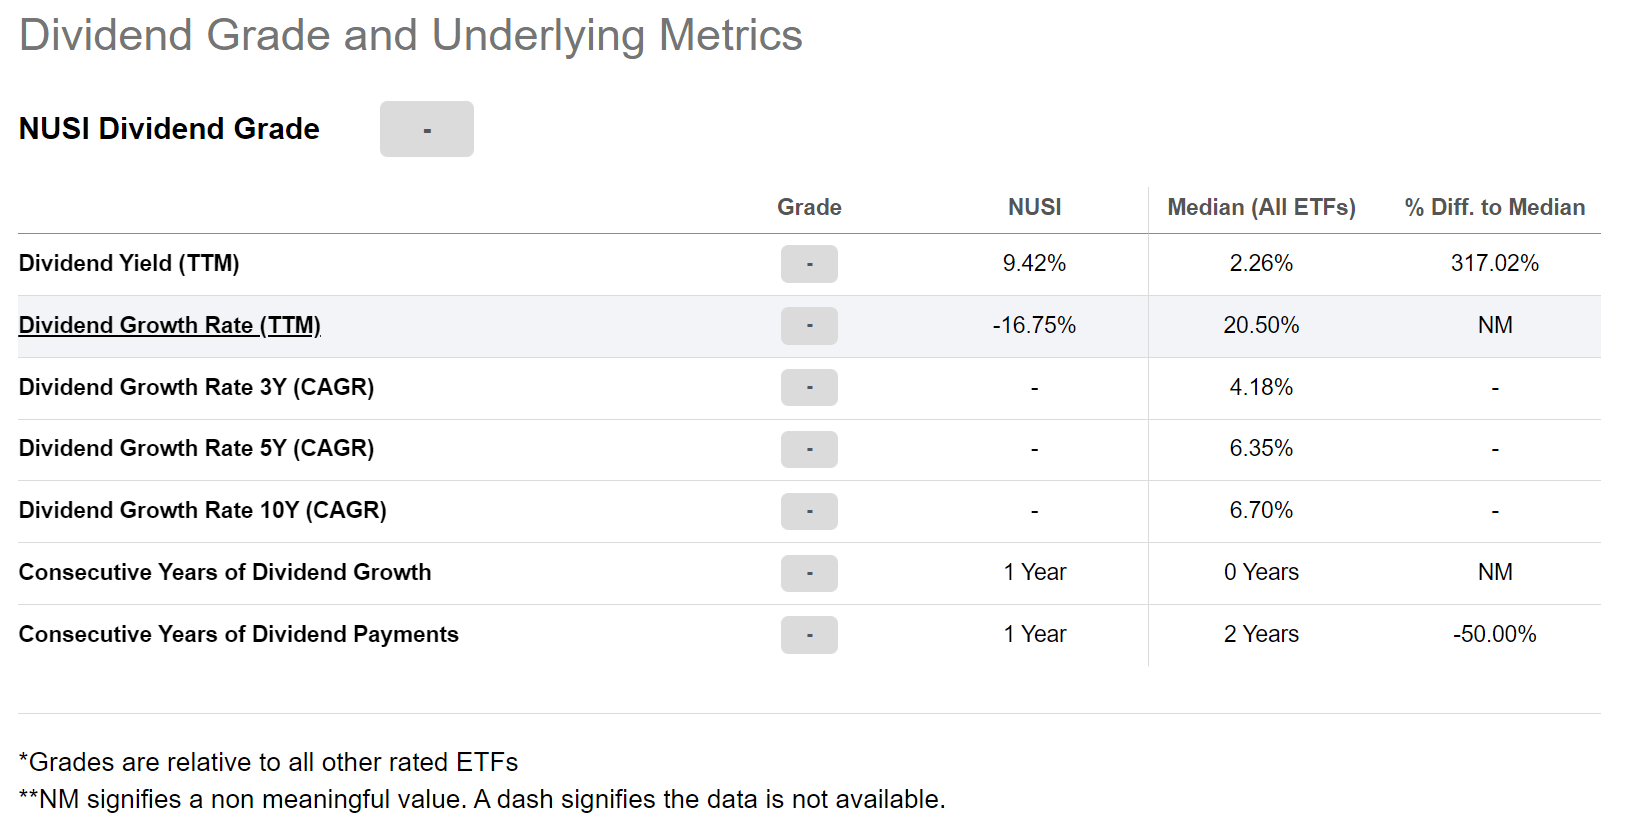
Fees
The NUSI fund charges a relatively high expense ratio of 0.68%.
About That Hedge…
With the Nasdaq-100 Index having fallen 32.4% YTD, most investors would have assumed some sort of protection kicking in for the NUSI ETF. However, the NUSI ETF is also down significantly at -26.3% YTD. Furthermore, in 2020 when the QQQ ETF rallied 48.4%, the NUSI ETF only rallied 18.6% as the upside was capped due to written calls. In 2021, the returns were 27.4% for QQQ vs. 9.8% for NUSI (Figure 7).
Figure 7 – NUSI Calendar year returns vs. QQQ (Author created using Portfolio Visualizer)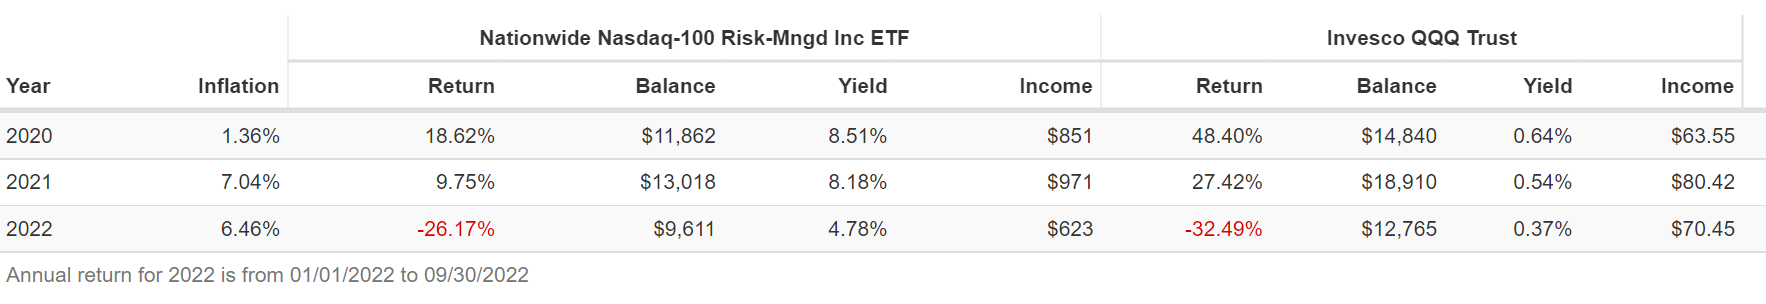
So in reality, the ‘downside protection’ offered by the NUSI ETF (~6% so far in 2023), is more than offset by the forgone upside in 2020 and 2021. So while the QQQ ETF still has a respectable CAGR returns of 9.3% (January 2020 to September 2022), the NUSI ETF has a -1.4% CAGR return.
Figure 8 – NUSI vs. QQQ (Author created with Portfolio Visualizer)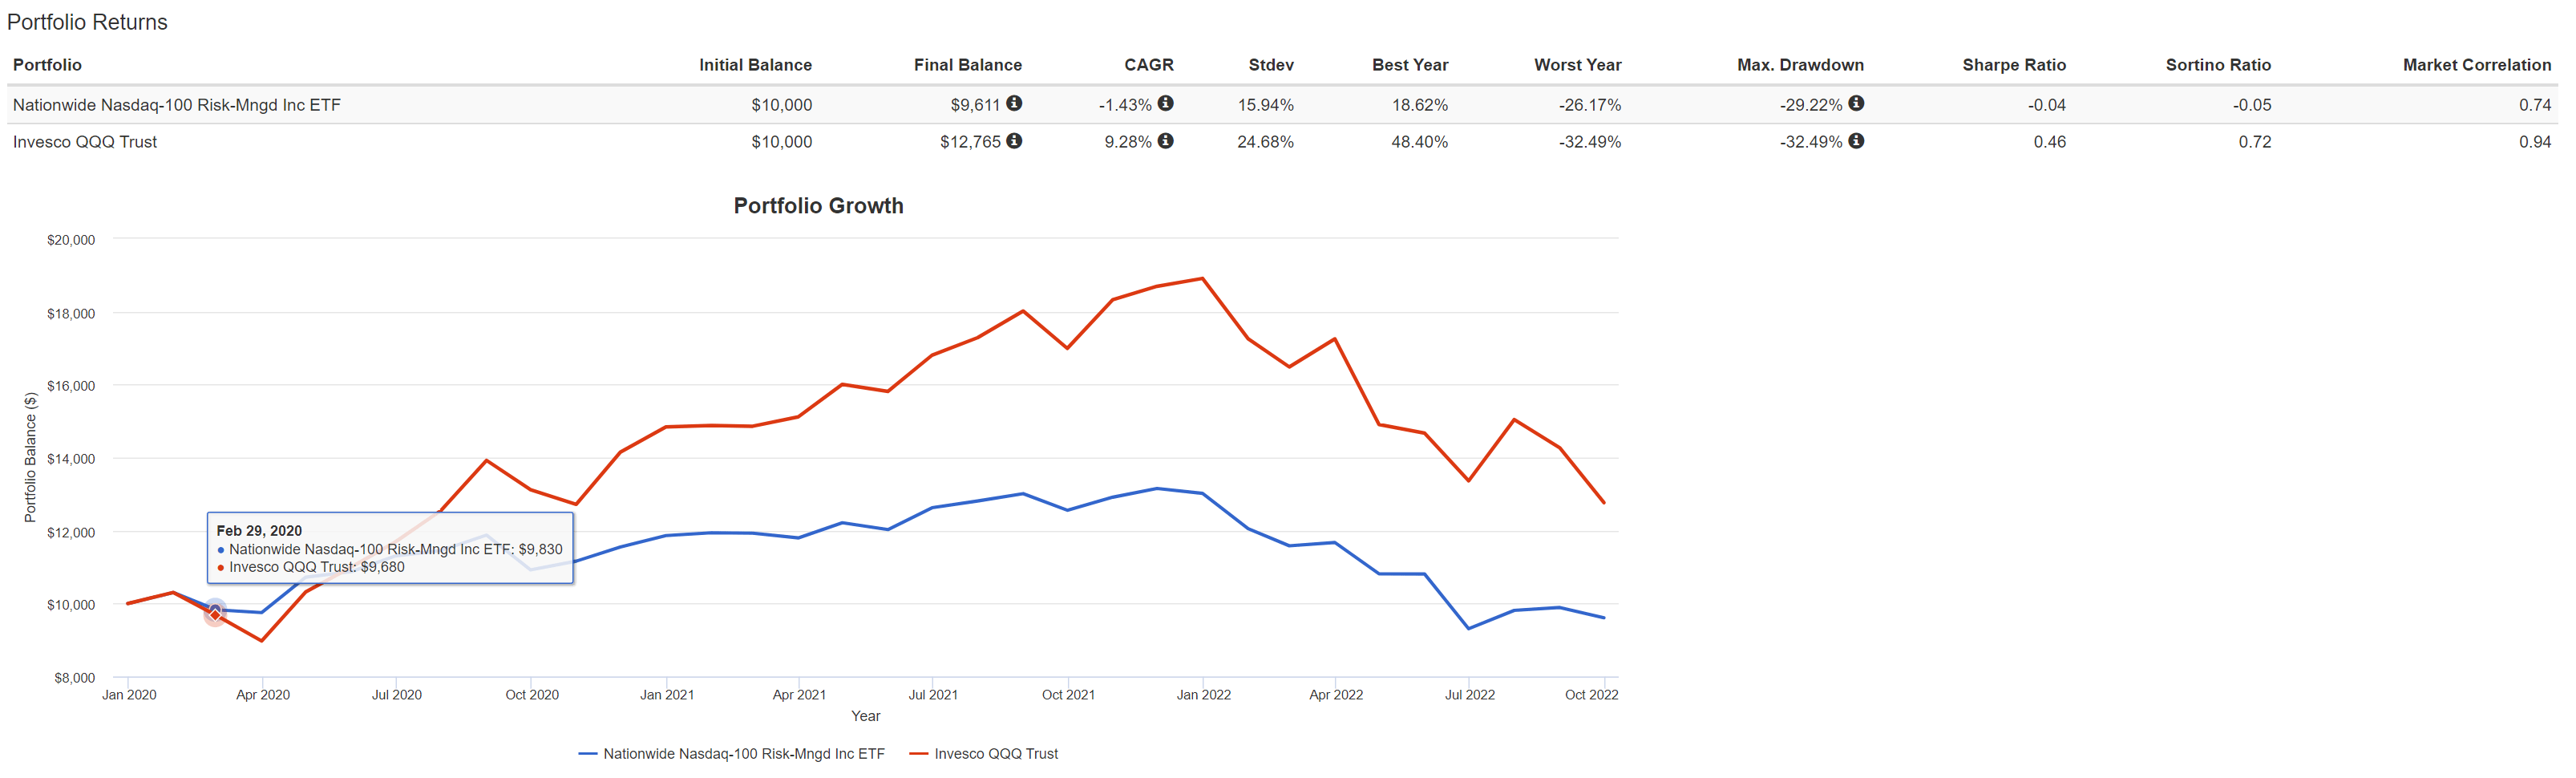
Conclusion
In conclusion, I think the NUSI ETF is promising something that is not achievable, in my opinion. It is trying to offer a broad index-like return with high income and downside protection. Investors are better off buying-and-holding low-cost broad index ETFs like the QQQ or SPDR S&P 500 ETF Trust (SPY) if they want index-like returns. If they want high income, they may want to consider income growth funds like the Schwab U.S. Equity Dividend ETF (SCHD). If they are worried about valuation and want downside protection, they may want to reduce their overall exposure.
Be the first to comment