

NASDAQ 100 OUTLOOK:
- Nasdaq 100 tanks on souring investor sentiment amid heightened geopolitical tensions in Eastern Europe
- The crisis in Ukraine sparks a furious rally in the energy market, raising concerns over global growth and inflation
- The appearance of a daily cross on the Nasdaq 100 daily chart sends a chilling signal about the tech index outlook
Most recent: S&P 500 Forecast – Continued Volatility with an Upward Bias
U.S. stocks traded sharply lower on Tuesday, weighed down by rising geopolitical tensions and strong appetite for safe haven positions (Treasuries, precious metals, etc.), as volatility spiked across asset classes (the VIX surged 12% to 34).
The crisis in Ukraine continued to deteriorate, with the Russian military shelling cities around the clock and causing widespread destruction in its effort to force President Zelensky’s government to capitulate and surrender.
The West, led by the United States, has responded forcefully to this aggression, imposing heavy economic costs on Moscow, including banning certain financial institutions from the SWIFT system and freezing the assets of the Central Bank(CBR) to prevent the institution from propping up the country’s currency. As a result, the Russian ruble (RUB) has plummeted, weakening by more than 30% against the U.S. dollar in the last couple of days.
At this precise moment, the future is uncertain, but investors fear that the conflict in Eastern Europe will get worse before it gets better, which could lead to severe energy trade disruptions. For this reason, oil prices exploded higher during the session, with WTI and Brent prices soaring as much as 10% at one point in the morning, despite news that the United States and its allies have agreed to release 60 million barrels of crude from their stockpiles.
Elevated oil prices, if sustained, may lead to demand destruction and softer economic growth, reinforcing inflationary pressures at the worst possible time, when U.S. CPI sits at a four-decade high (7.5% y/y in January). This scenario couldprompt the Fed to raise interest rates faster than expected in the coming months to ensure that inflation expectations remain stable and do not overshoot.
Against this backdrop, the S&P 500 plummeted 1.55% to 4,306, while the Nasdaq 100 sank 1.63% to 14,005 at the closing bell. The specter of stagflation is indeed scary, but traders may be getting ahead of themselves as the U.S. economy is still strong and the fundamental picture for Corporate America remains healthy.
It is also worth noting that localized military conflicts only tend to hurt confidence for a short period of time before giving way to strong rebounds. When the dust settles and sentiment recovers, stocks that have fallen too much on geopolitics may be well positioned for strength heading into the March FOMC meeting. That said, I remain bullish on the Nasdaq 100 on dips on a tactical basis despite some ominous signals emitted by price action (see tech analysis below).
NASDAQ 100 TECHNICAL ANALYSIS
From a technical perspective, the Nasdaq 100’s bias continues to be negative, perhaps more after the appearance of a death cross on the daily chart (a death cross is a bearish formation created when the 50-day SMA falls below the 200-day SMA from top to bottom). On that note, if selling activity intensifies, the next critical support to consider appears near the 13,780 area, though a slide below this floor may pave the way for a retest of the 2022 low.
On the flip side, if dip buyers return and the tech index pivots higher, resistance is seen at 14,300, followed by 14,465. If bulls manage to propel the price above these levels, buying momentum could strengthen, fueling a move towards 14,901, the 50% Fibonacci retracement of the 2022 decline.
NASDAQ 100 TECHNICAL CHART
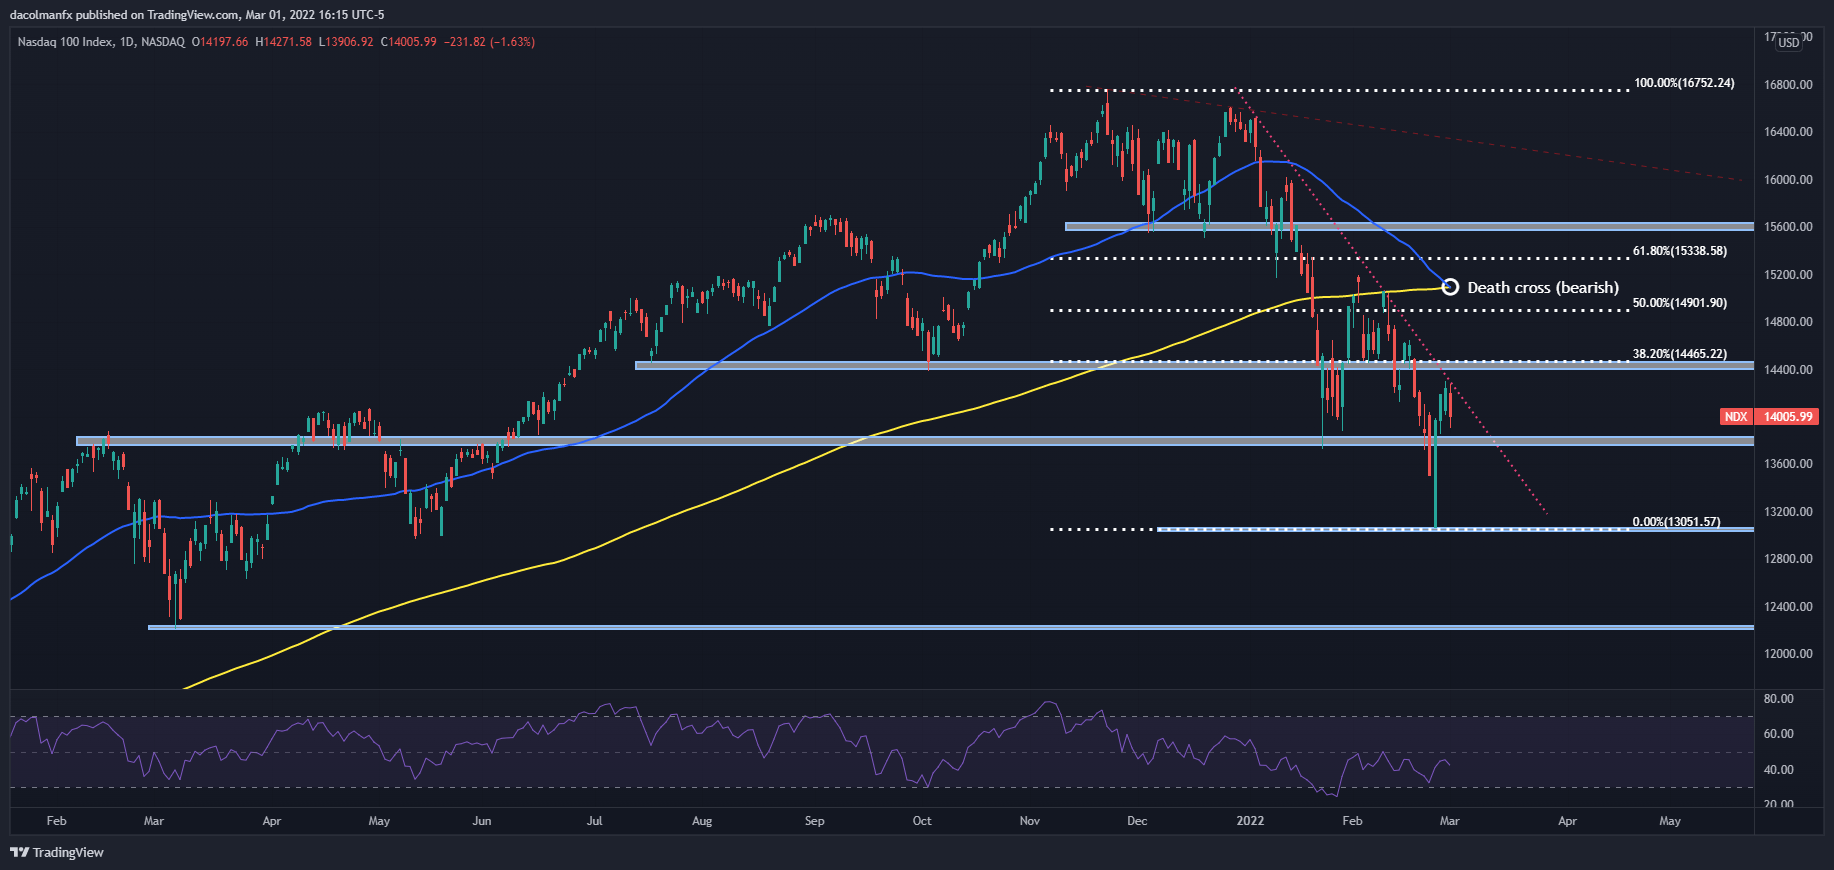
Nasdaq 100 (NDX) chart prepared in TradingView
EDUCATION TOOLS FOR TRADERS
- Are you just getting started? Download the beginners’ guide for FX traders
- Would you like to know more about your trading personality? Take the DailyFX quiz and find out
- IG’s client positioning data provides valuable information on market sentiment. Get your free guide on how to use this powerful trading indicator here.
—Written by Diego Colman, Contributor
Be the first to comment